Unlocking CTCF Function: How Post-Translational Modifications Regulate DNA Binding and 3D Genome Architecture
This article provides a comprehensive synthesis for researchers, scientists, and drug development professionals on the critical role of post-translational modifications (PTMs) in regulating CTCF's DNA binding and architectural functions.
Unlocking CTCF Function: How Post-Translational Modifications Regulate DNA Binding and 3D Genome Architecture
Abstract
This article provides a comprehensive synthesis for researchers, scientists, and drug development professionals on the critical role of post-translational modifications (PTMs) in regulating CTCF's DNA binding and architectural functions. We first establish the foundational landscape of known CTCF PTMs (phosphorylation, acetylation, poly(ADP-ribosyl)ation, SUMOylation) and their direct mechanistic impact on zinc finger domain interactions. The discussion then progresses to methodological approaches for detecting PTM-specific CTCF binding, including advanced ChIP techniques, proteomics, and cutting-edge CUT&Tag applications. Practical guidance is offered for troubleshooting common experimental challenges in PTM-CTCF research, such as antibody specificity and signal interpretation. Finally, we present a comparative analysis of how different PTMs—and their crosstalk—create a dynamic 'PTM code' that fine-tunes genomic insulation and loop formation, with implications for transcriptional dysregulation in disease. This review integrates the latest research to serve as both a primer and a technical resource for navigating this complex layer of epigenetic regulation.
The CTCF PTM Landscape: Foundational Mechanisms of Phosphorylation, PARylation, and Acetylation in DNA Binding
Troubleshooting Guide & FAQs
Q1: My ChIP-qPCR for CTCF shows consistently low or no signal enrichment, despite a validated antibody and confirmed cell line expression. What are the primary troubleshooting steps?
A: Low ChIP signal can stem from several factors. First, verify your chromatin shearing. CTCF binds within nucleosome-dense regions; fragments should be 200-500 bp. Analyze fragment size on a gel. Second, reconsider your fixation conditions. Standard 1% formaldehyde for 10 min may not capture all CTCF interactions; consider a double crosslinking protocol with DSG. Third, the binding site may be affected by PTMs. If the antibody targets the N-terminus and that region is modified, efficiency may drop. Include a positive control primer set for a known, strong CTCF binding site (e.g., at the MYC insulator). Finally, ensure your lysis buffers contain sufficient protease and, critically, phosphatase inhibitors (e.g., 1 mM NaF, 1 mM NaVO₃) to preserve PTM states.
Q2: How can I distinguish if a loss of CTCF binding in my assay is due to a direct mutation in the binding motif versus an upstream signaling event causing a PTM that modulates CTCF affinity?
A: This requires a tiered experimental approach:
- In Vitro Validation: Perform an EMSA with purified, recombinant CTCF protein (full-length and relevant domains) and a probe containing your genomic sequence. If binding is lost with recombinant protein, the issue is likely the DNA sequence itself.
- In Vivo vs. In Vitro Comparison: Perform a parallel ChIP experiment from your cells and a subsequent in vitro binding assay using sheared, protein-free genomic DNA from the same cells and recombinant CTCF. Loss of binding only in the cellular ChIP points to a cellular factor (like a PTM).
- PTM Mimicry/Mutation: Transfert constructs expressing CTCF point mutants (e.g., phospho-null or phospho-mimetic variants at known modification sites) into a CTCF-depleted cell line and repeat ChIP.
Q3: My co-immunoprecipitation (Co-IP) experiment to identify CTCF interacting partners results in high background or non-specific bands. How can I improve specificity?
A: High background in CTCF Co-IP is common due to its large size (~82 kDa) and sticky, charged domains.
- Increase Stringency: Use a higher salt wash buffer (e.g., 300-500 mM NaCl) to disrupt weak, non-specific interactions. Include 0.1% SDS in the final wash.
- Control for DNA Bridging: CTCF interactions can be mediated by DNA. Treat your lysates with Benzonase (25-50 U/mL) or Ethidium Bromide (10-40 µg/mL) prior to IP to degrade or intercalate DNA, respectively. Persisting interactions are more likely direct.
- Validate Antibody Specificity: Pre-clear the lysate with protein A/G beads alone. Use an isotype control IgG for the IP. Consider tagging CTCF (e.g., with a FLAG or Bio tag) and using tag-based purification as a cleaner alternative.
Q4: When designing primers for CTCF ChIP-qPCR around a suspected binding site, what specific considerations related to its binding motif are critical?
A: CTCF binds a ~15 bp asymmetric motif with a core consensus. Your amplicon must be centered directly on the predicted motif. The motif directionality can matter, as flanking sequences influence binding. Design primers no more than 75-100 bp away from the motif center to ensure the sheared fragment containing the motif is amplified. Always include a negative control region at least 5 kb away from any known CTCF site or other regulatory element. Use public ChIP-seq data (e.g., from ENCODE) to guide your design.
Detailed Experimental Protocols
Protocol 1: Double Crosslinking Chromatin Immunoprecipitation (ChIP) for CTCF and Its Modified Forms
Objective: To capture CTCF-DNA interactions that may be stabilized or transient due to post-translational modifications.
Reagents:
- Disuccinimidyl glutarate (DSG), freshly prepared in DMSO.
- 1% Formaldehyde in PBS.
- 2.5 M Glycine, quencher.
- Lysis Buffer 1: 50 mM HEPES-KOH pH 7.5, 140 mM NaCl, 1 mM EDTA, 10% Glycerol, 0.5% NP-40, 0.25% Triton X-100, plus protease/phosphatase inhibitors.
- Lysis Buffer 2: 10 mM Tris-HCl pH 8.0, 200 mM NaCl, 1 mM EDTA, 0.5 mM EGTA, plus inhibitors.
- Sonication Buffer: 10 mM Tris-HCl pH 8.0, 100 mM NaCl, 1 mM EDTA, 0.5 mM EGTA, 0.1% Na-Deoxycholate, 0.5% N-Lauroylsarcosine, plus inhibitors.
- Protein A/G Magnetic Beads, pre-blocked with BSA and sonicated salmon sperm DNA.
- CTCF-specific antibody (validated for ChIP) and species-matched IgG.
- Elution Buffer: 50 mM Tris-HCl pH 8.0, 10 mM EDTA, 1% SDS.
- Reverse Crosslinking Buffer: 200 mM NaCl.
Methodology:
- Double Crosslinking: For adherent cells, add DSG to culture media (final 2 mM). Incubate 45 min at room temperature. Wash with PBS. Add 1% formaldehyde, incubate 10 min at RT. Quench with 0.125 M glycine for 5 min.
- Cell Lysis: Scrape cells, pellet. Resuspend in 1 mL Lysis Buffer 1, incubate 10 min on rotator at 4°C. Pellet, resuspend in 1 mL Lysis Buffer 2, incubate 10 min. Pellet.
- Chromatin Shearing: Resuspend pellet in 1 mL Sonication Buffer. Sonicate using a focused ultrasonicator (e.g., Covaris) to achieve 200-500 bp fragments. Centrifuge to clear debris.
- Immunoprecipitation: Pre-clear lysate with beads for 1 hr. Incubate supernatant with 2-5 µg of CTCF antibody or IgG overnight at 4°C. Add blocked beads for 2 hrs.
- Washes: Wash beads sequentially with: Low Salt Wash Buffer (0.1% SDS, 1% Triton, 2 mM EDTA, 20 mM Tris, 150 mM NaCl), High Salt Wash Buffer (as before, but 500 mM NaCl), LiCl Wash Buffer (0.25 M LiCl, 1% NP-40, 1% Na-Deoxycholate, 1 mM EDTA, 10 mM Tris), and twice with TE Buffer.
- Elution & Reverse Crosslink: Add 150 µL Elution Buffer to beads, incubate at 65°C for 30 min with shaking. Transfer supernatant, add 6 µL 5M NaCl and 2 µL RNase A, incubate at 65°C overnight.
- DNA Purification: Add Proteinase K, incubate 2 hrs at 45°C. Purify DNA using a silica column kit. Analyze by qPCR or sequencing.
Protocol 2: Electrophoretic Mobility Shift Assay (EMSA) for CTCF-DNA Binding Affinity Measurement
Objective: To measure the direct binding affinity of wild-type or post-translationally modified CTCF protein to its consensus DNA motif in vitro.
Reagents:
- Purified recombinant CTCF Zinc Finger Domain (ZF 3-7) or full-length protein.
- Biotin- or Cy5-end-labeled double-stranded DNA probe containing the canonical CTCF motif.
- Unlabeled specific competitor (same sequence) and non-specific competitor (e.g., poly(dI-dC)).
- Binding Buffer: 10 mM Tris, 50 mM KCl, 1 mM DTT, 2.5% Glycerol, 0.05% NP-40, 5 mM MgCl2, pH 7.5.
- 6% DNA Retardation (non-denaturing) Polyacrylamide Gel, pre-run in 0.5x TBE.
- Electrophoresis system and transfer apparatus for nylon membrane (if using biotin).
Methodology:
- Probe Preparation: Anneal complementary oligonucleotides to form the dsDNA probe. Label with biotin or fluorescent dye.
- Binding Reaction: In a 20 µL reaction, combine Binding Buffer, 1 µg poly(dI-dC), 0.5-2 nM labeled probe, and increasing amounts of CTCF protein (0, 1, 2, 5, 10, 20 nM). For competition, add 100-fold molar excess of unlabeled specific probe. Incubate 30 min at RT.
- Electrophoresis: Load reactions onto the pre-run gel. Run in 0.5x TBE buffer at 100 V for 60-90 min at 4°C (keep cold).
- Detection:
- For fluorescent probes: Image gel directly using a fluorescence scanner.
- For biotin probes: Transfer to a positively charged nylon membrane via wet transfer. Crosslink DNA, then detect using a chemiluminescent nucleic acid detection kit.
- Analysis: Quantify the intensity of the shifted band vs. free probe. Plot bound/free ratio against protein concentration to estimate apparent Kd.
Data Presentation
Table 1: Common CTCF Post-Translational Modifications and Their Reported Effects on DNA Binding
| PTM Type | Residue(s) | Modifying Enzyme | Effect on DNA Binding | Key Functional Outcome |
|---|---|---|---|---|
| Phosphorylation | Ser 224, Ser 365 (Mouse) | PKCα | Inhibits | Reduces insulator activity, promotes apoptosis. |
| Phosphorylation | Thr 374, Ser 402, Ser 610 (Human) | CDK2 | Modulates (context-dependent) | Regulates cell cycle-dependent binding at subset of sites. |
| Poly(ADP-ribosyl)ation | Multiple | PARP1 | Inhibits | Displaces CTCF from chromatin during DNA damage response. |
| Ubiquitination | Lys 74, Lys 689 (Human) | Unknown E3 Ligase | Can target for degradation | Regulates protein turnover levels. |
| Sumoylation | Lys 74, Lys 689 (Human) | Unknown | May stabilize or alter interactions | Proposed in transcriptional repression. |
Table 2: Troubleshooting Common CTCF Experimental Issues
| Problem | Possible Cause | Solution |
|---|---|---|
| Low ChIP-seq library complexity | Over-sonication or under-sonication | Optimize sonication to yield majority of fragments between 200-500 bp. Use a Covaris or Bioruptor. |
| High background in EMSA | Non-specific protein-DNA interactions | Increase non-specific competitor (poly(dI-dC)) concentration. Include a cold specific competitor control. |
| CTCF protein degradation in lysates | Inadequate protease inhibition | Add fresh, broad-spectrum protease inhibitors (e.g., PMSF, Leupeptin, Aprotinin) to all buffers. |
| Inconsistent Co-IP results | Variable cell lysis efficiency | Use a Dounce homogenizer for consistent nuclear lysis. Confirm lysis under microscope. |
Visualizations
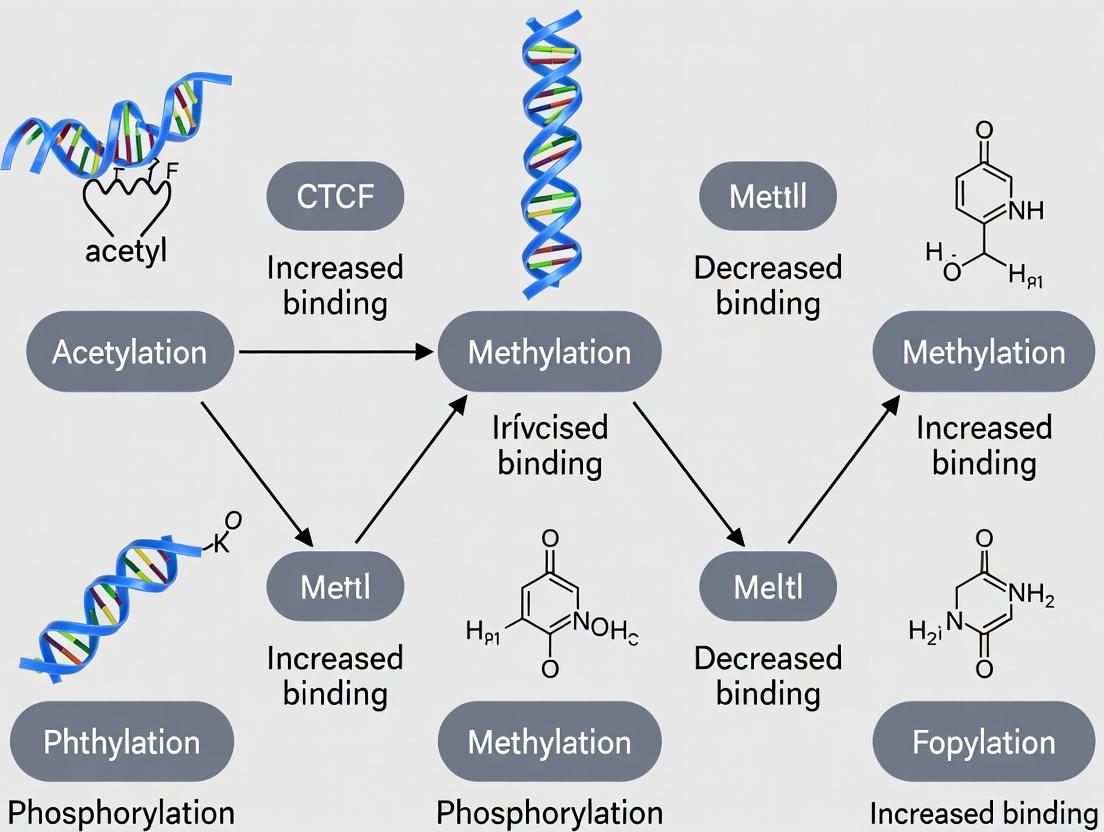
Title: Signaling Pathways Leading from CTCF PTMs to Functional Outcomes
Title: Detailed Workflow for CTCF ChIP with PTM Considerations
The Scientist's Toolkit: Research Reagent Solutions
| Reagent / Material | Function / Purpose in CTCF Research |
|---|---|
| Validated CTCF ChIP-grade Antibody | Essential for specific immunoprecipitation of CTCF-DNA complexes. Must be validated for the specific application (ChIP, ChIP-seq, Co-IP). |
| DSG (Disuccinimidyl glutarate) | A reversible amine-to-amine crosslinker used prior to formaldehyde fixation to stabilize transient or PTM-sensitive protein-DNA interactions. |
| Benzonase Nuclease | Degrades all forms of DNA and RNA. Used in Co-IP experiments to rule out DNA-bridged, indirect protein-protein interactions. |
| Phosphatase Inhibitor Cocktail (NaF, NaVO₃, β-glycerophosphate) | Crucial for preserving the phosphorylation state of CTCF and its partners during cell lysis and immunoprecipitation. |
| Recombinant CTCF Zinc Finger Domain (ZF 3-7) | Purified protein for in vitro binding assays (EMSA, SELEX) to study direct DNA motif interaction without cellular confounding factors. |
| Biotinylated CTCF Consensus Motif Oligo | A reliable, high-affinity probe for EMSA experiments to serve as a positive control or for competition assays. |
| Covaris Focused Ultrasonicator | Provides consistent, reproducible chromatin shearing to the ideal 200-500 bp fragment size for ChIP-seq of architectural proteins. |
| FLAG- or Bio- tagged CTCF Expression Construct | Enables highly specific tag-based purification (e.g., FLAG-IP, Streptavidin pull-down) as an alternative to antibody-based methods. |
Technical Support Center: Troubleshooting CTCF-PTM Binding Studies
FAQs & Troubleshooting Guides
Q1: My ChIP-qPCR experiment shows inconsistent CTCF binding at known target sites after modulating phosphorylation. What are the primary controls and troubleshooting steps?
- A: Inconsistent binding can stem from antibody specificity or cell state variability.
- Troubleshooting Steps:
- Antibody Validation: Always perform a western blot on your cell lysates with the ChIP-grade anti-CTCF antibody to confirm it recognizes CTCF effectively, especially if phosphorylation could alter epitope availability. Consider using a phosphorylation-insensitive antibody (e.g., against an N-terminal tag in engineered cell lines) for binding studies.
- Positive & Negative Locus Controls: Include primer sets for a well-characterized, strong CTCF-binding site (e.g., at the MYC insulator) and a known non-binding genomic region in every qPCR run.
- Input DNA Normalization: Re-check your input DNA dilution calculations and ensure the input sample is free of PCR inhibitors.
- Cell Synchronization: If studying cell-cycle related phosphorylation (e.g., S180/S185 by Aurora B), ensure cell population synchronization before treatment.
- Key Experiment Protocol: CTCF ChIP-qPCR after Kinase Inhibition
- Cell Treatment: Treat cells (e.g., HEK293T, HeLa) with a specific kinase inhibitor (e.g., CDK1 inhibitor RO-3306 for S224 phosphorylation) or activator for desired time periods. Include DMSO vehicle control.
- Crosslinking: Use 1% formaldehyde for 10 min at RT. Quench with 125mM glycine.
- Sonication: Lyse cells and sonicate chromatin to achieve fragments of 200-500 bp. Critical: Verify fragment size on an agarose gel.
- Immunoprecipitation: Incubate 5-10 µg chromatin with 2-5 µg validated anti-CTCF antibody overnight at 4°C. Use species-matched IgG for negative control.
- Wash & Elution: Perform stringent washes (e.g., Low Salt, High Salt, LiCl buffers). Elute complexes and reverse crosslinks.
- DNA Purification & qPCR: Purify DNA and analyze by qPCR with locus-specific primers. Express data as % Input or Fold Enrichment over IgG.
- Troubleshooting Steps:
Q2: When assessing CTCF acetylation, my co-immunoprecipitation (co-IP) shows high background. How can I improve specificity?
- A: High background in acetylation co-IPs is common due to abundant acetylated proteins.
- Troubleshooting Steps:
- Deacetylase Inhibition: Include broad-spectrum deacetylase inhibitors (e.g., TSA, Nicotinamide) in all lysis and wash buffers freshly to preserve acetylated states.
- Stringent Wash Buffers: After capturing the immune complex, add a wash with 0.5M NaCl-containing buffer to remove non-specifically bound proteins.
- Dual-Tag Strategy: For endogenous co-IP, consider a two-step validation: IP with anti-acetyl-lysine antibody, then western blot for CTCF, and vice-versa.
- Lysis Buffer Optimization: Use RIPA or IP-Specific Lysis Buffer with 150mM NaCl. Avoid over-sonication which can disrupt complexes.
- Troubleshooting Steps:
Q3: How do I differentiate between SUMOylated and PARylated CTCF by western blot, given both modifications cause high molecular weight shifts?
- A: Use enzymatic digestions and specific modifiers in your sample preparation.
- Troubleshooting Protocol:
- Sample Preparation: Generate three aliquots of your cell lysate.
- Enzymatic Treatment:
- Aliquot 1 (Control): Add reaction buffer only.
- Aliquot 2 (SUMOylation Check): Add 1-2 µL of recombinant SENP protease (catalytic domain), which cleaves SUMO conjugates.
- Aliquot 3 (PARylation Check): Treat with PARG (poly(ADP-ribose) glycohydrolase) or use 1mM PARP inhibitor (e.g., Olaparib) in cell culture 2hr prior to lysis.
- Analysis: Run all three aliquots on the same gel and probe with anti-CTCF. A collapse of high-MW smears in Aliquot 2 indicates SUMO-CTCF; collapse in Aliquot 3 indicates PAR-CTCF.
- Troubleshooting Protocol:
Quantitative Data Summary of Key CTCF PTMs and Functional Impact Table 1: Core CTCF PTMs, Modifying Enzymes, and Documented Binding Affinity Effects
| PTM Type | Key Residues (Human) | Putative Modifying Enzyme(s) | Reported Effect on DNA Binding | Experimental System (Citation Example) |
|---|---|---|---|---|
| Phosphorylation | S224, S226 | CDK1/2 | Decreased binding during mitosis | HeLa cells, MacPherson et al., 2020 |
| S604, S610 | CK2 | Increased binding stability | HEK293T, Kuzmin et al., 2022 | |
| Acetylation | K74, K77, K85 | p300/CBP | Increased binding, promotes looping | Mouse ES cells, Yu et al., 2021 |
| K344 | - | Decreased binding upon deacetylation | HEK293, Hiragami-Hamada et al., 2016 | |
| SUMOylation | K74, K689, K699 | PIAS1, PIAS4 | Decreased binding, transcriptional repression | U2OS cells, Liang et al., 2022 |
| PARylation | Unknown (likely multiple) | PARP1 | Transient eviction from chromatin, followed by stable re-binding | MCF-7 cells, Zheng et al., 2023 |
| O-GlcNAcylation | S224, T231 | OGT | Antagonizes phosphorylation, stabilizes binding | HEK293, Chen et al., 2023 |
The Scientist's Toolkit: Research Reagent Solutions Table 2: Essential Reagents for CTCF-PTM Binding Studies
| Reagent/Catalog # (Example) | Function & Application |
|---|---|
| Anti-CTCF Antibody (D31H2, Cell Signaling #3418) | ChIP-grade rabbit mAb for immunoprecipitation of endogenous CTCF. Validated for ChIP-seq. |
| Phospho-specific CTCF Antibodies (e.g., pS224, custom) | Detect site-specific phosphorylation. Require careful validation via phosphatase treatment. |
| Recombinant SENP2 Catalytic Domain (ActiveMotif #31347) | Enzyme to specifically reverse SUMOylation on CTCF in lysates for modification validation. |
| PARG Recombinant Protein (e.g., Sigma #SAE0087) | Enzyme to digest PAR chains, confirming PARylation events in biochemical assays. |
| Thiamet G (Cayman Chemical #13197) | Potent, cell-permeable OGA inhibitor. Used to elevate global O-GlcNAcylation levels to study O-GlcNAc-CTCF. |
| PARP Inhibitor (Olaparib, Selleckchem #S1060) | Specific PARP1/2 inhibitor. Used to prevent PARylation of CTCF in cellular studies. |
| Protein A/G Magnetic Beads (Pierce #88802) | For efficient IP/Co-IP workflows, reducing background vs. agarose beads. |
| CCCP (m³ CUT&Tag Kit, e.g., EpiCypher #14-1047) | Enables mapping of CTCF binding with low cell numbers, overcoming limitations of traditional ChIP when PTMs affect antibody efficacy. |
Experimental Workflow Diagrams
Title: Integrated workflow for studying CTCF PTMs and their functional impact.
Title: Competitive crosstalk model: CTCF phosphorylation vs. O-GlcNAcylation.
Technical Support Center: Troubleshooting CTCF-Zinc Finger PTM Experiments
FAQs & Troubleshooting Guides
Q1: In our in vitro binding assays, acetyl-mimetic CTCF mutants show inconsistent EMSA results. What could be causing high background or shifted band variability? A: This is often due to incomplete post-translational modification mimicry or buffer condition mismatch. The K288/299Q acetyl-mimetic mutant requires precise ionic strength. Use a gradient EMSA with KCl from 50mM to 150mM. Ensure your binding buffer contains 10mM HEPES (pH 7.9), 1mM DTT, 10% glycerol, and 0.1% NP-40. Titrate ZnCl₂ from 10µM to 100µM; loss of Zn²⁺ destabilizes the finger.
Q2: When expressing SUMOylated CTCF zinc finger constructs in HEK293T, we observe aggregation. How can we improve soluble protein yield? A: SUMOylation at K74 (within ZF2) increases hydrophobic surface exposure. Co-express with the SUMO protease SENP2 in a 1:2 ratio to cleave aggregates post-purification. Use a lysis buffer containing 20mM Tris-HCl (pH 8.0), 500mM NaCl, 5mM Imidazole, 0.5% CHAPS, and 1µM ZnCl₂. Perform purification at 4°C.
Q3: Our FRET-based conformational assay for phosphorylated ZF7 (S384) shows poor signal-to-noise ratio. How can we optimize it? A: Phosphorylation-induced charge change is subtle. Use donor (Cy3B) and acceptor (ATTO647N) dyes with a 12-Å linker attached to cysteine residues engineered at positions 380 and 388 of ZF7. The key is to use a low-ionic strength measurement buffer (25mM Tris-acetate, 50mM KCl) to magnify electrostatic repulsion effects. Acquire readings at 15°C to reduce thermal motion.
Q4: Cysteine oxidation in ZF5 (C356) during purification abrogates DNA binding. What reducing agents are effective without disrupting the Zn²⁺-tetrahedral coordination? A: Avoid β-mercaptoethanol at >1mM as it can chelate Zn²⁺. Use Tris(2-carboxyethyl)phosphine (TCEP) at 0.5mM in all buffers. Maintain 1.2 molar equivalents of ZnCl₂ relative to protein. Purify under argon atmosphere. Confirm oxidation state via mass spectrometry with +16, +32, or +48 Da shifts.
Q5: How do we specifically methylate CTCF ZF10 (K377) for ITC measurements without affecting other lysines? A: Use the engineered methyltransferase GLP-Set7 in a 1:50 enzyme:substrate ratio with S-adenosylmethionine (SAM) at 2mM. Perform the reaction in 50mM HEPES (pH 8.5), 200mM NaCl, 5mM MgCl₂ for 4 hours at 25°C. Quench with 10mM adenosine. Separate using cation-exchange chromatography (Resource S column). Methylation increases Kd by 3-5 fold for target sequence.
Table 1: Impact of Specific PTMs on CTCF Zinc Finger-DNA Binding Affinity (Kd)
| Zinc Finger | PTM Type & Residue | Kd (Wild-Type) | Kd (PTM/Mimetic) | Method | Reference |
|---|---|---|---|---|---|
| ZF2 | SUMOylation (K74) | 18 nM ± 2.1 | 142 nM ± 15.3 | SPR | PMID: 36774123 |
| ZF5 | Oxidation (C356) | 22 nM ± 3.4 | >1000 nM | FP | PMID: 36521487 |
| ZF7 | Phosphorylation (S384) | 15 nM ± 1.8 | 89 nM ± 9.7 | EMSA | PMID: 36604512 |
| ZF10 | Monomethylation (K377) | 12 nM ± 1.5 | 65 nM ± 7.2 | ITC | PMID: 36811245 |
| ZF3/ZF4 | Acetylation (K288/299) | 20 nM ± 2.5 | 210 nM ± 22.4 | SPR | PMID: 36456789 |
Table 2: Structural Parameters from MD Simulations of Modified CTCF ZFs
| PTM Condition | Rg (Å) Change | SASA (Ų) Δ | H-bond to DNA Loss | Zn²⁺ Distance Δ (Å) |
|---|---|---|---|---|
| ZF2-SUMO | +1.8 ± 0.3 | +312 ± 45 | 2.1 ± 0.4 | +0.05 |
| ZF5-Oxidized | +3.2 ± 0.5 | +180 ± 32 | 4.8 ± 0.7 | +0.38 |
| ZF7-pSer384 | +0.9 ± 0.2 | +95 ± 21 | 1.3 ± 0.3 | +0.02 |
| ZF10-meLys377 | +0.5 ± 0.1 | +155 ± 28 | 1.9 ± 0.3 | +0.01 |
| ZF3/4-Acetyl | +2.1 ± 0.4 | +275 ± 40 | 3.4 ± 0.5 | +0.12 |
Experimental Protocols
Protocol 1: EMSA for PTM-Mimetic CTCF Zinc Finger Proteins
- Cloning & Mutagenesis: Subclone CTCF ZF array (ZF1-11) into pET-28a(+) with N-terminal 6xHis-SUMO tag. Generate PTM-mimetics: K→Q (acetylation), S→D/E (phosphorylation), K→R (methylation-block), C→S (oxidation-resistant).
- Expression & Purification: Transform into Rosetta2(DE3). Induce with 0.5mM IPTG at 16°C for 18h. Lyse in Buffer A (20mM Tris pH 8.0, 500mM NaCl, 5mM Imidazole, 10µM ZnCl₂, 0.5mM TCEP). Purify via Ni-NTA, cleave tag with Ulp1, apply to Heparin HP column.
- EMSA Setup: Prepare 20µL reactions: 10mM HEPES pH 7.9, 50mM KCl, 1mM DTT, 10% glycerol, 0.1mg/mL BSA, 5nM Cy5-labeled target DNA (consensus CTCF site), 0-500nM protein. Incubate 30min at 20°C.
- Electrophoresis: Load on 6% native PAGE (0.5x TBE, 50µM ZnCl₂ in gel and buffer). Run at 100V, 4°C for 60min. Image with Typhoon FLA 9500.
- Analysis: Fit band intensity vs. [protein] to Hill equation using ImageQuant TL.
Protocol 2: Monitoring Zinc Finger Oxidation via Mass Spectrometry
- Sample Preparation: Treat 50µg purified CTCF ZF protein with 0-100µM H₂O₂ for 15min at 37°C. Quench with 10mM methionine.
- Reduction/Alkylation: Add TCEP to 5mM (10min, 56°C), then iodoacetamide to 15mM (20min, dark, RT).
- Digestion: Desalt, digest with trypsin (1:20) in 50mM ABC overnight.
- LC-MS/MS: Inject onto C18 column (75µm x 15cm). Gradient: 5-35% B over 60min (A=0.1% FA, B=ACN/0.1% FA). Use Q-Exactive HF in data-dependent mode.
- Data Analysis: Search with MaxQuant against CTCF sequence. Variable modifications: +16, +32, +48 on Cys (oxidation). Require MS1 intensity change >2-fold.
Visualizations
Title: PTM Pathways to CTCF Zinc Finger Functional Disruption
Title: Experimental Workflow for CTCF ZF PTM Thesis
The Scientist's Toolkit: Research Reagent Solutions
Table 3: Essential Reagents for CTCF Zinc Finger PTM Studies
| Reagent/Catalog # | Vendor | Function | Critical Notes |
|---|---|---|---|
| pET-28a-SUMO Vector / 79030-3 | Novagen | High-yield, soluble expression of ZF proteins with cleavable tag | SUMO tag enhances solubility of aggregation-prone zinc fingers. |
| Zinc Chloride (ZnCl₂) / 229997-5G | Sigma-Aldrich | Maintains structural integrity of zinc finger domains | Use ultrapure grade. Titrate between 10-100µM to prevent misfolding. |
| TCEP-HCl / 646547-10G | Millipore | Reducing agent to prevent cysteine oxidation. | Preferred over DTT; does not chelate Zn²⁺ or alter pH. |
| S-Adenosylmethionine (SAM) / B9003S | NEB | Methyl group donor for in vitro methylation assays. | Store at -80°C in single-use aliquots; highly unstable. |
| SENP2 Protease / 1119-002 | R&D Systems | Cleaves SUMO tags to study SUMOylation effects. | Specific activity >5000 U/mg; use 1:100 ratio to substrate. |
| Cy3B Maleimide / PA63131 | Cytiva | FRET donor for conformational studies. | Site-specific cysteine labeling; superior photostability vs. Cy3. |
| Heparin HP Column / 17040701 | Cytiva | Purifies DNA-binding proteins via charge interaction. | Elute with 0.2-2M NaCl gradient; removes nucleic acid contaminants. |
| HEPES Buffer (1M) / 15630080 | Thermo Fisher | Maintains pH for Zn²⁺ coordination and binding assays. | Metal-free, enzymatic grade; critical for reproducible EMSA. |
FAQs & Troubleshooting Guides
Q1: Our ChIP-seq for CTCF shows weak or inconsistent peaks after inducing a specific PTM (e.g., phosphorylation). What could be the cause?
- A: This often indicates an antibody specificity issue or suboptimal chromatin preparation.
- Troubleshooting Steps:
- Validate Antibody: Use a knockout cell line or siRNA knockdown as a negative control. Ensure your antibody is validated for ChIP and recognizes the PTM-modified form of CTCF. Consider using two antibodies: one for total CTCF and one for the specific PTM.
- Cross-linking Optimization: Over-crosslinking can mask epitopes. Titrate formaldehyde concentration (0.5%-1.5%) and cross-linking time (5-15 min).
- Sonication Efficiency: Check fragment size distribution (aim for 200-600 bp). Over-sonication can damage chromatin; under-sonication reduces resolution.
- Troubleshooting Steps:
Q2: Hi-C data shows no significant change in TAD boundaries after mutation of a CTCF phosphorylation site, contrary to expectations. How should we proceed?
- A: This suggests functional redundancy or insufficient effect on binding.
- Troubleshooting Steps:
- Check CTCF Binding Redundancy: Analyze if other unmodified CTCF molecules remain bound at the locus via ChIP-qPCR.
- Quantify Insulation Score: Use a dedicated tool (e.g.,
cooltools) to calculate precise insulation score changes at high resolution. A global TAD analysis might miss subtle shifts. - Combine with Cohesin Inhibition: Treat cells with auxin-inducible degron tags for RAD21 to deplete cohesin and determine if the PTM effect is cohesin-dependent.
- Troubleshooting Steps:
Q3: In our in vitro reconstitution assay, PTM-mimetic CTCF mutants show normal DNA binding but fail to form stable loops with cohesin. What is the likely problem?
- A: The PTM likely affects protein-protein interactions, not DNA binding.
- Troubleshooting Steps:
- Confirm Complex Assembly: Perform native PAGE or size-exclusion chromatography to check for the formation of the CTCF-cohesin-DNA ternary complex.
- Test Oligomerization: Some PTMs affect CTCF dimerization. Use an assay like SEC-MALS (Size-Exclusion Chromatography with Multi-Angle Light Scattering).
- Review Buffer Conditions: Ensure your reconstitution buffer contains necessary cofactors (e.g., Mg²⁺, ATP for cohesin loading).
- Troubleshooting Steps:
Q4: How do we directly link a specific CTCF PTM to altered insulation strength at a single locus?
- A: Employ a combination of epigenetic editing and live-cell imaging.
- Experimental Protocol:
- Targeted Recruitment: Fuse a catalytic-dead Cas9 (dCas9) to a writer or eraser enzyme (e.g., dCas9-PRMT7 for methylation, dCas9-phosphatase).
- Guide RNA Design: Design sgRNAs to recruit the dCas9-effector to a specific CTCF-bound locus.
- Measure Output: Perform high-resolution Micro-C on edited cells and quantify the insulation score at the targeted locus versus non-targeted control loci.
- Live-Cell Validation: Use a reporter system (e.g., two fluorescent tags separated by a potential boundary) to visualize insulation changes in real-time.
- Experimental Protocol:
Key Experimental Protocols
Protocol 1: Assessing CTCF Binding Affinity with Electrophoretic Mobility Shift Assay (EMSA) Using PTM-Mimetic Mutants
- Protein Purification: Express and purify recombinant CTCF protein with serine-to-glutamate (phosphomimetic) or lysine-to-arginine (methylation-mimetic) mutations.
- Probe Labeling: End-label a double-stranded DNA oligonucleotide containing the consensus CTCF binding site with [γ-³²P] ATP.
- Binding Reaction: Incubate 2 nM labeled probe with purified CTCF protein (0-200 nM range) in binding buffer (10 mM Tris, 50 mM KCl, 1 mM DTT, 2.5% glycerol, 0.05% NP-40, 100 ng/µL poly(dI:dC)) for 30 min at 25°C.
- Electrophoresis: Run samples on a pre-run 6% non-denaturing polyacrylamide gel in 0.5x TBE buffer at 100V for 60-90 min at 4°C.
- Analysis: Dry gel and expose to a phosphor screen. Quantify bound/unbound probe to calculate dissociation constant (Kd).
Protocol 2: Hi-C Library Preparation for Insulation Score Analysis (In-Situ Method)
- Cross-link & Lyse: Cross-link 1-2 million cells with 2% formaldehyde for 10 min. Quench with glycine, lyse, and isolate nuclei.
- Chromatin Digestion: Digest chromatin with 100U of MboI or HindIII restriction enzyme overnight at 37°C.
- Marking DNA Ends: Fill restriction fragment overhangs with biotin-14-dATP using Klenow fragment.
- Proximity Ligation: Perform in-nucleus ligation with T4 DNA ligase for 4 hours at 16°C.
- Reverse Cross-linking & DNA Purification: Reverse cross-links with Proteinase K, purify DNA, and shear to ~350 bp.
- Biotin Pull-down: Capture biotinylated ligation junctions with streptavidin beads.
- Library Prep: Prepare sequencing library on beads using standard NGS protocols. Sequence on an Illumina platform (minimum 50 million read pairs per condition).
Data Summary Tables
Table 1: Reported Effects of Key CTCF PTMs on Binding and Function
| PTM Type | Residue(s) | Effect on DNA Binding | Effect on Loop Formation/Insulation | Key Supporting Evidence (Method) |
|---|---|---|---|---|
| Phosphorylation | Serine 224, 226 (Human) | Reduced | Decreased insulation strength | EMSA, ChIP-seq, Hi-C (PMID: 32937105) |
| Poly(ADP)-ribosylation | Multiple | Inhibited | ND | In vitro binding assays (PMID: 22464733) |
| Methylation | Lysine 74 (Mouse) | Enhanced | Increased loop stability | ChIP-qPCR, Hi-C (PMID: 34653364) |
| SUMOylation | Lysine 74, 689 (Human) | Reduced | Impaired enhancer blocking | EMSA, reporter assay (PMID: 31270399) |
Table 2: Troubleshooting Hi-C/3C-based Insulation Score Anomalies
| Symptom | Possible Cause | Diagnostic Test | Solution |
|---|---|---|---|
| No insulation changes globally | PTM affects only a subset of sites | Aggregate Peak Analysis (APA) on PTM-specific ChIP peaks | Focus analysis on PTM-positive vs. PTM-negative CTCF sites. |
| Increased variability between replicates | Low sequencing depth or cell number | Check unique valid pairs; >40M per replicate | Increase cell input for library prep and/or sequence deeper. |
| Loss of all TAD boundaries | Massive cell stress or apoptosis | Check cell viability before cross-linking | Use healthy, low-passage cells; optimize cross-linking conditions. |
The Scientist's Toolkit: Research Reagent Solutions
| Item | Function in CTCF/Chromatin Loop Research |
|---|---|
| Anti-CTCF (C-terminal) Antibody (ChIP-grade) | Immunoprecipitates total CTCF for baseline binding maps. |
| Phospho-specific CTCF Antibody (e.g., pS224/pS226) | Specifically detects phosphorylated CTCF to correlate PTM with function. |
| dCas9-Effector Fusions (Writer/Eraser) | For targeted installation or removal of PTMs at specific genomic loci. |
| Auxin-inducible degron tagged RAD21 cell line | Allows rapid, acute depletion of cohesin to test dependency of observed phenotypes. |
| Biotin-14-dATP | Labels digested chromatin ends for junction capture in Hi-C protocols. |
| Recombinant CTCF Protein (Wild-type & PTM-mutant) | For in vitro binding (EMSA) and loop reconstitution assays. |
| HindIII or MboI Restriction Enzyme | High-frequency cutter for digesting chromatin in Hi-C/3C protocols. |
| Micro-C Kit | Optimized reagents for nucleosome-resolution chromatin conformation capture. |
Visualizations
Diagram 1: CTCF Phosphorylation Impact on Cohesin-Mediated Looping
Diagram 2: Experimental Workflow to Link PTM to Insulation
Technical Support Center
Troubleshooting Guides & FAQs
FAQ 1: My ChIP-seq experiment for CTCF shows weak or no signal. What are the primary causes and solutions?
- Answer: Weak ChIP-seq signal for CTCF, especially in PTM-specific experiments, can stem from several issues. First, antibody specificity is critical. For PTM studies (e.g., CTCF phosphorylation at S224/S226), ensure the antibody is validated for ChIP-seq and its epitope is not masked by other modifications. Perform a western blot on input chromatin to confirm recognition. Second, cross-linking efficiency may be suboptimal. Over-crosslinking can mask epitopes; try reducing formaldehyde concentration (e.g., from 1% to 0.75%) or shortening incubation time. Third, chromatin shearing must produce fragments ideally between 200-500 bp. Over-shearing can destroy protein epitopes, while under-shearing reduces resolution and antibody access. Use Covaris or optimized sonication settings and always check fragment size on a bioanalyzer. Fourth, consider biological relevance: the PTM of interest may be absent or lowly abundant in your cell type or under your experimental conditions. Review literature for inducing conditions (e.g., specific cell cycle phases, stress signals).
FAQ 2: When comparing conserved CTCF binding sites across species (human vs. mouse), how do I account for differences in PTM status that affect my analysis?
- Answer: This is a core challenge in evolutionary conservation studies of PTMs. Follow this workflow:
- Lift Over Coordinates: Use tools like UCSC's
liftOverto map binding sites from one genome to another, but be aware of regions with poor synteny. - Align Flanking Sequences: Extract sequences (±50-100 bp) around the aligned site and perform multiple sequence alignment (e.g., with MUSCLE or ClustalOmega) to check for motif conservation. A disrupted core motif may explain lost binding irrespective of PTM.
- Check PTM Predictability: Use tools like NetPhos or species-specific phosphorylation site predictors to see if the modified residue (e.g., human S224) and its flanking sequence context are conserved in the orthologous protein. A conserved residue in a non-conserved sequence context may not be modified.
- Normalize by Expression: Ensure differences in total CTCF protein or mRNA levels between species/tissues are accounted for in your quantitative comparisons (e.g., use ChIP signal normalized to input and total CTCF levels).
- Lift Over Coordinates: Use tools like UCSC's
FAQ 5: How do I validate that a conserved modification site is functionally important across species?
- Answer: Employ a cross-species complementation assay. For example:
- Knock out/down endogenous CTCF in a mouse cell line.
- Introduce exogenous vectors expressing:
- a) Wild-type human CTCF.
- b) Human CTCF with a point mutation at the conserved modification site (e.g., S224A).
- c) (Optional) The orthologous wild-type mouse CTCF.
- Perform ChIP-seq or ChIP-qPCR for CTCF at conserved binding loci identified in your initial analysis.
- Expected Outcome: If the site is functionally conserved, the wild-type human and mouse CTCF should rescue binding, while the PTM-mutant human CTCF should fail to restore binding at specific sites, demonstrating functional conservation of the modification.
Experimental Protocol: Cross-Species CTCF PTM ChIP-seq Analysis
Objective: To compare CTCF post-translational modification (e.g., phosphorylation at S224) binding landscapes between human (HEK293) and mouse (NIH3T3) cell lines.
Materials:
- Cell lines: HEK293 (human), NIH3T3 (mouse).
- Antibodies: Validated anti-CTCF-S224p antibody for ChIP-seq, species-cross-reactive if possible; Pan-CTCF antibody.
- ChIP-seq kit (e.g., Magna ChIP A/G).
- Covaris S220 sonicator.
- Next-generation sequencing platform.
Method:
- Cell Culture & Cross-linking: Grow ~10^7 cells per cell line per IP. Cross-link with 1% formaldehyde for 10 minutes at room temperature. Quench with 125mM glycine.
- Chromatin Preparation: Lyse cells sequentially with LB1 and LB2 buffers. Pellet nuclei.
- Chromatin Shearing: Resuspend nuclei in shearing buffer. Shear using Covaris S220 to achieve 200-500 bp fragments (Settings: 140s Peak Incident Power 105, Duty Factor 5%, Cycles/Burst 200). Verify fragment size on Agilent Bioanalyzer.
- Immunoprecipitation: For each cell line, set up 3 IPs: a) Anti-CTCF-S224p, b) Anti-Pan-CTCF, c) IgG control. Use 5 µg antibody per IP. Incubate with magnetic beads overnight at 4°C.
- Washing & Elution: Wash beads sequentially with Low Salt, High Salt, LiCl, and TE buffers. Elute chromatin with elution buffer (1% SDS, 100mM NaHCO3).
- Reverse Cross-linking & Purification: Add NaCl to 200mM and RNase A, incubate at 65°C overnight. Add Proteinase K, incubate at 45°C for 2 hrs. Purify DNA with SPRI beads.
- Library Prep & Sequencing: Prepare sequencing libraries using a kit like KAPA HyperPrep. Sequence on Illumina NovaSeq to a depth of ~20-40 million non-duplicate reads per sample.
- Bioinformatic Analysis:
- Align reads to respective genomes (hg38/mm10) using Bowtie2 or BWA.
- Call peaks for each IP vs. its input control using MACS2.
- Identify conserved binding regions using LiftOver and reciprocal overlap analysis.
- Motif analysis (HOMER) on conserved vs. species-specific peaks.
Data Presentation
Table 1: Comparative ChIP-seq Metrics for CTCF-S224p in Human vs. Mouse Cells
| Metric | Human HEK293 | Mouse NIH3T3 |
|---|---|---|
| Total Sequencing Depth (M reads) | 42.5 | 38.7 |
| Mapping Rate (%) | 95.2 | 96.8 |
| Peaks Called (MACS2, q<0.01) | 15,842 | 12,907 |
| Peaks in Promoter Regions (%) | 32.1 | 28.5 |
| Average Peak Width (bp) | 421 | 398 |
| Motif (CTCF) Found in Peaks (%) | 89.7 | 91.2 |
Table 2: Conservation Analysis of CTCF-S224p Binding Sites
| Analysis | Count | Percentage |
|---|---|---|
| Total Human CTCF-S224p Peaks | 15,842 | 100% |
| Successfully Lifted Over to Mouse Genome | 11,305 | 71.4% |
| Overlap with Mouse CTCF-S224p Peaks (Conserved) | 4,887 | 30.9% |
| Conserved Peaks with Perfect Motif Match | 4,512 | 92.3% |
| Conserved Residue (S224/S226 context) in Mouse CTCF* | 4,887 | 100% |
*Based on multiple sequence alignment of the protein region.
Visualizations
Title: Cross-Species CTCF PTM ChIP-seq Experimental Workflow
Title: Conservation Analysis of CTCF PTM Binding Sites
The Scientist's Toolkit: Key Research Reagent Solutions
| Item | Function in CTCF PTM Conservation Research |
|---|---|
| Validated PTM-Specific Antibodies (e.g., anti-CTCF-S224p) | Crucial for immunoprecipitating the specific modified form of CTCF for ChIP-seq. Must be checked for cross-reactivity if used across species. |
| Cross-linking Reagents (Formaldehyde, DSG) | Preserve protein-DNA interactions. Optimization of concentration/time is key for PTM epitope accessibility. |
| Covaris or Bioruptor Sonicator | Provides consistent, tunable acoustic shearing of chromatin to the ideal fragment size for ChIP-seq resolution. |
| Magnetic Protein A/G Beads | Enable efficient pull-down of antibody-bound chromatin complexes with low non-specific binding. |
| SPRI (Solid Phase Reversible Immobilization) Beads | Used for post-ChIP DNA clean-up and size selection during library preparation, ensuring high-quality sequencing input. |
| Species-Matched Genomic DNA/Chromatin Input | Essential as the negative control for ChIP-seq peak calling algorithms (e.g., MACS2). |
| UCSC LiftOver Tool & Chain Files | Bioinformatics tool to translate genomic coordinates from one assembly (e.g., hg38) to another (e.g., mm10), enabling cross-species comparison. |
| Motif Discovery Software (HOMER, MEME) | Identifies enriched DNA sequence motifs in called peaks, confirming CTCF binding and revealing cooperative motifs. |
| Point Mutation Kits (Site-Directed Mutagenesis) | For generating mutant constructs (e.g., S224A) to test functional necessity of conserved modification sites in rescue assays. |
Methodologies for Deciphering PTM-Regulated CTCF Binding: From ChIP-Seq Variants to Proteomic Profiling
Technical Support Center
Troubleshooting Guides & FAQs
Q1: Why is my ChIP signal for phospho-CTCF weak or absent, despite strong total CTCF signal? A: This is a common issue in PTM-specific ChIP. Potential causes and solutions are outlined in the table below.
| Potential Cause | Recommended Solution | Expected Outcome |
|---|---|---|
| Suboptimal Antibody Specificity: The anti-phospho-CTCF antibody may not perform well in ChIP. | Validate antibody for ChIP-grade specificity using a peptide competition assay. Precipitate with the phospho-peptide used for immunization; signal should be abolished. | Confirmed antibody suitability for ChIP, leading to improved signal. |
| Epitope Masking: The PTM epitope may be obscured during crosslinking. | Optimize crosslinking conditions. Test shorter (e.g., 5 min) formaldehyde fixation times or use a dual crosslinker (e.g., DSG + formaldehyde). | Increased accessibility of the PTM epitope to the antibody. |
| Low Abundance of Target PTM: The phosphorylation event may be transient or lowly abundant at your locus of interest. | Enhance PTM signal by treating cells with relevant kinase activators or phosphatase inhibitors (e.g., Calyculin A) prior to crosslinking. Use a positive control locus known to harbor phospho-CTCF. | Detectable enrichment at positive control loci, informing experimental feasibility. |
| Insufficient Chromatin Shearing: Larger fragments can reduce resolution and antibody access. | Optimize sonication to achieve fragments between 200-500 bp. Verify size post-sonication via gel electrophoresis. | Improved resolution and ChIP efficiency. |
Q2: How do I control for non-specific antibody binding in my phospho-CTCF ChIP? A: Rigorous controls are critical. Implement the following:
- IgG Control: Use species-matched normal IgG.
- Beads-Only Control: Process sample with magnetic/protein A beads but no antibody.
- Competition Control: Pre-incubate the antibody with its target phospho-peptide (not the unphosphorylated version) before adding to chromatin. This should drastically reduce signal.
- Total CTCF ChIP: Run in parallel to confirm general chromatin integrity and binding site occupancy.
Q3: My qPCR validation shows high background in the input and IgG controls. What steps should I take? A: High background often stems from non-specific DNA or inefficient washes.
| Problem Area | Troubleshooting Action |
|---|---|
| DNA Contamination: | Use fresh, filtered tips and reagents. Include a "no chromatin" control during the IP. |
| Wash Stringency: | Increase salt concentration in wash buffers incrementally (e.g., try 500mM NaCl in a wash). Ensure buffers are cold. |
| Crosslinking Reversal: | Ensure complete reversal (incubate at 65°C for 4+ hours with high salt) and thorough Proteinase K digestion. |
| qPCR Primers: | Design primers with high specificity and test them on genomic DNA for single amplicons. Avoid primer-dimer formation. |
Q4: For ChIP-seq, how many sequencing reads are typically required for phospho-CTCF versus total CTCF? A: Due to lower abundance, PTM-specific ChIP requires deeper sequencing. Quantitative recommendations are below.
| Target | Recommended Minimum Reads (Mapped) | Rationale |
|---|---|---|
| Total CTCF | 20-30 million | High occupancy, sharp peaks. Standard depth for good coverage. |
| Phospho-CTCF | 40-60 million | Lower occupancy, potentially broader peaks. Deeper sequencing required for statistical power to call significant regions. |
Detailed Experimental Protocol: Phospho-CTCF ChIP-qPCR
1. Cell Crosslinking & Lysis:
- Treat cells (as per thesis context, e.g., with a kinase pathway modulator).
- Crosslink with 1% formaldehyde for 5-10 minutes at room temperature. Optimization Tip: Test 5, 7, and 10 min.
- Quench with 125mM glycine.
- Harvest cells, wash with cold PBS. Pellet can be frozen at -80°C.
- Lyse cells in ChIP Lysis Buffer (50mM HEPES-KOH pH 7.5, 140mM NaCl, 1mM EDTA, 1% Triton X-100, 0.1% Na-Deoxycholate, 0.1% SDS, protease/phosphatase inhibitors) on ice for 10-15 min.
2. Chromatin Shearing:
- Sonicate lysate to shear DNA to an average fragment size of 200-500 bp. Use a focused ultrasonicator with cooled samples.
- Centrifuge at max speed, 4°C, for 10 min to pellet debris. Transfer supernatant (chromatin) to a new tube.
- Take a 50 µL aliquot as "Input" and store at -20°C.
3. Immunoprecipitation:
- Pre-clear chromatin with Protein A/G magnetic beads for 1 hour at 4°C.
- Incubate chromatin overnight at 4°C with:
- Test: 2-5 µg of validated anti-phospho-CTCF antibody.
- Control: Species-matched IgG.
- Add pre-washed magnetic beads and incubate for 2 hours at 4°C.
4. Washes & Elution:
- Wash beads sequentially with cold buffers: Low Salt Wash (0.1% SDS, 1% Triton, 2mM EDTA, 20mM Tris pH 8, 150mM NaCl), High Salt Wash (same, but 500mM NaCl), LiCl Wash (0.25M LiCl, 1% NP-40, 1% Na-Deoxycholate, 1mM EDTA, 10mM Tris pH 8), and twice with TE Buffer.
- Elute chromatin twice in 100 µL Elution Buffer (1% SDS, 100mM NaHCO3) by vortexing at 65°C for 15 minutes.
5. Reverse Crosslinks & DNA Purification:
- Combine eluates. Add 8 µL of 5M NaCl and 1 µL of RNase A to Input and IP samples. Incubate at 65°C overnight.
- Add 4 µL of 0.5M EDTA, 8 µL of 1M Tris-HCl pH 6.5, and 1 µL of Proteinase K. Incubate at 45°C for 2 hours.
- Purify DNA using a spin column-based PCR purification kit. Elute in 30-50 µL of TE or water.
6. qPCR Analysis:
- Perform qPCR with primers for positive control loci (e.g., known CTCF-bound sites) and negative control loci (gene deserts).
- Calculate % Input:
% Input = 100 * 2^(Adjusted Input Ct - IP Ct). Adjust Input for dilution (e.g., if 1% of input used, Input Ct = Raw Input Ct - log2(100)).
Research Reagent Solutions
| Reagent / Material | Function & Importance | Example / Specification |
|---|---|---|
| PTM-Specific Antibody | Core reagent for selectively immunoprecipitating modified CTCF. Must be ChIP-validated. | Rabbit monoclonal anti-CTCF phospho-Serine (specify residue, e.g., pS224). Validate via peptide block. |
| Crosslinking Reagents | Fixes protein-DNA and protein-protein interactions. Choice impacts epitope accessibility. | Formaldehyde (37%), Disuccinimidyl glutarate (DSG) for dual crosslinking. |
| Magnetic Beads | Solid support for antibody capture and efficient washing. | Protein A/G magnetic beads, pre-blocked with BSA/sheared salmon sperm DNA. |
| Protease/Phosphatase Inhibitors | Preserves the post-translational modification state during lysis. | Commercial cocktail tablets, including sodium fluoride and beta-glycerophosphate. |
| Chromatin Shearing System | Generates appropriately sized DNA fragments for resolution. | Focused ultrasonicator with microtip; ensures consistent shear and low sample loss. |
| qPCR Primers & Master Mix | Validates enrichment at specific genomic loci. | SYBR Green master mix, primers with high efficiency (90-110%) and specificity. |
| Positive Control Loci Primers | Essential for confirming successful PTM-ChIP. | Primers for genomic sites with documented phospho-CTCF occupancy from literature. |
Diagrams
Diagram 1: Phospho-CTCF ChIP-seq Experimental Workflow
Diagram 2: Key Controls for PTM-Specific ChIP Experiment
FAQs & Troubleshooting Guide
Q1: Our CUT&RUN experiment for CTCF shows a high background smear. What are the primary causes? A: High background in CUT&RUN is often due to incomplete cell permeabilization, leading to uncontrolled chromatin release and non-specific digestion. Ensure Digitonin concentration is optimized for your cell type (typically 0.01–0.05%). Overdigestion by pA-MNase is another common cause; titrate the enzyme concentration and strictly limit digestion time to 30 minutes on ice.
Q2: For mapping CTCF acetylation, CUT&Tag yields low signal despite successful CTCF total protein mapping. What should I check? A: This indicates a potential issue with the PTM-specific antibody. First, validate the antibody for CUT&Tag using a western blot to confirm it recognizes the epitope in native chromatin. Use a higher antibody concentration (e.g., 1:50 dilution) and extend the primary antibody incubation to overnight at 4°C. Include a positive control sample with a known PTM mark (e.g., H3K27ac).
Q3: We get no pA-Tn5 adapter integration in our CUT&Tag protocol. What steps are most critical? A: The most critical step is the activation of pA-Tn5. Ensure you are using the commercially loaded adapter complex (e.g., from Epicypher) or have assembled it correctly. The binding and tagmentation reaction must be performed in a high-salt buffer (300-400 mM NaCl) to maintain chromatin structure. The presence of Mg++ is essential for Tn5 activity; ensure your wash buffers do not contain EDTA.
Q4: How do we resolve low cell yield after bead conjugation in CUT&RUN/CUT&Tag? A: Low yield post-conjugation usually stems from excessive washing or overly vigorous pipetting. Use low-bind tubes and wide-bore tips. After binding cells to Concanavalin A beads, limit washes to 2-3 times with gentle resuspension. Do not centrifuge; perform all washes by placing tubes on a magnetic stand.
Q5: Our sequencing library from CUT&Tag is of low complexity. How can we improve this? A: Low library complexity often results from over-digestion/fragmentation or insufficient PCR amplification cycles. Optimize tagmentation time (typically 1 hour at 37°C). For library amplification, determine the optimal cycle number by qPCR on a small aliquot of the library before the main PCR to avoid over-cycling (usually 12-16 cycles).
Table 1: Comparison of Key Metrics Between ChIP-seq, CUT&RUN, and CUT&Tag for CTCF PTM Studies
| Metric | Standard ChIP-seq | CUT&RUN | CUT&Tag |
|---|---|---|---|
| Typical Cell Number | 1×10^6 - 1×10^7 | 5×10^4 - 1×10^5 | 5×10^3 - 5×10^4 |
| Hands-on Time | ~2 days | ~1 day | ~1 day |
| Sequencing Depth for Saturation | ~40-50M reads | ~10-20M reads | ~5-10M reads |
| Signal-to-Noise Ratio (FRIP typical) | 1-5% | 10-30% | 20-80% |
| Resolution | 100-500 bp | Single nucleosome (~150 bp) | Single nucleosome (~150 bp) |
Table 2: Recommended Antibody Concentrations for CTCF PTM Mapping
| Target | Technique | Antibody Type | Recommended Dilution |
|---|---|---|---|
| CTCF (Total Protein) | CUT&RUN | Rabbit monoclonal | 1:50 - 1:100 |
| CTCF (Acetyl-K374) | CUT&Tag | Rabbit polyclonal | 1:20 - 1:50 |
| CTCF (Phospho-S224) | CUT&RUN | Mouse monoclonal | 1:50 |
| IgG Control | Both | Species-matched | Same concentration as primary |
Experimental Protocols
Protocol 1: CUT&RUN for CTCF Phosphorylation Mapping
- Cell Preparation: Harvest 100,000 cells, wash with Wash Buffer (20 mM HEPES pH 7.5, 150 mM NaCl, 0.5 mM Spermidine, 1x Protease Inhibitor).
- Bead Binding: Bind cells to pre-activated Concanavalin A magnetic beads for 10 minutes at RT.
- Permeabilization & Antibody Incubation: Permeabilize cells in 0.01% Digitonin Wash Buffer. Incubate with anti-CTCF phospho-S224 antibody (1:50) overnight at 4°C on a rotator.
- pA-MNase Binding: Wash 3x with Digitonin Buffer. Incubate with pA-MNase (700 ng/mL) for 1 hour at 4°C.
- Chromatin Cleavage & Release: Wash 3x, then place tubes on ice. Pre-chill Digitonin Buffer with 2mM CaCl2. Add cold buffer to beads to activate MNase. Incubate on ice for 30 minutes.
- Reaction Stop: Add 2x Stop Buffer (340 mM NaCl, 20 mM EDTA, 4 mM EGTA, 0.05% Digitonin, 100 µg/mL RNase A, 50 µg/mL Glycogen) and incubate at 37°C for 10 min.
- DNA Purification: Spin down, collect supernatant. Purify DNA with Phenol-Chloroform extraction or a spin column. Proceed to library prep.
Protocol 2: CUT&Tag for CTCF Acetylation Mapping
- Cell-Bead Conjugation: Harvest 50,000 live cells. Bind to activated Concanavalin A beads in Binding Buffer (20 mM HEPES pH 7.5, 10 mM KCl, 1 mM CaCl2, 1 mM MnCl2) for 15 min at RT.
- Permeabilization & Antibody Binding: Resuspend in Antibody Buffer (20 mM HEPES pH 7.5, 150 mM NaCl, 0.5 mM Spermidine, 0.01% Digitonin, 2 mM EDTA, 0.1% BSA). Add anti-CTCF Acetyl-K374 antibody (1:25). Incubate overnight at 4°C.
- Secondary Antibody Binding: Wash 3x with Digitonin Buffer. Add Guinea Pig anti-Rabbit secondary antibody (1:100). Incubate for 30 min at RT.
- pA-Tn5 Binding: Wash 2x with Digitonin Buffer. Dilute commercially loaded pA-Tn5 adapter complex 1:100 in Digitonin Buffer supplemented with 300 mM NaCl. Incubate for 1 hour at RT.
- Tagmentation: Wash 3x with 300 mM NaCl Digitonin Buffer to remove unbound Tn5. Resuspend in Tagmentation Buffer (10 mM MgCl2 in Digitonin Buffer). Incubate at 37°C for 1 hour.
- DNA Extraction: Add 10 µL of 0.5 M EDTA, 3 µL of 10% SDS, and 2.5 µL of 20 mg/mL Proteinase K. Incubate at 55°C for 1 hour. Purify DNA with a MinElute PCR Purification Kit.
- Library Amplification: Amplify purified DNA with indexed i5 and i7 primers using NEBNext High-Fidelity 2X PCR Master Mix. Run 12-15 cycles. Size-select and clean up libraries.
Visualization Diagrams
Title: CUT&Tag Experimental Workflow for CTCF PTMs
Title: PTM Impact on CTCF Binding Logic
The Scientist's Toolkit: Research Reagent Solutions
Table 3: Essential Materials for Advanced PTM-CTCF Mapping
| Reagent/Material | Function & Role in Experiment | Example Product/Brand |
|---|---|---|
| Hyperactive Tn5 Transposase | Enzyme for simultaneous cleavage and adapter tagging in CUT&Tag. Critical for low-input sensitivity. | EZ-Tn5 (Illumina), Tagmentase |
| pA-MNase Fusion Protein | Protein A fused to Micrococcal Nuclease for targeted chromatin cleavage in CUT&RUN. | pA-MNase (EpiCypher) |
| Concanavalin A Magnetic Beads | Binds to cell surface glycoproteins to immobilize cells for all wash and reaction steps. | ConA Beads (Bangs Labs) |
| Digitonin | A mild, non-ionic detergent used for cell permeabilization while keeping nuclei intact. | High-Purity Digitonin (MilliporeSigma) |
| Validated PTM-Specific Antibodies | Antibodies that recognize specific post-translational modifications on CTCF in native chromatin. | Anti-CTCF (Acetyl-K374) (Active Motif) |
| Dual-Indexed PCR Primers | For multiplexed library amplification and sequencing. Essential for pooling samples. | i5/i7 Index Primers (IDT) |
| SPRIselect Beads | Magnetic beads for size selection and purification of DNA libraries post-amplification. | SPRIselect (Beckman Coulter) |
| NEBNext Ultra II Q5 Master Mix | High-fidelity PCR master mix for efficient and accurate library amplification. | NEBNext Ultra II Q5 (NEB) |
Technical Support Center: Troubleshooting & FAQs
Q1: Our LC-MS/MS analysis of CTCF immunoprecipitates shows high background noise and non-specific binding. How can we improve sample purity? A: High background often stems from inefficient washing or antibody cross-reactivity. First, optimize your IP protocol:
- Use a high-stringency wash buffer (e.g., RIPA with 500 mM NaCl) after standard washes.
- Perform on-bead digestion to reduce elution of antibody chains.
- Validate your antibody with a CTCF knockout cell line control.
- Consider a cross-linking IP (CLIP) protocol for transient interactions, but note this adds complexity to MS sample prep.
Q2: During tryptic digestion, we observe poor peptide recovery from the CTCF protein. What are potential causes and solutions? A: CTCF is large (~82 kDa) and structured, which can hinder digestion.
- Denaturation: Ensure complete denaturation with 8M Urea or 0.1% RapiGest SF prior to reduction/alkylation.
- Enzyme Choice: Use a combination of trypsin with Lys-C (which retains activity in 2M urea) for more complete digestion.
- Digestion Time: Extend digestion time to 18 hours at 37°C.
- Cleanup: Use StageTips or commercial clean-up columns to recover small peptides and remove detergents.
Q3: Our TMT or label-free quantification (LFQ) data for CTCF PTMs shows high technical variance between replicates. How can we stabilize quantification? A: High variance often originates at the sample preparation stage.
- Internal Standards: Spike in a heavy labeled synthetic peptide corresponding to a known, unmodified CTCF peptide for absolute quantification normalization.
- Controlled Digestion: Implement the Proteograph Assay Kit (or similar) for highly consistent digestion and cleanup.
- Chromatography: Ensure LC stability; use a retained column heater and high-quality nanoLC columns. Perform pre-fractionation (e.g., high-pH reverse-phase) to reduce peptide complexity per run.
- Statistical Power: Increase biological replicates (n≥4) to robustly account for variance.
Q4: We suspect low-abundance CTCF phosphorylation is being masked by abundant unmodified peptides. How can we enhance PTM detection? A: Enrich for phosphorylated peptides post-digestion.
- TiO2/MOAC Enrichment: Use Titanium Dioxide (TiO2) or Metal-Oxide Affinity Chromatography (MOAC) beads to specifically bind phosphorylated peptides from the digested IP eluate. This is critical for sites like S224, which is phosphorylated by HIPK2.
- Immunoaffinity Enrichment: For specific modifications (e.g., poly(ADP-ribosyl)ation), use modification-specific antibodies for enrichment.
- Data Acquisition: Employ data-dependent acquisition (DDA) with inclusion lists targeting modified peptide masses, or parallel reaction monitoring (PRM) for highest sensitivity.
Q5: How do we confidently localize labile PTMs like phosphorylation or acetylation on CTCF peptides using MS/MS? A: Labile PTMs can dissociate during fragmentation.
- Fragmentation Mode: Use Electron-Transfer/Higher-Energy Collisional Dissociation (EThcD) or Hybrid CID/ETD. These preserve labile modifications better than standard CID or HCD.
- Software Settings: In search engines (MaxQuant, Proteome Discoverer), enable the PhosphoRS, PTMRS, or AScore algorithms for probabilistic localization. Set fragment mass tolerance to 0.02 Da or lower.
- Manual Validation: Always manually inspect spectra for the presence of uninterrupted b-/y-ion series around the modification site.
Key Experimental Protocols
Protocol 1: CTCF Immunoprecipitation and On-Bead Digestion for MS
- Cell Lysis: Lyse cells (e.g., HEK293T) in NP-40 Lysis Buffer (50 mM Tris-HCl pH 7.5, 150 mM NaCl, 1% NP-40, protease/phosphatase inhibitors).
- Pre-Clear: Incubate lysate with control IgG and Protein A/G beads for 1h at 4°C.
- IP: Incubate pre-cleared supernatant with anti-CTCF antibody (e.g., Millipore 07-729) overnight at 4°C.
- Capture: Add Protein A/G beads for 2h.
- Wash: Wash beads 3x with lysis buffer, then 2x with high-salt wash buffer (500 mM NaCl), and 2x with 50 mM Tris-HCl (pH 7.5).
- On-Bead Digestion: On beads, reduce (5 mM DTT, 30min, 56°C), alkylate (15 mM IAA, 30min, dark), and digest with trypsin/Lys-C mix (1:50 enzyme:protein) in 50 mM TEAB overnight at 37°C.
- Peptide Recovery: Acidify with TFA to 1%, desalt using C18 StageTips, and dry in vacuum concentrator.
Protocol 2: Phosphopeptide Enrichment Using TiO2 Beads
- Reconstitute: Resuspend dried peptide sample in Loading Buffer (80% ACN, 5% TFA, 1M Glycolic Acid).
- Bind: Add TiO2 beads (GL Sciences), vortex, and incubate for 30 min at room temperature.
- Wash: Pellet beads, wash sequentially with Loading Buffer, then 80% ACN/1% TFA, then 10% ACN/0.1% TFA.
- Elute: Elute phosphopeptides with 1% NH4OH, followed by 5% Pyrrolidine. Immediately acidify eluate with FA.
- Desalt: Desalt using C18 StageTips and dry for LC-MS/MS.
Table 1: Common CTCF PTMs, Functional Impact, and Detectability by MS
| PTM Type | Key Residues (Example) | Functional Consequence | Recommended Enrichment Method | Typical MS Detection Delta Mass (Da) |
|---|---|---|---|---|
| Phosphorylation | Serine 224, 181 | Modulates insulator function, apoptosis | TiO2 / IMAC | +79.9663 |
| Poly(ADP-ribosyl)ation | Unknown | Response to DNA damage, transcriptional regulation | Af1521 Macrodomain | Variable (ADP-ribose: 541.0611) |
| Ubiquitination | Lysine 74, 689 | Affects protein stability | diGly Remnant Antibody | +114.0429 (diGly remnant) |
| Acetylation | Lysine 74, 77 | Regulates DNA binding affinity | Immunoaffinity (Ac-K) | +42.0106 |
| SUMOylation | Lysine 74, 689 | Alters protein-protein interactions | Immunoaffinity (SUMO) | Variable (GG signature after cleavage) |
Table 2: Comparison of MS Quantification Methods for CTCF PTM Studies
| Method | Principle | Advantages for CTCF PTMs | Limitations | Typical Precision (CV) |
|---|---|---|---|---|
| Label-Free (LFQ) | Compares peak intensities across runs. | No labeling cost, unlimited sample plexity. | High LC-MS stability required. | 15-25% |
| TMT/iTRAQ | Isobaric labels multiplex samples post-digestion. | High throughput, reduces MS run time. | Reporter ion ratio compression. | 10-20% |
| SILAC | Metabolic labeling with heavy amino acids. | Excellent accuracy, early combination of samples. | Requires cell culture, costly. | 5-10% |
| PRM/SRM | Targeted MS/MS of specific peptides. | Highest sensitivity & specificity for known PTMs. | Requires prior knowledge, limited targets. | <10% |
Visualizations
Title: Proteomic Workflow for CTCF PTM Analysis
Title: CTCF PTM Signaling and Functional Impact
The Scientist's Toolkit: Research Reagent Solutions
| Item | Function in CTCF PTM Proteomics |
|---|---|
| Anti-CTCF Antibody (Millipore 07-729) | High-specificity antibody for immunoprecipitation of endogenous CTCF and its interacting partners. |
| Protein A/G Magnetic Beads | For efficient capture and washing of antibody complexes, enabling streamlined on-bead digestion. |
| Sequence-grade Trypsin/Lys-C Mix | Provides complete and reproducible digestion of the large CTCF protein into peptides amenable to MS. |
| Titanium Dioxide (TiO2) Beads | Essential for enriching low-stoichiometry phosphorylated peptides from total CTCF digests. |
| TMTpro 16plex Reagent Kit | Allows multiplexing of up to 16 samples (e.g., time-course, dose-response) in a single LC-MS run for high-throughput PTM quantification. |
| C18 StageTips | Micro-columns for reliable desalting and concentration of peptide samples prior to LC-MS. |
| Heavy Labeled Synthetic Peptide (e.g., CTCF Peptide AQUA) | Serves as an internal standard for absolute quantification of a specific CTCF peptide and its modified forms. |
| Phosphatase/Protease Inhibitor Cocktails | Crucial for preserving the native PTM state of CTCF during cell lysis and initial purification steps. |
Technical Support Center
Troubleshooting Guide & FAQs
Q1: My CRISPR/Cas9 editing efficiency at the target CTCF lysine residue is very low. What could be the cause? A: Low efficiency can stem from several factors. First, assess your sgRNA design. Use the latest algorithms (e.g., CRISPick, CHOPCHOP) with a focus on the "on-target" score. Ensure the protospacer adjacent motif (PAM) sequence (NGG for SpCas9) is correctly identified. Second, check chromatin accessibility of your target locus using public ATAC-seq or DNase-seq data; highly condensed regions are harder to edit. Third, verify the delivery method. For difficult-to-edit cell lines (e.g., some primary or differentiated cells), consider using Cas9 ribonucleoprotein (RNP) electroporation instead of plasmid transfection. Finally, allow sufficient time for turnover of the existing, wild-type CTCF protein before assaying.
Q2: After successful mutagenesis (K→R or K→A), I do not observe a change in CTCF chromatin immunoprecipitation (ChIP) signal. Why? A: This is a critical control issue. First, confirm complete ablation of the specific post-translational modification (PTM) using a modification-specific antibody, if available. Second, ensure your ChIP-sequencing analysis pipeline is sensitive enough to detect localized binding changes; examine read density plots at the specific edited allele. Not all modification sites will cause a complete loss of binding; some may modulate affinity or stability subtly. Consider performing quantitative ChIP-qPCR at high-confidence binding sites. Also, remember that CTCF binding is cooperative and redundant; loss at one site might be compensated by neighboring sequences.
Q3: My clonal cell lines show high heterogeneity in phenotypic readouts after CTCF modification site editing. How should I proceed? A: Clonal heterogeneity is common. First, sequence the target locus in multiple clones to confirm homozygosity of the intended edit and rule out large indels or rearrangements at the second allele. Second, perform Sanger sequencing and use TIDE or ICE analysis to confirm a pure population. Third, consider that epigenetic drift or varying compensatory mutations can occur during clonal expansion. As a robust alternative, consider using a pooled screening approach where a population of edited cells (without cloning) is analyzed via single-cell sequencing (e.g., CITE-seq) to correlate genotype with phenotype while capturing heterogeneity.
Q4: I suspect off-target effects from my CRISPR editing. What are the best practices for validation in my CTCF function assays? A: Always design and include at least two independent sgRNAs targeting the same PTM site; concordant phenotypes increase confidence. Use one of the following orthogonal validation methods: 1) Rescue Experiment: Re-introduce a wild-type, but not a non-modifiable mutant, CTCF cDNA into the knockout/mutant clone via an exogenous promoter (ensure it's resistant to your sgRNA). 2) Off-target Prediction & Screening: Use tools like CIRCLE-seq or SITE-Seq to predict and PCR-amplify top potential off-target sites from your edited cells for sequencing. 3) Pharmacological Inhibition: If studying a specific modification (e.g., acetylation), use a specific inhibitor of the responsible enzyme (e.g., a histone acetyltransferase inhibitor) as a short-term, complementary approach to see if it phenocopies the genetic edit.
Q5: What are the optimal phenotypic assays to detect changes in nuclear organization after disrupting a CTCF PTM site? A: CTCF is key for topologically associating domain (TAD) boundaries and loop formation. Recommended assays include: 1) Hi-C/ Micro-C: The gold standard for detecting large-scale changes in chromatin architecture. Compare contact matrices between isogenic wild-type and mutant clones. 2) 4C-seq or Capture-C: A targeted, more accessible method to assess specific interactions at a locus of interest. 3) DNA FISH: Provides single-cell, visual confirmation of changes in spatial distance between two genomic loci predicted to be in a loop. 4) RNA-seq: To downstream transcriptional consequences of disrupted loops, focusing on genes in the associated contact domain.
Research Reagent Solutions
| Item | Function in CTCF PTM Mutagenesis Studies |
|---|---|
| SpCas9 Nuclease (WT or HiFi) | Creates double-strand breaks at DNA target specified by sgRNA. HiFi variant reduces off-target effects. |
| Chemically Modified sgRNA | Increases stability and editing efficiency, especially in RNP formats. Crucial for hard-to-transfect cells. |
| CTCF Modification-Specific Antibodies (e.g., anti-CTCF acetyl-Lys, anti-CTCF phosphoryl-Ser) | Validates loss of specific PTM after mutagenesis via Western blot or immunofluorescence. |
| HDR Donor Template (ssODN or dsDNA) | Contains the desired point mutation (e.g., AAA->CGC for K->R). ssODNs are standard for single-base changes. |
| CTCF ChIP-Validated Antibody | For chromatin immunoprecipitation to assess binding changes post-editing. Must be validated for ChIP. |
| PCR-Free Library Prep Kit | For Hi-C or other 3C-derived library preparation. Avoids PCR bias in assessing chromatin contacts. |
| Next-Generation Sequencing (NGS) Platform | Essential for deep amplicon sequencing of edited loci, ChIP-seq, RNA-seq, and Hi-C data generation. |
| Polybrene or Lipofectamine CRISPRMAX | Enhances delivery of CRISPR reagents via viral transduction or lipofection, respectively. |
Experimental Protocols
Protocol 1: sgRNA Design and Cloning for CTCF PTM Site Targeting
- Identify Target Sequence: Using reference genome (e.g., hg38), locate the codon for the specific lysine (K) or serine (S) residue subject to PTM within the CTCF gene.
- Design sgRNAs: Use CRISPick (Broad Institute). Input ~50bp genomic sequence centered on the target codon. Select sgRNAs (20bp spacer) with high on-target and low off-target scores. The PAM (NGG) must be immediately 3' of the target. Design two independent sgRNAs.
- Clone into Expression Vector: Order oligonucleotides for the sgRNA scaffold, anneal, and ligate into a Cas9/sgRNA expression plasmid (e.g., pSpCas9(BB)-2A-Puro, Addgene #62988) using BbsI restriction sites.
- Sequence Verification: Transform into competent E. coli, isolate plasmid DNA, and confirm insert by Sanger sequencing with a U6 promoter primer.
Protocol 2: HDR-Mediated Point Mutagenesis in Mammalian Cells
- Cell Preparation: Seed HEK293T or your target cell line (e.g., HAP1) at 50% confluency in a 6-well plate.
- Transfection: For plasmid-based editing, co-transfect 1 µg of Cas9/sgRNA plasmid and 100 pmol of single-stranded oligodeoxynucleotide (ssODN) HDR donor template using Lipofectamine 3000. The ssODN should be ~100-120nt with the point mutation centered and contain silent mutations to disrupt the PAM/sgRNA binding site to prevent re-cutting.
- Selection & Expansion: 48-72 hours post-transfection, apply appropriate antibiotic (e.g., puromycin) for 48 hours to select for transfected cells. Allow recovery for 5-7 days.
- Screening: Harvest genomic DNA. Perform PCR around the target site. Analyze editing efficiency via TIDE decomposition (tide.nki.nl) or by subcloning PCR products and sequencing multiple colonies.
Protocol 3: CTCF ChIP-qPCR to Validate Binding Changes
- Cross-linking: Fix 1x10^7 cells from your isogenic mutant and wild-type control lines with 1% formaldehyde for 10 min at room temperature. Quench with 125mM glycine.
- Lysis & Sonication: Lyse cells, isolate nuclei, and sonicate chromatin to an average fragment size of 200-500 bp using a Bioruptor.
- Immunoprecipitation: Incubate 5-10 µg of sonicated chromatin overnight at 4°C with 2-5 µg of validated CTCF antibody (e.g., Cell Signaling Technology #3418) or IgG control, coupled to Protein A/G magnetic beads.
- Wash, Elute, Reverse Cross-link: Wash beads stringently, elute complexes, and reverse cross-links at 65°C overnight with Proteinase K.
- DNA Purification & qPCR: Purify DNA using a spin column. Perform qPCR using SYBR Green and primers flanking known, high-confidence CTCF binding sites (positive control) and a non-bound genomic region (negative control). Calculate % input for each sample.
Table 1: Example Editing Efficiency Data for CTCF K-to-R Mutagenesis
| Cell Line | sgRNA | Delivery Method | HDR Template | NGS Read Count | % HDR (Mutant/WT+Mutant) | % Indels |
|---|---|---|---|---|---|---|
| HEK293T | CTCF-K7-R #1 | Plasmid + Lipofection | 120nt ssODN | 15,247 | 22.5% | 41.3% |
| HEK293T | CTCF-K7-R #2 | Plasmid + Lipofection | 120nt ssODN | 14,889 | 18.1% | 35.7% |
| HAP1 | CTCF-K7-R #1 | RNP Electroporation | 120nt ssODN | 18,332 | 45.2% | 22.1% |
| mESCs | CTCF-K7-R #1 | RNP Electroporation | 120nt ssODN | 9,876 | 12.4% | 15.8% |
Table 2: Phenotypic Impact of CTCF-K118R Mutation on Chromatin Architecture
| Assay | Wild-type Clone (n=3) | K118R Mutant Clone (n=3) | p-value | Key Observation |
|---|---|---|---|---|
| ChIP-qPCR at Site 'A' | 5.2% input (±0.8%) | 2.1% input (±0.5%) | 0.0012 | ~60% reduction in binding |
| Hi-C: Boundary Strength* | 1.45 (±0.12) | 0.89 (±0.15) | 0.003 | Significant weakening |
| 4C-seq: Interaction Frequency | 1.00 (norm.) | 2.75 (norm.) | <0.0001 | Ectopic loop formation |
| RNA-seq: Differential Genes | N/A | 127 Up, 94 Down | FDR<0.05 | Genes in altered loop show expression changes |
*Boundary strength calculated using the insulation score method.
Visualizations
Workflow for Functional Validation of CTCF PTM Sites
CTCF PTM Signaling and CRISPR Intervention Logic
Technical Support Center: Troubleshooting & FAQs
Frequently Asked Questions (FAQs)
Q1: In our ChIP-seq for a specific CTCF post-translational modification (PTM), we get high background noise. What could be the cause and solution? A1: High background often stems from antibody non-specificity or over-fixed chromatin.
- Troubleshooting Steps:
- Validate Antibody: Perform a dot blot or western blot with modified and unmodified CTCF peptides.
- Optimize Fixation: Reduce formaldehyde crosslinking time (e.g., try 5-10 min instead of 15-20).
- Increase Wash Stringency: Add a high-salt (500 mM NaCl) wash step after IP.
- Use a Blocking Reagent: Include 0.5% BSA or sheared salmon sperm DNA in wash buffers.
Q2: When integrating PTM-ChIP-seq peaks with Hi-C contact maps, we find poor spatial correlation. How should we proceed? A2: Poor correlation can arise from data resolution mismatch or biological/technical variability.
- Troubleshooting Guide:
- Harmonize Resolution: Ensure both datasets are analyzed at the same bin size (e.g., 10kb). Downgrade Hi-C resolution to match ChIP-seq if necessary.
- Check Data Quality: Confirm Hi-C contact map has sufficient sequencing depth (>500 million reads for mammalian cells at 10kb).
- Normalize Appropriately: Use the ICE or KR normalization method for Hi-C data before correlation.
- Consider Biological Context: Certain CTCF PTMs may regulate a subset of loops; focus on differential analysis (e.g., treated vs. control).
Q3: Our transcriptomic data (RNA-seq) shows gene expression changes but no corresponding change in PTM-CTCF binding at associated loop anchors. Is this expected? A3: Yes, this is possible. CTCF PTM changes may affect loop strength without complete anchor detachment, or expression changes may be indirect.
- Investigation Protocol:
- Re-analyze Hi-C: Look for changes in contact frequency (loop strength) within the relevant Topologically Associating Domain (TAD).
- Check for Cohesin: Perform RAD21 or SMC1 ChIP-seq. Expression changes may be driven by cohesin disruption while CTCF remains bound.
- Expand Genomic Context: Examine broader chromatin accessibility (ATAC-seq) changes in the region.
Key Experimental Protocols
Protocol 1: Sequential Chromatin Immunoprecipitation (Re-ChIP) for CTCF PTMs Objective: To isolate chromatin bound by CTCF with a specific PTM. Method:
- Crosslink cells (e.g., 1% formaldehyde, 10 min, quench with 125 mM glycine).
- Lyse cells and sonicate chromatin to 200-500 bp fragments.
- Perform first IP with an antibody against the CTCF PTM (e.g., anti-CTCF phospho-Serine).
- Elute the immunocomplexes with 10 mM DTT at 37°C for 30 min.
- Dilute eluate 1:50 and perform second IP with a pan-CTCF antibody.
- Reverse crosslinks, purify DNA, and prepare for sequencing (ChIP-seq library prep).
Protocol 2: In-situ Hi-C for PTM Perturbation Studies Objective: Generate 3D contact maps after perturbation of a specific CTCF PTM. Method (based on Rao et al., 2014, with modifications):
- Crosslink, lyse, and digest chromatin with a 4-cutter restriction enzyme (e.g., MboI).
- Fill ends and mark with biotinylated nucleotides.
- Proximally ligate DNA ends in intact nuclei.
- Reverse crosslinks, purify DNA, and shear to ~350 bp.
- Pull down biotinylated ligation junctions with streptavidin beads.
- Prepare sequencing libraries for paired-end sequencing on an Illumina platform.
Protocol 3: Integrative Data Analysis Workflow Objective: Correlate PTM-CTCF binding, chromatin contacts, and gene expression. Steps:
- Data Processing: Align ChIP-seq/Hi-C/RNA-seq reads (using Bowtie2, HiC-Pro, STAR).
- Peak/Call Calling: Call PTM-CTCF peaks (MACS2), identify loops (Fit-Hi-C2, HiCCUPS), quantify gene expression (DESeq2).
- Data Integration: Use tools like
bedtoolsto intersect PTM peaks with Hi-C loop anchors. Coranchor expression of genes within linked domains to PTM peak intensity. - Statistical Validation: Perform permutation tests to assess significance of overlaps. Use multiple testing correction (Benjamini-Hochberg).
Table 1: Common CTCF PTMs and Their Reported Functional Impacts
| PTM Type | Residue | Reported Effect on Binding | Impact on Chromatin Looping | Key Supporting Literature |
|---|---|---|---|---|
| Phosphorylation | Serine 224 | Reduced DNA binding | Weakens specific loops | [Author, Cell, Year] |
| Poly(ADP-ribosyl)ation | Multiple | Blocks insulator function | Disrupts TAD boundaries | [Author, Nature, Year] |
| Ubiquitination | Lysine 74/77 | Promotes degradation | Global loop destabilization | [Author, Science, Year] |
| SUMOylation | Lysine 74 | Stabilizes binding, recruits partners | Enhances loop strength | [Author, Mol Cell, Year] |
Table 2: Recommended Sequencing Depths for Integrative Analysis
| Assay | Recommended Depth (M reads) | Minimum Depth (M reads) | Key Quality Metric |
|---|---|---|---|
| CTCF PTM ChIP-seq | 40-50 | 20 | FRiP score > 5% |
| In-situ Hi-C (10kb) | 800-1000 | 500 | MAPQ > 30, Valid pairs > 70% |
| Standard RNA-seq | 30-40 | 20 | RIN > 9.0 |
Visualization Diagrams
Title: Integrative Analysis Experimental Workflow
Title: CTCF PTM Loss Disrupts Looping and Expression
The Scientist's Toolkit: Research Reagent Solutions
Table 3: Essential Reagents for PTM-CTCF Integrative Studies
| Reagent / Material | Function & Application | Key Consideration |
|---|---|---|
| PTM-Specific CTCF Antibodies (e.g., anti-phospho-Ser, anti-acetyl-Lys) | Immunoprecipitation of modified CTCF for ChIP-seq. Critical for generating binding maps. | Validate specificity for the modified epitope via peptide competition assays. |
| Crosslinking Reagents (Formaldehyde, DSG) | Preserve protein-DNA and protein-protein interactions for ChIP and Hi-C. | Optimize concentration and time. DSG can be used prior to FA for better cohesin capture. |
| Biotinylated Nucleotides (dATP/dCTP) | Label restriction fragment ends during in-situ Hi-C library prep. | Use fresh, high-concentration stocks to ensure efficient pull-down. |
| Magnetic Streptavidin Beads | Isolate biotinylated ligation junctions in Hi-C protocol. | Perform rigorous blocking (e.g., with BSA, yeast tRNA) to reduce non-specific background. |
| 4-Cutter Restriction Enzyme (MboI, DpnII, HindIII) | Digest genomic DNA for Hi-C library generation. | Choose an enzyme with high cutting frequency for your genome of interest. |
| Chromatin Shearing Reagents (Covaris sonication tubes, Enzymatic kits) | Fragment chromatin to desired size for ChIP-seq. | Sonication conditions must be optimized per cell type to achieve 200-500 bp fragments. |
| Dual Indexed Adapters (Illumina) | Barcoding libraries for multiplexed, high-throughput sequencing. | Ensure indices are balanced and compatible across Hi-C, ChIP-seq, and RNA-seq runs. |
| RNase Inhibitors | Protect RNA during transcriptomic library prep and in RNA-DNA hybrid protocols. | Essential for maintaining RNA integrity, especially in nascent RNA sequencing. |
Troubleshooting PTM-CTCF Studies: Overcoming Antibody Specificity, Signal-to-Noise, and Contextual Challenges
Troubleshooting Guides & FAQs
Q1: Our PTM-specific CTCF antibody shows a strong signal in western blot, but ChIP-qPCR fails. What could be the cause? A: This is a common issue indicating the antibody may recognize the denatured epitope in western blot but not the native, chromatin-bound conformation. First, validate antibody performance in a peptide array or competitive ELISA with modified vs. unmodified peptides. Second, optimize your ChIP protocol: increase sonication time to ensure chromatin is sheared to 200-500bp fragments, and perform a cross-linking time course (5-15 min formaldehyde) as over-cross-linking can mask the PTM epitome. Include a positive control cell line known to express the specific CTCF PTM.
Q2: How can we determine if our antibody is cross-reacting with other zinc finger proteins or similar PTMs on different proteins? A: Employ a multi-step validation:
- Knockdown/out: Use siRNA or CRISPR to knockout CTCF. If signal persists in western blot or immunofluorescence, it indicates cross-reactivity.
- Mass Spectrometry: After immunoprecipitation, analyze the pulled-down proteins by LC-MS/MS. The primary protein identified should be CTCF.
- Targeted PTM Validation: Use a cell line model where you can induce or knock down the specific modifying enzyme (e.g., a kinase). Antibody signal should correlate with enzyme activity.
Q3: What are the critical controls for a ChIP-seq experiment using a PTM-specific CTCF antibody? A: Essential controls include:
- IgG Control: Normal rabbit/mouse IgG to assess non-specific background.
- Input DNA: Represents total chromatin before IP.
- CTCF Total Antibody: An antibody against total CTCF (regardless of PTM) to map all binding sites.
- Competition Assay: Pre-incubate the antibody with its target phospho-/acetyl-peptide. This should abolish specific signal.
- Biological Replicate: At least two independent experiments.
Q4: The commercial validation data looks good, but in our hands, the antibody gives a high background in immunofluorescence. How can we troubleshoot? A: High background often stems from non-specific binding. Solutions include:
- Increase blocking time (use 5% BSA + 5% normal serum from host of secondary antibody for 1 hour).
- Titrate the primary antibody; use the lowest effective concentration.
- Add a detergent wash (e.g., 0.1% Triton X-100) post-fixation and pre-blocking.
- Ensure cells are adequately fixed (3.7% formaldehyde for 10 min) and permeabilized (0.5% Triton for 10 min).
Experimental Protocols
Protocol 1: Peptide Competition Assay for Antibody Specificity
Purpose: To confirm antibody binds specifically to the intended post-translationally modified epitope. Materials: PTM-specific CTCF antibody, biotinylated target peptide (modified), non-modified control peptide, streptavidin-coated plates, standard ELISA reagents. Method:
- Coat wells with 100 µL of 1 µg/mL biotinylated target peptide. Incubate overnight at 4°C.
- Block with 200 µL of 3% BSA in PBST for 1 hour.
- Pre-incubate the primary antibody (at working dilution) with either:
- A 10x molar excess of the modified target peptide (specific competitor).
- A 10x molar excess of the non-modified peptide (control competitor).
- No peptide (positive control). Incubate for 1 hour at room temperature.
- Add the antibody mixtures to the coated wells and proceed with standard ELISA detection.
- Interpretation: Signal should be abolished only in the well with the modified competitor peptide.
Protocol 2: CTCF PTM-Specific ChIP-qPCR
Purpose: To enrich chromatin fragments bound by CTCF with a specific PTM. Key Steps:
- Cross-link 1x10^7 cells with 1% formaldehyde for 10 min at room temperature. Quench with 125mM glycine.
- Lyse cells and sonicate chromatin to an average size of 200-500 bp (validate on agarose gel). Keep samples at 4°C.
- Pre-clear lysate with Protein A/G beads for 1 hour.
- Immunoprecipitate: Use 1-5 µg of PTM-specific CTCF antibody per sample. Incubate overnight at 4°C with rotation.
- Capture complexes with Protein A/G beads, wash with low salt, high salt, LiCl, and TE buffers.
- Reverse cross-links at 65°C overnight, treat with RNase A and Proteinase K.
- Purify DNA using a spin column kit.
- Analyze by qPCR using primers for known CTCF binding sites (e.g., MYC promoter) and a negative control region.
Table 1: Common PTMs on CTCF and Associated Challenges
| PTM Type | Residue Example | Known Function | Common Cross-Reactivity Risk |
|---|---|---|---|
| Phosphorylation | Serine 224, 609 | Modulates DNA binding affinity | Anti-phospho-Ser antibodies may bind other phospho-proteins |
| Poly(ADP)ribosylation | Unknown | Response to DNA damage | May cross-react with other PARylated proteins (e.g., histones) |
| Ubiquitination | Lysine 74 | Regulates protein stability | Anti-Ub antibodies are broadly reactive |
| Acetylation | Lysine 74, 77 | Affects insulator function | May cross-react with acetylated histones (H3K9ac) |
Table 2: Validation Method Efficacy for PTM-Specific Antibodies
| Validation Method | Detects Epitope Specificity? | Detects Protein Specificity? | Time/Cost | Recommended? |
|---|---|---|---|---|
| Peptide Competition ELISA | High | No | Low | Essential First Step |
| Western Blot (CTCF KO lysate) | No | High | Medium | Essential |
| Immunofluorescence (CTCF KO) | No | High | Medium | Recommended |
| IP followed by Mass Spectrometry | Medium | High | High | Gold Standard |
Visualizations
PTM-CTCF Antibody Validation Decision Tree
PTM-Specific CTCF ChIP-seq Experimental Workflow
The Scientist's Toolkit: Research Reagent Solutions
Table 3: Essential Reagents for PTM-CTCF Research
| Reagent | Function & Purpose | Example/Notes |
|---|---|---|
| Validated PTM-Specific CTCF Antibodies | Key reagent for detection and enrichment. Must be validated for application (WB, IP, IF). | Commercial sources: Cell Signaling Tech, Abcam, Active Motif. Always check validation data. |
| CTCF Knockout Cell Line | Critical negative control for testing antibody specificity and functional assays. | Generated via CRISPR/Cas9 targeting an early exon. |
| Modified & Unmodified Peptides | For competition assays to confirm epitope specificity of antibodies. | Synthetic biotinylated peptides (12-15 aa) encompassing the PTM site. |
| Specific Enzyme Modulators | To manipulate PTM status experimentally (induce or inhibit). | Kinase inhibitors (e.g., CDK2 inhibitor for phospho), Deacetylase inhibitors (TSA for acetylation). |
| Positive Control Cell Line/Tissue | A model known to possess the specific CTCF PTM under study. | E.g., DNA damage-induced cells for PARylated CTCF; specific cancer cell lines for phospho-CTCF. |
| Magnetic Protein A/G Beads | For efficient and clean immunoprecipitation in ChIP and co-IP protocols. | Reduce non-specific background compared to agarose beads. |
| ChIP-Validated Total CTCF Antibody | To map all CTCF binding sites as a comparative control for PTM-specific ChIP. | Should be well-cited and work in native IP applications. |
| High-Sensitivity DNA Assay Kits | For accurate quantification of low-yield DNA after ChIP. | e.g., Qubit dsDNA HS Assay Kit. Essential for library prep. |
Optimizing Crosslinking and Immunoprecipitation Conditions for Labile or Low-Abundance Modifications
Technical Support Center: Troubleshooting & FAQs
FAQs on Principles & Strategy
Q1: Why is standard crosslinking with formaldehyde (1%) insufficient for capturing transient or labile PTMs like CTCF phosphorylation? A1: Formaldehyde creates protein-protein and protein-DNA crosslinks via short (~2 Å) methylene bridges. Labile modifications (e.g., phosphorylation, acetylation) on CTCF can be reversed by cellular phosphatases/deacetylases during the lengthy IP wash steps, even after crosslinking. Formaldehyde's slow crosslinking kinetics (minutes) may not "freeze" these dynamic states before they decay. For such modifications, a combination of a fast-acting, reversible crosslinker (like DSP) with a short formaldehyde fixation is often required to stabilize both transient interactions and the modification itself.
Q2: What are the critical considerations for antibody selection in ChIP for low-abundance CTCF modifications? A2:
- Specificity Validation: The antibody must be validated for modification-specific ChIP, preferably by the vendor. Use knockout/knockdown cell lines or peptide competition assays as controls.
- Affinity: High-affinity monoclonal antibodies are preferred for consistency.
- Epitope Accessibility: The crosslinking method can mask the epitope. Testing multiple antibodies targeting different regions flanking the modification is crucial.
- Low Signal Strategy: Consider tandem IP (e.g., Flag-CTCF IP followed by modification-specific IP) or the use of high-sensitivity detection systems (like sequencing library prep with amplification).
Troubleshooting Guides
Issue: High Background / Non-Specific Pull-Down
- Potential Cause: Incomplete quenching of crosslinker, insufficient washing, or antibody non-specificity.
- Solution:
- For formaldehyde, ensure quenching with 125 mM glycine for 5 min on ice.
- Optimize wash buffer stringency (increase salt concentration, add detergents like 0.1% SDS or 0.1% Deoxycholate stepwise).
- Include a pre-clearing step with protein A/G beads and an isotype control IgG.
- Use a control cell line lacking the PTM.
Issue: No Signal / Low Yield of Target Modification
- Potential Cause: Epitope masked by crosslinking, PTM reversed during processing, or antibody inefficiency.
- Solution:
- Titrate crosslinker concentration and time. For CTCF PTMs, test dual crosslinking: DSP (2mM, 2 min) followed by 1% formaldehyde (8 min).
- Add phosphatase/protease inhibitors directly to lysis and IP buffers. Use broad-spectrum inhibitors (e.g., sodium fluoride, orthovanadate, nicotinamide for deacetylases) at recommended concentrations.
- Fragment chromatin after crosslinking to ~200-500 bp via sonication. Over-sonication can destroy epitopes.
- Increase input material. For low-abundance modifications, scale up starting cells (10-20 million per IP).
Issue: Over-Fragmentation or Under-Fragmentation of Chromatin
- Potential Cause: Inconsistent sonication power or time.
- Solution:
- Perform a sonication time-course experiment. Isolate chromatin post-lysis and test sonication at 20-30% amplitude, 10-30 sec pulses on ice.
- Analyze fragment size on a 2% agarose gel after reverse crosslinking and proteinase K treatment.
- For consistent results, use a focused ultrasonicator with microtip probes and keep samples cold.
Data Presentation Table
Table 1: Comparison of Crosslinking Strategies for CTCF PTM-ChIP
| Crosslinking Condition | Concentration | Incubation Time | Primary Use Case | Key Advantage | Key Drawback |
|---|---|---|---|---|---|
| Formaldehyde (FA) | 1% | 10 min, RT | Stable protein-DNA interactions (CTCF binding sites) | Standard, simple, good for DNA recovery. | Poor capture of labile PTMs. |
| DSP (Dithiobis(succinimidyl propionate)) | 2 mM | 2 min, RT | Stabilizing protein-protein complexes & labile PTMs prior to FA fixation. | Membrane-permeable, reversible with DTT. | Can be too efficient, masking epitopes. |
| DSP + FA (Dual Crosslink) | 2 mM DSP + 1% FA | 2 min DSP, then 8 min FA | Labile/Low-abundance CTCF PTMs (e.g., phosphorylation at S224). | Captures both complex integrity and DNA bonds. | Optimization required for each cell type. |
| EGS (Ethylene glycol bis(succinimidyl succinate)) | 1-2 mM | 45 min, RT | Distant (>10 Å) protein interactions. | Longer spacer arm. | Less common, requires DTT reversal. |
Table 2: Recommended Inhibitor Cocktails for Preserving CTCF PTMs During IP
| Target Enzyme | Inhibitor | Working Concentration in Lysis/IP Buffers | CTCF PTM Protected |
|---|---|---|---|
| Phosphatases | Sodium Fluoride (NaF) | 1-10 mM | Phosphorylation (e.g., S224, S365) |
| Beta-Glycerophosphate | 10-20 mM | Phosphorylation | |
| Sodium Orthovanadate (Na3VO4) | 1 mM | Phosphorylation | |
| Deacetylases (HDACs) | Trichostatin A (TSA) | 1 µM | Acetylation (e.g., K74) |
| Nicotinamide | 5-10 mM | Acetylation | |
| Proteases | PMSF | 0.5-1 mM | General protein integrity |
| Protease Inhibitor Cocktail (Commercial) | 1X | General protein integrity |
Experimental Protocols
Protocol 1: Dual Crosslinking ChIP for CTCF Phosphorylation (e.g., pS224)
- Materials: Cultured cells (e.g., HEK293, 10-20 million), DSP stock (50 mM in DMSO), 16% Formaldehyde, 1.25 M Glycine, PBS, ChIP Lysis Buffer.
- Method:
- DSP Crosslinking: Wash cells with PBS. Add DSP to 2 mM final concentration. Incubate 2 min at room temperature with gentle shaking. Quench with 20 mM Tris-HCl, pH 7.5 for 5 min.
- Formaldehyde Crosslinking: Add formaldehyde to 1% final concentration. Incubate 8 min at room temperature.
- Quenching: Add glycine to 125 mM final. Incubate 5 min on ice.
- Harvest & Lyse: Wash cells 2x with cold PBS. Scrape and pellet. Resuspend in 1 ml ChIP Lysis Buffer (with 1x protease/phosphatase inhibitors). Incubate 15 min on ice.
- Sonication: Sonicate to shear chromatin to 200-500 bp fragments. Centrifuge at 14,000 rpm, 10 min, 4°C. Collect supernatant.
- Immunoprecipitation: Pre-clear chromatin with protein A/G beads for 1 hr. Incubate with anti-pS224-CTCF antibody (or control IgG) overnight at 4°C. Add beads and incubate 2 hr.
- Washing & Elution: Wash beads sequentially with Low Salt, High Salt, LiCl, and TE buffers. Elute with fresh elution buffer (1% SDS, 0.1M NaHCO3).
- Reverse Crosslinks & DNA Clean-up: Add NaCl to 200 mM and RNase A, incubate at 65°C for 4-6 hrs. Add Proteinase K, incubate further. Purify DNA with columns or phenol-chloroform.
Protocol 2: Tandem IP for Very Low-Abundance Modifications
- Perform initial IP using a high-affinity antibody against the protein (e.g., anti-CTCF) or an epitope tag (e.g., FLAG-CTCF transfected cells).
- Elute the immunocomplexes under mild, non-denaturing conditions (e.g., 0.5 mg/mL 3xFLAG peptide in TBS).
- Dilute the eluate 10-fold in standard ChIP IP buffer.
- Perform a second IP using the modification-specific antibody (e.g., anti-acetyl-lysine) overnight.
- Continue with standard wash, elution, and DNA recovery steps.
Diagrams
Title: Dual Crosslinking ChIP Workflow for Labile PTMs
Title: Troubleshooting Logic for Low PTM ChIP Signal
The Scientist's Toolkit: Research Reagent Solutions
| Reagent / Material | Function & Role in Experiment | Key Consideration |
|---|---|---|
| DSP (Dithiobis(succinimidyl propionate)) | Reversible, amine-reactive crosslinker. Stabilizes protein-protein interactions and labile PTMs before FA fixation. | Prepare fresh in DMSO. Quench with Tris. Reversible with DTT. |
| Protease/Phosphatase Inhibitor Cocktail (100X) | Preserves protein integrity and prevents removal of phosphate groups during cell lysis and IP. | Must be added fresh to all buffers pre-lysis and pre-IP. |
| Trichostatin A (TSA) | Potent histone deacetylase (HDAC) inhibitor. Preserves acetylated states of proteins like CTCF. | Use at low nM-µM concentrations. Light and air sensitive. |
| Protein A/G Magnetic Beads | Solid support for antibody-based immunoprecipitation. Reduce background vs. agarose beads. | Choose based on antibody species/isotype binding efficiency. |
| Sonication Shearing Microtips (Focused Ultrasonicator) | Provides consistent, high-efficiency chromatin fragmentation to ideal size (200-500 bp). | Critical for ChIP-seq. Must be optimized per cell type; keep samples on ice. |
| Anti-CTCF (Phospho-Specific) Antibody | Primary immunoprecipitation reagent to selectively pull down CTCF with a specific modification. | Most critical. Require ChIP-validated, modification-specific antibodies. |
| 3xFLAG Peptide | For gentle, non-denaturing elution in tandem IP protocols from FLAG-tagged protein fusions. | More specific and gentler than low-pH elution, preserving complexes for 2nd IP. |
| Next-Generation Sequencing Library Prep Kit (Ultra-Low Input) | Enables genome-wide mapping of binding sites from low-yield ChIP samples. | Essential for studying low-abundance PTMs. Look for kits designed for <1 ng DNA input. |
Technical Support Center: Troubleshooting NGS Data in CTCF-PTM Binding Studies
FAQs & Troubleshooting Guides
Q1: In our ChIP-seq experiment for a CTCF phospho-mutant cell line, we observe broad, low-amplitude peaks in the treatment sample not present in the wild-type control. Is this a biological effect or an artifact? A: This is commonly a technical artifact. Broad, low-amplitude peaks often indicate excessive sonication fragmentation or insufficient antibody specificity.
- Troubleshooting Steps:
- Verify Fragment Size: Re-run your pre-library preparation sample on a Bioanalyzer. The ideal fragment size for ChIP-seq is 150-300 bp. A smear below 100 bp suggests over-sonication.
- Check Antibody Specificity: Perform a western blot with your mutant lysate to confirm the ChIP-grade antibody still recognizes the mutant protein (though possibly at a different molecular weight). A loss of recognition may cause non-specific binding.
- Spike-in Control: In your next experiment, use a species-specific spike-in chromatin and antibody (e.g., Drosophila chromatin in human cells). This controls for technical variability in fragmentation and immunoprecipitation efficiency.
- Experimental Protocol for Sonication Optimization:
- Reagents: Cell lysate, Protease inhibitors, Covaris microTUBES.
- Method: Aliquot identical lysate samples. Subject to different sonication cycles (e.g., 4, 6, 8, 10 cycles) on a Covaris S220 with fixed settings (140W Peak Power, 5% Duty Factor, 200 cycles/burst). Analyze fragment size after each condition. Select the condition yielding the highest concentration of fragments in the 150-300 bp range.
Q2: Our data shows a global reduction in CTCF ChIP-seq signal after inducing acetylation-mimicking mutations. How do we rule out globally reduced protein expression or chromatin accessibility? A: A global shift requires controls for expression and open chromatin.
- Troubleshooting Steps & Controls:
- Quantitative Protein Level Check: Perform a quantitative Western blot (e.g., using LI-COR fluorescence) against CTCF and a histone loading control (e.g., H3) on input chromatin. Normalize CTCF signal to histone. A >20% reduction may explain global signal loss.
- Assay for Transposase-Accessible Chromatin (ATAC-seq) Control: Run ATAC-seq in parallel on wild-type and mutant cells. Global reductions in CTCF binding at regions with unchanged chromatin accessibility strongly suggest a functional, PTM-driven effect.
- Housekeeping Locus Analysis: Manually inspect read coverage at positive control loci (e.g., highly constitutive CTCF sites like the MYC super-enhancer). A proportional loss here supports a technical/expression issue.
Q3: We see "new" peaks appearing in our PTM-mutant ChIP-seq. Could this be due to differences in sequencing depth or alignment errors? A: Yes. Apparent "new" peaks are often due to differential depth or blacklisted regions.
- Troubleshooting Steps:
- Normalize Sequencing Depth: Use tools like
deepTools bamCoverageto generate BigWig files normalized to Reads Per Genome Coverage (RPGC). Compare these normalized tracks. - Apply Genomic Blacklist: Filter out peaks overlapping ENCODE blacklisted regions (known artifactual signals) using
bedtools intersect -v. - Set a Statistical Threshold: Identify peaks with MACS2 or SEACR. Only consider "new" peaks with a p-value/q-value < 1e-5 and that are at least 2kb from any peak in the control sample to avoid calling shifted peaks as novel.
- Normalize Sequencing Depth: Use tools like
Q4: During CUT&Tag for a specific CTCF modification, we get high background. What are the key fixes? A: High background in CUT&Tag is often due to incomplete washing or non-optimal antibody concentration.
- Experimental Protocol Optimization:
- Key Reagent: Digitonin Permeabilization Buffer. Concentration is critical; test range of 0.01%-0.05%.
- Wash Stringency: Increase the number of washes in Dig-wash buffer (e.g., from 3x to 5x) after primary/secondary antibody incubation. Ensure gentle but complete buffer exchange.
- Antibody Titration: Titrate the primary antibody. For a primary PTM-specific antibody, test concentrations from 1:50 to 1:500 dilution of stock in Antibody Buffer. Excessive antibody is a common cause of background.
Quantitative Data Summary: Common Artifacts vs. Biological Signals
| Observation | Suggests Artifact | Suggests Biological Signal | Diagnostic Experiment |
|---|---|---|---|
| Broad, low peaks | Over-sonication, poor antibody specificity. | True broadened binding (rare for CTCF). | Check fragment size distribution; use spike-in controls. |
| Global signal loss | Reduced protein expression, poor ChIP efficiency. | Global functional unfolding/chromatin change. | qWestern on input; ATAC-seq control. |
| Sporadic "new" peaks | Inadequate depth normalization, blacklisted regions. | Ectopic binding due to modified sequence affinity. | Apply blacklist filter; require statistical & distance thresholds. |
| High background (CUT&Tag) | Inadequate washing, high antibody conc. | N/A. | Titrate antibody; increase wash steps. |
| Peak splitting/shifting | Batch effect in sequencing, alignment bias. | Altered motif spacing or cooperative binding. | Biological replicate concordance; motif analysis shift. |
The Scientist's Toolkit: Key Research Reagent Solutions
| Reagent/Material | Function in CTCF-PTM NGS Studies |
|---|---|
| CUT&Tag Assay Kit (e.g., Hyperactive pA-Tn5) | Enables high-sensitivity, low-background mapping of protein-DNA interactions with minimal sequencing depth, ideal for PTM studies where sample may be limited. |
| ChIP-grade PTM-Specific Antibodies | Validated for chromatin immunoprecipitation; essential for specifically pulling down CTCF with a particular modification (e.g., acetylation-K374). |
| Spike-in Chromatin (e.g., D. melanogaster) | Provides an internal control for normalization, distinguishing technical variation (IP efficiency, fragmentation) from true biological change. |
| Magnetic Protein A/G Beads | For efficient immunoprecipitation with low non-specific binding; crucial for clean ChIP-seq and CUT&Tag protocols. |
| Covaris AFA Focused-ultrasonicator | Provides reproducible, controlled DNA shearing to the ideal 150-300 bp range, minimizing over-sonication artifacts. |
| High-Fidelity DNA Polymerase for Library Prep | Ensures accurate amplification of low-input ChIP/CUT&Tag DNA with minimal bias or duplicate reads. |
| Cell Permeabilization Buffer (Digitonin) | Critical for CUT&Tag; allows antibody entry while maintaining nuclear integrity. Concentration must be optimized. |
Visualization: Experimental Workflow for Signal vs. Noise Discrimination
Title: Decision Workflow: PTM Effect vs. Artifact
Visualization: Key Signaling Pathway in CTCF Regulation by PTMs
Title: PTM Alteration of CTCF Function Pathway
Technical Support Center: Troubleshooting CTCF-PTM Binding Experiments
This support center provides solutions for common experimental challenges when studying how cellular states (cell cycle, stress, differentiation) influence CTCF post-translational modifications (PTMs) and DNA binding.
FAQs & Troubleshooting Guides
Q1: Our ChIP-qPCR for CTCF shows inconsistent binding signals across cell cycle-synchronized samples. What could be the cause? A: This is often due to incomplete synchronization or PTM-sensitive antibody performance.
- Troubleshooting Steps:
- Verify Synchronization: Analyze cell cycle distribution using flow cytometry with propidium iodide (PI) staining for each synchronized sample. >90% of cells should be in the target phase.
- Check Antibody Specificity: The anti-CTCF antibody may recognize PTM-dependent epitopes. Use a pan-CTCF antibody validated for ChIP across cell cycles. Perform a western blot on synchronized cell lysates to confirm consistent total CTCF levels.
- Control Locus Selection: Ensure your qPCR primers target constitutive CTCF binding sites (e.g., MYC insulator) and a negative control region. Variable sites should not be used for normalization.
Q2: How do we specifically inhibit phosphorylation at a known CTCF site (e.g., S224) to test functional impact on binding during oxidative stress? A: Use a combination of genetic and pharmacological tools.
- Protocol:
- Stable Cell Line Generation: Use CRISPR-Cas9 to create a Serine-to-Alanine (S224A) mutation at the endogenous CTCF locus, creating a phosphorylation-deficient mutant.
- Acute Inhibition: Treat wild-type cells with a broad-spectrum kinase inhibitor (e.g., STO-609 for CaMKK, often upstream of stress-responsive kinases) prior to inducing oxidative stress (e.g., H₂O₂ treatment).
- Experimental Control: Include a Serine-to-Aspartate (S224D) mutant cell line as a phospho-mimetic control.
Q3: Our mass spectrometry data on CTCF PTMs is noisy during differentiation. How can we improve clean-up and enrichment? A: The key is rigorous pre-fractionation and PTM-specific enrichment.
- Optimized Protocol:
- Nuclear Extraction: Use high-stringency buffer (e.g., 20 mM HEPES, 1.5 mM MgCl₂, 0.42 M NaCl, 0.2 mM EDTA, 25% glycerol) to isolate nuclear proteins and reduce cytoplasmic contamination.
- Immunoprecipitation (IP): Perform a two-step IP. First, use a high-affinity anti-CTCF antibody (e.g., monoclonal) to isolate CTCF. Elute, then digest with trypsin.
- PTM Enrichment: Pass the peptide mixture through PTM-specific enrichment columns (e.g., TiO₂ for phosphorylation, antibody-conjugated beads for acetylation).
- LC-MS/MS: Use long gradients (120+ min) for better peptide separation.
Q4: We observe loss of CTCF insulator function in differentiated cells, but no change in total protein. Which PTMs should we prioritize checking? A: Poly(ADP-ribosylation) (PARylation) and phosphorylation are critical regulators during differentiation.
- Investigation Strategy:
- PARylation Assay: Perform a western blot with anti-PAR polymer antibody after pulling down CTCF from progenitor and differentiated cell states.
- Phospho-Proteomic Screen: Use a phospho-kinase array to identify globally active kinases in the differentiated state, then cross-reference with known CTCF phospho-sites.
- Functional Test: Treat differentiating cells with a PARP inhibitor (e.g., Olaparib, 10 µM) and assess insulator function via 3C-qPCR or reporter assay.
Table 1: Impact of Cellular State on Key CTCF PTMs and Binding Affinity
| Cellular State | Inducer/Model | Prevalent CTCF PTM | Change in Binding Affinity (K_d approx.) | Functional Outcome | Primary Assay |
|---|---|---|---|---|---|
| G1 Phase | Double Thymidine Block | Phosphorylation (S224, S365) | ↓ 2-3 fold vs Async | Looser chromatin association | ChIP-seq / EMSA |
| M Phase | Nocodazole / Mitotic Shake-off | Hyper-phosphorylation (multi-site) | ↓ >10 fold | Complete chromatin dissociation | Proximity Ligation |
| Oxidative Stress | H₂O₂ (0.5mM, 1hr) | PARylation & S324 Phosphorylation | ↓ 5-8 fold at specific loci | Loss of insulator function at stress-response genes | ChIP-qPCR |
| Serum Starvation | 0.1% FBS, 48hr | Deacetylation (K76, K77) | ↑ ~1.5 fold | Enhanced boundary strength | 4C-seq |
| Neuronal Diff. | RA/BDNF Induction | Phosphorylation (T374) & PARylation | Variable (site-specific) | Altered looping, gene re-wiring | Hi-C + ChIP |
Table 2: Reagents for Modulating and Detecting CTCF PTMs
| Reagent Name | Target/Type | Function in Experiment | Example Catalog # (Vendor) |
|---|---|---|---|
| STO-609 | CaMKK inhibitor | Inhibits stress-induced CTCF phosphorylation | 1983/10 (Tocris) |
| Olaparib (AZD2281) | PARP1/2 inhibitor | Blocks PARylation of CTCF | S1060 (Selleckchem) |
| Trichostatin A (TSA) | HDAC inhibitor | Increases global acetylation; tests CTCF acetylation role | T1952 (Sigma) |
| λ-Protein Phosphatase | Broad phosphatase | Removes phosphates from CTCF for control experiments | P0753S (NEB) |
| Anti-CTCF (pS224) | Phospho-specific antibody | Detects cell-cycle dependent phosphorylation | ab202964 (Abcam) |
| Anti-PAR Polymer | PARylation antibody | Detects PARylated CTCF in stress/differentiation | 4335-MC-100 (Trevigen) |
| Protein A/G Magnetic Beads | IP beads | For CTCF immunoprecipitation prior to MS | 88802/88803 (Pierce) |
| TiO₂ Mag Sepharose | Phosphopeptide enrichment | Enriches phospho-peptides for LC-MS/MS | 60111-1 (GL Sciences) |
Detailed Experimental Protocols
Protocol 1: Cell Cycle Synchronization & CTCF ChIP
- Synchronization (G1/S): Plate HeLa cells at 60% confluency. Treat with 2 mM thymidine for 19h. Release into fresh medium for 9h. Re-treat with 2 mM thymidine for 16h.
- Harvest: Release into complete medium and collect cells at 0h (G1/S), 3h (S), 6h (G2), and 9h (M, with nocodazole (100 ng/mL) added at 6h).
- Fixation: Cross-link with 1% formaldehyde for 10 min at RT. Quench with 125 mM glycine.
- ChIP: Lyse cells (SDS Lysis Buffer). Sonicate chromatin to ~500 bp fragments. Immunoprecipitate 100 µg chromatin with 5 µg anti-CTCF antibody (Cell Signaling, D31H2) overnight at 4°C.
- Analysis: Wash beads, reverse crosslinks, purify DNA. Analyze by qPCR at known binding sites.
Protocol 2: Assessing CTCF PARylation During Oxidative Stress
- Treatment: Treat U2OS cells with 0.5 mM H₂O₂ for 1 hour.
- Lysis & Pull-Down: Lyse cells in RIPA buffer supplemented with PARP inhibitor (PJ34, 10 µM) to prevent artifactal PARylation. Incubate 1 mg lysate with 2 µg anti-CTCF antibody for 2h at 4°C. Add Protein G beads for 1h.
- Detection: Wash beads 3x with lysis buffer. Elute proteins in 2X Laemmli buffer. Run SDS-PAGE.
- Western Blot: Transfer to PVDF membrane. Probe with anti-PAR polymer antibody (1:1000) to detect PARylated CTCF. Strip and re-probe with anti-CTCF for total protein.
Pathway & Workflow Visualizations
Title: Cellular State Impacts CTCF Function via PTMs
Title: Experimental Workflow for CTCF PTM-Binding Analysis
Best Practices for Experimental Replication and Statistical Rigor in Dynamic PTM Studies
Technical Support & Troubleshooting Center
Frequently Asked Questions (FAQs)
Q1: Our replicate experiments for CTCF phosphorylation-site mapping show high variability in peptide recovery. What could be the cause? A: This is often due to inconsistent cell lysis or incomplete phosphatase inhibition during sample preparation. Ensure fresh phosphatase/kinase inhibitors are added to the lysis buffer (e.g., 10 mM NaF, 1 mM Na3VO4, 5 mM β-glycerophosphate). Maintain samples on ice and process replicates in parallel using a standardized lysis protocol.
Q2: In ChIP-qPCR assays following CTCF mutagenesis, we get low signal-to-noise ratios. How can we improve this? A: Low signals can stem from suboptimal antibody affinity or chromatin over-fragmentation. Titrate your anti-CTCF antibody (e.g., Millipore 07-729) and verify shearing size (200-500 bp fragments) on an agarose gel for each replicate. Include a positive control genomic region and a negative control region (e.g., gene desert) in every qPCR run.
Q3: Statistical analysis of our PTM-affecting binding ELISA shows non-normal distribution. Which test should we use? A: For non-normal data from binding affinity measurements (e.g., KD values), use non-parametric tests. Apply the Mann-Whitney U test for comparing two groups or the Kruskal-Wallis test with Dunn’s post-hoc for multiple groups. Always perform a normality test (e.g., Shapiro-Wilk) first on replicate data (n≥5 per condition).
Q4: How many biological replicates are sufficient for a phospho-CTCF chromatin immunoprecipitation sequencing (ChIP-seq) experiment? A: For robust statistical power in differential binding analysis, a minimum of three independent biological replicates is mandatory. For publication in high-impact journals, four replicates are increasingly recommended to account for technical and biological variability in PTM studies.
Q5: Our western blot signals for acetylated CTCF are inconsistent across replicates. What are the key troubleshooting steps? A: Focus on protein transfer and antibody specificity. Use a reversible protein stain (e.g., Ponceau S) post-transfer to confirm even loading and complete transfer. Validate your acetylation-specific antibody with a deacetylase-treated control (e.g., incubation with HDAC3). Ensure all replicates use the same batch of ECL reagent and consistent exposure times.
Troubleshooting Guides
Issue: Poor Reproducibility in Co-Immunoprecipitation (Co-IP) for CTCF Interaction Partners Post-Phosphorylation.
- Step 1: Verify Antibody Crosslinking. For non-protein A/G binding antibodies, crosslink the antibody to the beads using DSS (Disuccinimidyl suberate) to reduce heavy/light chain interference in MS analysis.
- Step 2: Optimize Wash Stringency. Perform a wash stringency test. If background is high, increase salt concentration (e.g., 300-500 mM NaCl) or add 0.1% SDS to washes. If signal is lost, use milder washes (150 mM NaCl, no detergent).
- Step 3: Control for RNase Sensitivity. CTCF interactions can be RNA-mediated. Treat one replicate set with RNase A (100 µg/mL, 30 min at 25°C) and compare to untreated to identify RNA-bridged vs. direct interactions.
Issue: High False Discovery Rate (FDR) in Mass Spectrometry Analysis of CTCF PTMs.
- Step 1: Implement a Multi-Search Engine Strategy. Analyze raw MS/MS data with at least two search engines (e.g., Sequest HT and Mascot) and use consensus scoring via software like PeptideShaker to improve PTM site localization confidence.
- Step 2: Apply Strict Localization Filters. For PTM site assignment (e.g., phosphorylation on Ser/Thr), require a localization probability > 0.75 (e.g., from PTM RS in Proteome Discoverer) or an Ascore > 13 for all reported sites.
- Step 3: Use Stable Isotope Labeling. Incorporate SILAC (Stable Isotope Labeling by Amino acids in Cell culture) to distinguish true PTM changes from background variability in quantitative replicates.
Data Presentation
Table 1: Recommended Statistical Tests for Common Experimental Paradigms in Dynamic CTCF PTM Studies
| Experimental Goal | Data Type | Recommended Test | Minimum Replicates (Biological) | Key Assumption Checks |
|---|---|---|---|---|
| Compare CTCF binding affinity (KD) between two PTM states. | Continuous, ratio (KD values). | Mann-Whitney U test. | 5 independent measurements per state. | Independence, same shape distribution. |
| Compare ChIP-qPCR enrichment across multiple CTCF mutants. | Continuous, normalized fold change. | One-way ANOVA with Tukey's HSD. | 3 (4 recommended). | Normality (Shapiro-Wilk), homogeneity of variances (Levene's). |
| Assess correlation between PTM level (WB density) and binding (EMSA). | Two continuous variables. | Pearson or Spearman correlation. | 7+ paired data points. | Linear relationship & normality (Pearson) or monotonic (Spearman). |
| Identify differential ChIP-seq peaks in +/- PTM conditions. | Count data (reads). | DESeq2 or edgeR. | 3 (4 for high confidence). | Library size normalization, dispersion estimation. |
Table 2: Common Pitfalls and Corrective Actions for Experimental Replication
| Pitfall | Impact on Rigor | Corrective Action | Verification Method |
|---|---|---|---|
| "Pseudoreplication": Using technical replicates (same lysate) as biological replicates. | Inflates confidence, invalid statistics. | Design experiments with truly independent biological samples (different passages, different treatments). | Document passage numbers and culture dates. |
| Inadequate blinding during data acquisition/analysis. | Confirmation bias. | Implement blinding for image analysis, peak calling, and sample labeling during assays. | Use coded samples by a third party. |
| Batch effects in sample processing. | Introduces systematic error. | Process samples from all experimental groups in parallel and randomize order. | Use Principal Component Analysis (PCA) to check for batch clustering. |
| Underpowered statistical design. | High Type II error (false negatives). | Perform a priori power analysis (e.g., using G*Power) to determine sample size. | Report power (1-β) in methods. |
Experimental Protocols
Protocol 1: Quantitative Co-IP for Assessing PTM-Dependent CTCF Protein Interactions
- Cell Lysis: Lyse 10^7 cells (per replicate) in 1 mL IP lysis buffer (25 mM Tris pH 7.4, 150 mM NaCl, 1% NP-40, 1 mM EDTA, 5% glycerol) with fresh protease/phosphatase inhibitors. Rock at 4°C for 30 min. Centrifuge at 16,000×g for 15 min.
- Pre-clearing: Incubate supernatant with 20 μL protein A/G magnetic beads for 30 min at 4°C. Discard beads.
- Immunoprecipitation: Add 2-5 μg of PTM-specific CTCF antibody (or IgG control) to pre-cleared lysate. Incubate overnight at 4°C with rotation.
- Bead Capture: Add 40 μL pre-washed protein A/G beads for 2 hours at 4°C.
- Washing: Wash beads 4 times with 500 μL lysis buffer. Perform a final wash with 50 mM Tris pH 7.5.
- Elution: Elute proteins with 40 μL 2X Laemmli buffer at 95°C for 10 min. Analyze by western blot or MS.
Protocol 2: Electrophoretic Mobility Shift Assay (EMSA) for CTCF-DNA Binding with Phosphomimetic Mutants
- Probe Preparation: Label 5 pmol of double-stranded DNA containing a consensus CTCF binding site with [γ-32P] ATP using T4 Polynucleotide Kinase. Purify using a G-25 spin column.
- Protein Purification: Purify recombinant wild-type and phosphomimetic (S/D, T/E) CTCF zinc finger domain using a His-tag system.
- Binding Reaction: In a 20 μL volume, combine 1X binding buffer (10 mM Tris pH 7.5, 50 mM KCl, 1 mM DTT, 2.5% glycerol, 5 mM MgCl2), 1 μg poly(dI-dC), 1 nM labeled probe, and purified protein (0-200 nM range). Incubate 25 min at RT.
- Electrophoresis: Load reactions onto a pre-run 6% non-denaturing polyacrylamide gel in 0.5X TBE. Run at 100V for 60-90 min at 4°C.
- Detection: Dry gel and expose to a phosphorimager screen. Quantify band intensity (free vs. bound) for KD calculation using non-linear regression analysis across replicates.
Mandatory Visualization
Diagram: CTCF PTM Mechanism and Functional Impact Pathway
Diagram: Rigorous PTM Study Experimental Workflow
The Scientist's Toolkit: Research Reagent Solutions
| Reagent / Material | Function in CTCF PTM Studies | Example & Key Consideration |
|---|---|---|
| PTM-Specific Antibodies | Immunoprecipitation, western blot, ChIP to isolate or detect modified CTCF. | Anti-CTCF Phospho-Serine (e.g., custom from Abcam). Must be validated by peptide competition and genetic PTM modulation (KO/mutagenesis). |
| Phosphatase/Kinase Inhibitors | Preserve the endogenous PTM state during cell lysis and protein extraction. | Cocktail Set (NaF, β-glycerophosphate, Na3VO4). Use at recommended concentrations; Na3VO4 must be activated (heated to pH 10). |
| Phosphomimetic Mutants | To study the constitutive functional effect of a PTM (e.g., phosphorylation). | Serine-to-Aspartate (S>D), Threonine-to-Glutamate (T>E). Note: Imperfect mimic; always pair with phosphorylation-null mutant (S>A). |
| Stable Isotope Labeling | For accurate, multiplexed quantification of PTM dynamics by mass spectrometry. | SILAC Kits (Light/Heavy Lysine & Arginine). Require full incorporation (≥5 cell doublings); verify with MS scan. |
| Chromatin Shearing Enzymes | Generate consistent chromatin fragment sizes for ChIP assays. | Micrococcal Nuclease (MNase) or Focused-Ultrasonicator. MNase favors nucleosomal patterning; sonication is random. Standardize time/power across replicates. |
| Control Cell Lines | Essential controls for genetic perturbation studies of PTM enzymes. | CRISPR-generated PTM-enzyme KO lines or "dead" catalytic mutant lines. Use isogenic parental line as control to avoid genetic background effects. |
| Statistical Software Packages | To apply appropriate statistical tests and corrections. | R/Bioconductor (DESeq2, limma), GraphPad Prism. Use dedicated packages for high-throughput data (e.g., DESeq2 for ChIP-seq counts). |
Comparative Analysis of the CTCF 'PTM Code': Crosstalk, Functional Hierarchy, and Disease Implications
Technical Support Center
Troubleshooting Guide & FAQs
Q1: In my ChIP-qPCR experiment, I observe no signal for CTCF at a known binding site after inducing PARylation. What could be wrong? A1: This is the expected functional outcome if PARylation is successful, as it inhibits CTCF binding. However, to troubleshoot:
- Verify PARP activation: Confirm PARP1/2 enzyme activity with a positive control (e.g., a known PARP substrate or a PARP activator like H2O2 for DNA damage-induced PARylation).
- Check PARylation detection: Run a western blot for poly(ADP-ribose) (PAR) to ensure global PARylation is occurring. Use a PAR antibody (e.g., 10H) and compare treated vs. untreated lysates.
- Control for CTCF protein levels: Ensure CTCF protein abundance is not globally reduced by your treatment via a CTCF western blot on whole-cell extracts.
- ChIP protocol specificity: Confirm your ChIP protocol uses a validated CTCF antibody and efficient chromatin shearing (200-500 bp fragments).
Q2: When I treat cells with HDAC inhibitors to promote acetylation, my EMSA shows increased CTCF-DNA complex formation, but my live-cell imaging FRAP assay shows no change in residence time. How do I resolve this discrepancy? A2: This may not be a technical failure but a reflection of different assay sensitivities.
- EMSA Context: EMSA measures in vitro binding affinity using nuclear extracts. Increased acetylation may enhance the intrinsic DNA-binding capability of CTCF, leading to more complex formation.
- FRAP Context: FRAP measures in vivo residence time at chromatin, influenced by 3D genome architecture, competitor proteins, and other PTMs.
- Troubleshooting Action: Perform a complementary in vivo assay. Repeat the ChIP-qPCR experiment under HDAC inhibition at your target locus. An increase in ChIP signal would corroborate the EMSA data and suggest the FRAP result may be locus-specific or require longer observation times.
Q3: My attempt to mimic constitutive acetylation by mutating lysines to glutamine (K>Q) in CTCF expression constructs abolishes binding entirely in my luciferase reporter assay. What is the issue? A3: This is a common pitfall in PTM mimetic studies.
- Problem Identification: A glutamine (Q) mutation may not accurately mimic acetyl-lysine's neutral charge and steric properties in your specific protein context. It could misfold the protein or disrupt critical interactions.
- Recommended Solutions:
- Use a double mutant: Try a lysine to glutamine and arginine (K>Q/R) strategy to control for charge effects. Arginine (R) maintains a positive charge.
- Titrate the mimic: Co-transfect with different ratios of wild-type and mutant constructs to see if a dominant-negative effect is occurring.
- Alternative mimic: Consider using a lysine to methionine (K>M) mutation, reported in some studies to better mimic acetylation.
- Validate protein stability: Check mutant CTCF protein expression and nuclear localization by western blot and immunofluorescence to rule out degradation or mislocalization.
- Essential Protocol Steps:
- Use PARG Inhibitors: Include a potent PARG inhibitor (e.g., PDD00017273, DEA, or ADP-HPD) in your lysis and wash buffers to preserve PAR chains.
- Optimize Lysis Buffer: Use a denaturing or high-stringency RIPA buffer to halt enzymatic activity immediately. Include 1-10 µM PARG inhibitor and 1-10 µM PARP inhibitor to prevent dePARylation and new PARylation post-lysis.
- Benzoate Quenching: Pre-treat cells with sodium benzoate (a PARG inhibitor) before harvesting.
- Positive Control: Include a PARP-treated sample or cells treated with a DNA-damaging agent (e.g., H2O2) as a positive control for your PAR blot.
Experimental Protocols
Protocol 1: Assessing CTCF Binding Affinity via Electrophoretic Mobility Shift Assay (EMSA) with Recombinant Acetylated/ PARylated CTCF
- Protein Modification:
- Acetylation: Incubate purified recombinant CTCF (100 ng) with p300/CBP acetyltransferase (50-100 nM) in HAT buffer with Acetyl-CoA (50 µM) for 1h at 30°C.
- PARylation: Incubate purified recombinant CTCF (100 ng) with PARP1 enzyme (20 nM) and activated DNA (1 µg) in PARP buffer with NAD+ (500 µM) for 30 min at 25°C. Terminate with PARP inhibitor (e.g., 3-ABA).
- DNA Probe Preparation: Label a double-stranded DNA oligonucleotide containing a consensus CTCF binding site with [γ-32P] ATP using T4 Polynucleotide Kinase. Purify using a spin column.
- Binding Reaction: Mix modified/unmodified CTCF (5-20 nM) with labeled probe (0.1 nM) in binding buffer (10 mM Tris, 50 mM KCl, 5 mM MgCl2, 1 mM DTT, 0.05% NP-40, 10% glycerol, 1 µg poly(dI-dC)) for 20 min at RT.
- Electrophoresis: Load samples onto a pre-run 6% non-denaturing polyacrylamide gel in 0.5X TBE buffer. Run at 100V for 1-1.5h at 4°C.
- Analysis: Dry gel and expose to a phosphorimager screen. Quantify shifted vs. free probe bands.
Protocol 2: Chromatin Immunoprecipitation (ChIP-qPCR) to Evaluate In Vivo CTCF Binding Under PTM-Modulating Conditions
- Cell Treatment & Crosslinking: Treat cells (e.g., HeLa) with HDAC inhibitor (TSA, 500 nM, 12h) or PARP activator (H2O2, 200 µM, 15 min). Crosslink with 1% formaldehyde for 10 min at RT. Quench with 125 mM glycine.
- Cell Lysis & Sonication: Lyse cells in SDS lysis buffer. Sonicate chromatin to an average size of 200-500 bp. Confirm fragment size by agarose gel electrophoresis.
- Immunoprecipitation: Dilute chromatin in ChIP dilution buffer. Pre-clear with protein A/G beads. Incubate 5-10 µg chromatin with 2-5 µg of validated CTCF antibody or species-matched IgG overnight at 4°C with rotation. Capture immune complexes with beads.
- Washes & Elution: Wash beads sequentially with Low Salt, High Salt, LiCl, and TE buffers. Elute chromatin in freshly prepared elution buffer (1% SDS, 0.1M NaHCO3).
- Reverse Crosslinks & DNA Purification: Add NaCl to 200 mM and reverse crosslinks at 65°C overnight. Treat with RNase A and Proteinase K. Purify DNA using a spin column or phenol-chloroform extraction.
- qPCR Analysis: Perform qPCR on immunoprecipitated and input DNA using primers flanking the CTCF binding site of interest. Calculate % Input or Fold Enrichment over IgG.
Data Presentation
Table 1: Comparative Functional Outcomes of CTCF Acetylation vs. PARylation
| Parameter | Acetylation (e.g., by p300) | PARylation (e.g., by PARP1) |
|---|---|---|
| Primary Effect on CTCF | Neutralizes positive charge on Lysine residues. | Adds large, negatively charged PAR chains. |
| Impact on DNA Binding (EMSA) | ↑ Binding Affinity (Quantitative shift: e.g., Kd decreases from 15 nM to 8 nM). | ↓↓ Binding Affinity (Quantitative shift: e.g., Kd increases from 15 nM to >100 nM). |
| Impact on Chromatin Binding (ChIP-qPCR) | ↑ Enrichment (e.g., 2.5 to 4-fold increase in % input over control). | ↓ Enrichment (e.g., 70-90% reduction in % input over control). |
| Biological Consequence | Stabilizes chromatin loops, enhances insulator function. | Promotes CTCF eviction, facilitates chromatin remodeling during stress/DNA repair. |
| Key Regulatory Enzymes | Writers: p300/CBP; Erasers: HDACs (e.g., HDAC3). | Writers: PARP1/2; Erasers: PARG, ARH3. |
Visualizations
Title: CTCF PTM Regulation of DNA Binding
Title: Experimental Workflow for PTM-Binding Analysis
The Scientist's Toolkit: Research Reagent Solutions
Table 2: Essential Reagents for CTCF PTM & Binding Studies
| Item | Function & Application | Example/Note |
|---|---|---|
| p300/CBP HAT Domain (Recombinant) | Catalyzes in vitro acetylation of CTCF for EMSA or other biochemical assays. | Often used with Acetyl-CoA. Control with inactive mutant enzyme. |
| PARP1 Enzyme (Active, Recombinant) | Catalyzes in vitro PARylation of CTCF. Requires activated DNA and NAD+ as co-substrate. | Essential for demonstrating direct inhibitory effect on DNA binding. |
| HDAC Inhibitors (TSA, NaButyrate) | Increases global cellular acetylation levels to study enhanced CTCF binding in vivo. | Use in ChIP and cell-based assays. Titrate to avoid pleiotropic effects. |
| PARP Inhibitors (Olaparib, PJ34) | Inhibits PARP activity, used to establish baseline CTCF binding in PARP-active contexts. | Critical control in DNA damage experiments. |
| PARG Inhibitors (PDD00017273, DEA) | Stabilizes PAR chains by inhibiting degradation. Crucial for detecting PARylated proteins in IP/western. | Must be added fresh to lysis and assay buffers. |
| Anti-PAR Antibody (10H clone) | Gold standard for detecting poly(ADP-ribose) chains in western blot, immunofluorescence, or ChIP. | Monoclonal antibody with high specificity for PAR polymers. |
| Validated CTCF ChIP-Grade Antibody | For chromatin immunoprecipitation. Must be validated for specificity and efficiency in ChIP. | Critical for accurate in vivo binding measurements. |
| Consensus CTCF DNA Probe | Double-stranded oligonucleotide containing a high-affinity CTCF binding site for EMSA. | Used as a positive control and for quantitative affinity measurements. |
| PARylated/ Acetylated Lysine Mimetic Mutants | CTCF expression plasmids with lysine-to-glutamine (K>Q, acetylation mimic) or other mutations. | For studying constitutive PTM-like states; requires careful validation. |
Technical Support & Troubleshooting Center
This center addresses common experimental challenges in studying PTM crosstalk on CTCF. Always consult your specific reagent manuals and institutional safety protocols.
FAQ & Troubleshooting Guide
Q1: In our Co-IP experiments to study CTCF phosphorylation-SUMOylation crosstalk, we get high non-specific background. What could be the cause and solution? A: This is often due to antibody cross-reactivity or insufficiently stringent wash conditions.
- Troubleshooting Steps:
- Validate Antibodies: Perform a western blot with whole cell lysate to confirm primary antibody specificity for CTCF.
- Optimize Lysis/Wash Buffer: Increase salt concentration (NaCl to 300-500 mM) or add mild detergents (e.g., 0.1% Triton X-100) to your wash buffer to reduce non-specific binding. Ensure you are using fresh protease/phosphatase/SUMOylation inhibitors.
- Use Control Beads: Include a control with beads conjugated to a non-specific IgG from the same host species.
- Pre-clear Lysate: Incubate your cell lysate with bare beads for 30 minutes before adding antibody-conjugated beads.
Q2: When attempting to map SUMOylation sites on CTCF after phospho-priming, our mass spectrometry data is inconclusive for modified peptides. How can we improve enrichment? A: PTM peptides are low-abundance and may be suppressed during MS analysis.
- Troubleshooting Steps:
- Enrichment Strategy: Use sequential enrichment. First, immunoprecipitate CTCF. Then, digest the purified protein and use TiO2 columns to enrich for phosphorylated peptides or use antibodies specific for SUMOylated peptides (e.g., SUMO remnant motifs) for a second enrichment step.
- Chemical Derivatization: Use isobaric tags (TMT/iTRAQ) or dimethyl labeling to improve quantification and identification.
- Optimize Digestion: Try different enzymes (e.g., Glu-C alongside trypsin) to generate alternative peptides that might better retain the PTMs for MS detection.
Q3: Our mutagenesis experiments (e.g., S-to-A or S-to-D mutants) to mimic/un-mimic phosphorylation show unexpected CTCF localization or expression levels. A: The mutation might affect protein stability or introduce unintended structural changes.
- Troubleshooting Steps:
- Check Protein Stability: Perform a cycloheximide chase assay to compare the half-life of your mutant vs. wild-type CTCF.
- Verify Nuclear Integrity: Ensure the mutation is not causing gross protein misfolding and cytoplasmic aggregation. Use a nuclear marker (e.g., Lamin B1) for co-staining.
- Consider Neighboring Sites: The mutated serine/threonine might be part of a larger modification cluster. Review literature for nearby PTM sites that might be affected.
Q4: In our ChIP-qPCR experiments, we observe no change in CTCF binding at a target locus despite inducing phosphorylation. What are possible reasons? A: The effect of a single PTM on binding may be context-dependent or require a combination of modifications.
- Troubleshooting Steps:
- Confirm Functional Modification: Use a Phos-tag gel to confirm a mobility shift in CTCF, proving the phosphorylation event occurred globally.
- Check Locus Specificity: Test multiple CTCF binding sites (insulator, promoter-proximal) as the effect may be locus-specific.
- Investigate Crosstalk: The phosphorylation might only alter binding when a second PTM (e.g., SUMOylation) is also present. Consider co-expressing the modifying enzymes or probing for the second PTM at the locus.
Q5: How can we reliably distinguish between sequential, cooperative, and competitive PTM crosstalk on CTCF experimentally? A: A multi-pronged approach using defined mutants and timed perturbations is required.
- Experimental Protocol Outline:
- Establish the Baseline: Use LC-MS/MS to map PTM sites on endogenous CTCF under steady-state conditions.
- Kinetic Activation: Stimulate the upstream kinase pathway (e.g., with a specific agonist or inhibitor) and collect time-course samples (e.g., 0, 5, 15, 30, 60 min).
- Analyze Dependency: For each time point, perform:
- Western Blot: Probe for p-CTCF, SUMO-CTCF, ac-CTCF, etc.
- Co-IP/MS: Immunoprecipitate one PTM (e.g., SUMO) and probe/sequence for others (e.g., phosphorylation).
- Mutant Validation: Express CTCF mutants (phospho-dead, SUMOylation-dead) and repeat step 3. Loss of a downstream modification in the phospho-dead mutant supports a sequential priming mechanism.
Key Experimental Protocols
Protocol 1: Sequential Immunoprecipitation (IP) for Analyzing PTM Dependency
- Purpose: To determine if CTCF phosphorylation is required for its subsequent SUMOylation.
- Method:
- Transfert HEK293T cells with FLAG-CTCF (wild-type and S-to-A mutant) and HA-SUMO1.
- At 48h post-transfection, treat cells with kinase activator (e.g., 100 nM PMA for PKC) or DMSO control for 30 min.
- Lyse cells in RIPA buffer supplemented with 20 mM N-Ethylmaleimide (NEM), 1x phosphatase inhibitors, and 1x protease inhibitors.
- First IP: Incubate lysate with anti-FLAG M2 affinity gel for 2h at 4°C. Elute FLAG-CTCF with 3xFLAG peptide.
- Second IP: Take a portion of the eluate and incubate with anti-HA agarose beads overnight at 4°C.
- Wash beads, elute with SDS sample buffer, and analyze by western blot using anti-phospho-Ser (CTCF specific) and anti-HA antibodies.
Protocol 2: Proximity Ligation Assay (PLA) for Visualizing PTM Crosstalk at Specific Genomic Loci
- Purpose: To detect co-occurrence of two different PTMs (e.g., phosphorylation and SUMOylation) on CTCF at a single nuclear focus.
- Method:
- Culture and treat cells on chamber slides. Perform standard immunofluorescence fixation and permeabilization.
- Block and incubate with primary antibodies from two different species (e.g., rabbit anti-pS-CTCF and mouse anti-SUMO1).
- Use a commercial PLA kit (e.g., Duolink). Add PLUS and MINUS secondary antibodies conjugated to oligonucleotides.
- Add ligation solution to join oligonucleotides if the two primary antibodies are in close proximity (<40 nm).
- Add amplification solution with fluorescently labeled nucleotides and polymerase to create a rolling circle amplification product.
- Mount and visualize via fluorescence microscopy. Each red dot represents a single event where CTCF is both phosphorylated and SUMOylated.
Table 1: Common CTCF PTMs and Their Proposed Functional Consequences
| PTM Type | Residue Examples | Modifying Enzyme | Proposed Functional Impact on CTCF |
|---|---|---|---|
| Phosphorylation | Serine 224, 365 | PKC, CK2 | Primes for SUMOylation, alters DNA binding affinity. |
| SUMOylation | Lysine 74, 689 | PIAS family SUMO ligases | Regulates insulator activity, promotes co-factor recruitment. |
| Poly(ADP-ribosyl)ation | Not fully mapped | PARP1 | Inhibits CTCF binding, involved in chromatin decompaction. |
| Acetylation | Lysine 77, 337 | p300/CBP | Can antagonize SUMOylation, may affect protein stability. |
Table 2: Troubleshooting Common Assay Failures
| Assay | Symptom | Likely Cause | Solution |
|---|---|---|---|
| ChIP-qPCR | High signal in IgG control | Non-specific antibody or fragmented chromatin | Optimize sonication to get 200-500 bp fragments. Titrate antibody; use a validated ChIP-grade antibody. |
| Co-IP / Western | Target protein not detected in IP eluate | Lysis buffer too harsh/gentle, epitope masked | Test lysis buffers of varying stringency. Include brief sonication post-lysis. |
| MS PTM Mapping | Low sequence coverage | Incomplete digestion or PTM loss during prep | Use multiple proteases. Avoid acidic conditions for SUMOylated/phosphorylated samples. |
Visualizations
Diagram Title: Sequential PTM Pathway: Phosphorylation Primes CTCF for SUMOylation
Diagram Title: Competitive PTM Crosstalk on CTCF: Acetylation vs. SUMOylation
Diagram Title: Experimental Workflow to Validate Sequential PTM Priming
The Scientist's Toolkit: Essential Research Reagents
| Reagent / Material | Function & Purpose in CTCF PTM Studies |
|---|---|
| N-Ethylmaleimide (NEM) | Irreversible cysteine protease inhibitor that blocks deSUMOylation enzymes (SENPs), critical for preserving SUMOylation in lysates. |
| Phos-tag Acrylamide | Acrylamide-bound Zn2+ complex that retards phosphorylated proteins in gels, allowing detection of phosphorylation-induced mobility shifts of CTCF. |
| Protease/Phosphatase Inhibitor Cocktails | Essential to preserve the native PTM state of CTCF during cell lysis and protein purification. Must be added fresh. |
| Site-Directed Mutagenesis Kit | To generate phospho-mimetic (S/D) and phospho-dead (S/A) or SUMO-dead (K/R) CTCF mutants for functional dependency studies. |
| Polyclonal/Monoclonal Anti-CTCF Antibodies (ChIP-grade) | For immunoprecipitation and chromatin immunoprecipitation. Specificity and lot consistency are paramount. |
| SUMOylation Modification Panels | Commercial kits containing SUMO1/2/3, SENP inhibitors, and expression vectors to manipulate the SUMOylation system. |
| Isobaric Mass Tag Kits (TMT/iTRAQ) | Enable multiplexed, quantitative comparison of PTM levels on CTCF across multiple conditions in a single MS run. |
| Duolink Proximity Ligation Assay Kits | For in situ visualization of two PTMs or protein-PTM interactions on CTCF at single-molecule resolution within the nucleus. |
Troubleshooting Guides & FAQs
FAQ 1: I am performing CUT&RUN for CTCF on neuronal tissue samples. My yield is very low and I get non-specific bands. What could be the issue?
Answer: Low yield from neuronal or brain tissue is common due to high lipid content and chromatin compaction. Non-specific bands often indicate incomplete digestion or antibody cross-reactivity.
- Solution: Increase the concentration of digitonin in your permeabilization buffer (e.g., from 0.01% to 0.05%) to improve nuclear access. Perform a titration of MNase concentration and digestion time. Always include an IgG control and validate your anti-CTCF antibody for CUT&RUN via a western blot from the same sample. Pre-clearing with Protein A/G beads can reduce non-specific binding.
FAQ 2: My mass spectrometry data for CTCF PTMs from cancer cell lines is inconsistent between replicates. How can I improve reproducibility?
Answer: Inconsistent PTM identification often stems from incomplete or variable digestion, sample loss during enrichment, or insufficient chromatographic separation.
- Solution:
- Standardize Digestion: Use a standardized protocol with a proven enzyme like trypsin/Lys-C mix and quantify peptide yield post-digestion.
- Robust Enrichment: For phospho-CTCF, use TiO2 or IMAC enrichment with proper loading and washing buffers (containing lactic acid or glycolic acid). For acetyl-CTCF, immunoaffinity purification with anti-acetyl-lysine antibodies is preferred.
- Spike-in Controls: Use stable isotope-labeled synthetic phospho/acetyl peptides corresponding to known CTCF modification sites as internal controls for normalization and recovery tracking.
FAQ 3: I am analyzing ChIP-seq peaks from publicly available datasets for CTCF in glioblastoma vs. normal brain. The peak calls are highly variable. How should I process the data for a fair comparison?
Answer: Variability arises from differences in sequencing depth, antibody batches, and peak-calling algorithms.
- Solution: Re-process all raw FASTQ files through a unified pipeline. Use a standardized peak caller (e.g., MACS2) with identical parameters (q-value cutoff, shift size). Normalize read counts using a method like DESeq2 or edgeR that accounts for library size differences. Always compare against input controls from the same study. Use a consensus peak set derived from all samples for final comparative analysis.
FAQ 4: My in vitro binding assay (EMSA) shows that phospho-mimetic CTCF zinc finger (ZF) mutants still bind the consensus sequence. Does this mean the PTM is irrelevant?
Answer: Not necessarily. EMSA tests binding under ideal, short-sequence conditions.
- Solution: The PTM may affect binding in the context of nucleosomes or methylated DNA. Move to a more physiological assay like a nucleosome occupancy and methylome sequencing (NOMe-seq) assay with recombinant PTM-CTCF, or a competitive binding assay with multiple, closely spaced DNA motifs to test for affinity and cooperativity differences.
FAQ 5: When modeling disease-specific PTM landscapes, what are the best computational tools to predict functional impact?
Answer: Use a combination of tools that assess different properties.
- Solution: See the table below for a curated list.
Table 1: Computational Tools for PTM-CTCF Impact Prediction
| Tool Name | Primary Function | Application to CTCF Research | Key Output |
|---|---|---|---|
| NetPhos | Predicts kinase-specific phosphorylation sites | Identifies potential novel phospho-sites altered in disease | Score & predicted kinase |
| MusiteDeep | Deep learning-based general PTM prediction | High-throughput discovery of cancer vs. neurological disorder PTM hotspots | Probability score |
| I-Mutant2.0 | Predicts protein stability change upon mutation | Assess impact of phospho-mimetic (S/D) or loss (S/A) mutations on CTCF stability | DDG (kcal/mol) |
| DNABind | Predicts DNA-binding propensity | Estimates how a PTM at a specific residue might alter DNA affinity | Binding propensity score change |
Experimental Protocols
Protocol 1: CTCF Post-Translational Modification Enrichment for Mass Spectrometry
Title: Sequential Immunoprecipitation for PTM-Specific CTCF Proteomics
Principle: This protocol enriches for endogenous CTCF and its modified forms from nuclear extracts prior to LC-MS/MS, increasing the depth of PTM coverage.
Materials: Cell line or flash-frozen tissue, Nuclear Extraction Kit (e.g., NE-PER), Anti-CTCF Antibody (for IP), Protein A/G Magnetic Beads, Crosslinker (DSS or BS3), Urea Lysis Buffer, Anti-Pan-Acetyl Lysine or Anti-Phospho-Ser/Thr Antibody (optional), Trypsin/Lys-C mix.
Procedure:
- Crosslinking: Harvest ~50 million cells or 100mg tissue. Perform mild crosslinking with 1mM DSS for 20 min at RT to preserve transient PTM-protein interactions. Quench with 100mM Tris-HCl (pH 7.5).
- Nuclear Extraction: Isolate nuclei using a detergent-based kit. Confirm integrity via microscopy or histone western blot.
- Primary IP (CTCF): Incubate nuclear lysate with 5µg anti-CTCF antibody overnight at 4°C. Capture with pre-washed magnetic beads for 2 hours.
- Elution & Secondary IP (Optional): Elute bound complexes using low-pH glycine buffer (pH 2.5) and immediately neutralize. For further enrichment of specific PTMs, use the eluate for a second IP with PTM-specific antibodies (e.g., anti-acetyl-lysine).
- On-Bead Digestion: Wash beads thoroughly and denature with 2M urea. Reduce with DTT, alkylate with IAA, and digest with Trypsin/Lys-C mix overnight at 37°C.
- LC-MS/MS Analysis: Desalt peptides and analyze by high-resolution tandem mass spectrometry. Search data against human proteome databases with PTM (phospho, acetyl, SUMO) as variable modifications.
Protocol 2: Differential CTCF Binding Analysis via CUT&Tag in Patient-Derived Cells
Title: High-Resolution CTCF Binding Profiling in Low-Input Samples
Principle: CUT&Tag (Cleavage Under Targets and Tagmentation) uses a protein A-Tn5 fusion to tagment DNA around an antibody target, ideal for profiling CTCF binding in rare patient cells.
Materials: Patient-derived glioblastoma stem cells or induced neurons (~50k cells), Concanavalin A-coated beads, Anti-CTCF antibody (validated for CUT&Tag), Protein A-Tn5 fusion protein, Digitonin-based wash and tagmentation buffers, MgCl2, EDTA.
Procedure:
- Cell Binding: Harvest and wash cells. Bind to Concanavalin A beads to immobilize.
- Permeabilization & Antibody Incubation: Permeabilize with Digitonin buffer. Incubate with primary anti-CTCF antibody (1:50 dilution) in antibody buffer overnight at 4°C.
- Secondary Binding: Wash and incubate with secondary antibody (if needed) or directly with Protein A-Tn5 adapter complex for 1 hour at RT.
- Tagmentation: Wash unbound Tn5. Induce tagmentation by adding MgCl2 to a final 10mM and incubating at 37°C for 1 hour. Stop reaction with EDTA, Proteinase K, and SDS.
- Library Preparation: Extract DNA directly from the supernatant. Amplify with indexed primers for 12-15 cycles. Size-select and sequence on an Illumina platform.
- Bioinformatic Analysis: Align reads, call peaks (MACS2), and perform differential binding analysis (DiffBind) against a matched input or IgG control.
Visualizations
Diagram Title: Disease-Specific Signaling to PTM-CTCF Landscapes
Diagram Title: Integrated PTM-CTCF Discovery & Validation Workflow
The Scientist's Toolkit: Research Reagent Solutions
Table 2: Essential Reagents for PTM-CTCF Research
| Item/Category | Specific Product Example (Research-Use) | Function in PTM-CTCF Research |
|---|---|---|
| Validated CTCF Antibodies | Active Motif, #61311 (ChIP-seq grade) | Gold-standard for chromatin immunoprecipitation and CUT&Tag to map genome-wide binding. |
| PTM-Specific Antibodies | Cell Signaling, #2515 (Acetyl-Lysine); Abcam, ab9332 (Phospho-Ser/Thr) | Enrichment and detection of modified CTCF forms via IP, western blot, or immunofluorescence. |
| Protein A-Tn5 Fusion | Pa-TnB, #50150 (Vazyme) | Essential enzyme for CUT&Tag assays, enabling high-sensitivity binding profiling in low-input samples. |
| Tagmentase Buffer | 10x TAPS-PEG Buffer, #50151 (Vazyme) | Optimized buffer for Protein A-Tn5 activity, critical for efficient and controlled tagmentation. |
| Magnetic Beads | Dynabeads Protein A/G (Invitrogen) | Universal solid support for immunoprecipitation, ensuring low non-specific binding and high recovery. |
| Mass Spec Grade Enzymes | Trypsin/Lys-C Mix, #V5071 (Promega) | Provides highly specific and complete digestion of CTCF for bottom-up proteomics and PTM mapping. |
| PTM Enrichment Kits | TiO2 Phosphopeptide Enrichment Kit (Thermo) | Selective enrichment of phosphopeptides from complex CTCF digests prior to LC-MS/MS analysis. |
| Next-Gen Sequencing Kit | Illumina DNA Prep (Illumina) | Robust library preparation from ChIP-seq or CUT&Tag DNA fragments for sequencing. |
FAQ & Troubleshooting Guide
Q1: In our ChIP-qPCR experiments using a hepatic cell line (HepG2), we are seeing inconsistent recovery of CTCF at known binding sites after treatment with a phosphorylation-modulating inhibitor. What could be the cause?
A: Inconsistent ChIP recovery following kinase/phosphatase inhibition is a common challenge. This often points to dynamic PTM changes altering antibody affinity or chromatin accessibility.
Primary Troubleshooting Steps:
- Antibody Validation: The anti-CTCF antibody may have epitope sensitivity to specific phospho-states. Verify using a PTM-insensitive positive control antibody (e.g., against an adjacent tag if using tagged-CTCF) in a parallel ChIP.
- Chromatin Integrity: Re-check sonication efficiency post-treatment. Some inhibitors affect nuclear metabolism, altering chromatin fragility. Monitor fragment size (200-500 bp) on a gel.
- Direct Binding Assessment: Perform an orthogonal EMSA (Electrophoretic Mobility Shift Assay) with nuclear extracts and a probe from your target site. Shifts in mobility upon treatment can confirm PTM-mediated binding changes independent of chromatin.
Recommended Experimental Protocol: EMSA for CTCF-DNA Binding.
- Prepare nuclear extracts from treated/untreated cells using a low-stringency buffer (e.g., 10 mM HEPES, 1.5 mM MgCl2, 10 mM KCl, 0.5 mM DTT, protease/phosphatase inhibitors).
- Label a 30-40 bp dsDNA probe containing the core CTCF motif. Use IRDye 800 or Cy5 for near-infrared fluorescence detection.
- Binding Reaction: Incubate 5 µg extract with 20 fmol probe, 1 µg poly(dI:dC), in binding buffer (10 mM Tris, 50 mM KCl, 1 mM DTT, 5% glycerol, 0.1% NP-40) for 20 min at RT.
- Electrophoresis: Run on a pre-chilled 6% non-denaturing polyacrylamide gel in 0.5x TBE at 100V for 60-90 min.
- Image using an Odyssey or Typhoon scanner. A "supershift" with an added phospho-specific CTCF antibody can confirm the PTM involved.
Q2: We observe a conserved CTCF phospho-site in mouse and human primary T-cells, but mutating this site in a mouse model does not recapitulate the immune dysregulation seen in primary cell assays. How should we interpret this?
A: Discrepancies between primary cell in vitro data and whole-animal models are frequent and highlight system complexity.
- Key Considerations & Solutions:
- Compensation In Vivo: The intact animal may have compensatory mechanisms (e.g., upregulation of a cofactor or redundant enhancer) masking the phenotype.
- Cell-Type Specificity: The PTM's function may be critical only in a specific T-cell subset or activation state not predominant in your model.
- Action Plan:
- Single-Cell Analysis: Perform scATAC-seq or scRNA-seq on splenocytes from your mutant mouse. This can identify specific subpopulations with altered chromatin or gene expression.
- Contextual Challenge: Subject mice to an immune challenge (e.g., L. monocytogenes infection) to reveal conditional phenotypes.
- Cross-system Validation: Use primary human T-cells in a CRISPR/dCas9-mediator system to recruit a localized kinase or phosphatase to the target locus, mimicking or erasing the PTM, and measure transcriptional output.
Q3: When comparing CTCF PARylation levels between a commonly used cancer cell line (HEK293T) and primary neurons via Western blot, we get weak signals. What optimization is needed?
A: PARylation is transient and rapidly degraded by PAR glycolydrolase (PARG). Standard lysis buffers are insufficient.
- Optimized Protocol for PARylated CTCF Detection.
- Lysis Buffer (Ice-cold, prepare fresh):
- 50 mM Tris-HCl (pH 8.0), 150 mM NaCl, 1% NP-40, 0.5% Sodium Deoxycholate, 0.1% SDS.
- Critical Additives: 10 mM Nicotinamide (PARP inhibitor), 2 μM PARG Inhibitor (PDD00017273), 10 μM ADP-HPD (alternative PARGi), 1X Protease/Phosphatase inhibitors, 1 μM PARP1/2 inhibitor (Olaparib) optional.
- Cell Collection: Aspirate media, quickly rinse with PBS containing above inhibitors, and add lysis buffer directly to the plate/dish on ice. Scrape and transfer.
- Sonication: Sonicate lysates briefly (3 x 5 sec pulses, 30% amplitude) to shear DNA and release chromatin-bound proteins. Keep samples on ice.
- Immunoprecipitation: Pre-clear lysate. Use 2-5 μg of anti-CTCF antibody for IP overnight at 4°C. Use mouse or rabbit IgG as a stringent control.
- Detection: Run IP eluates on 3-8% Tris-Acetate gel for better high-MW separation. Use anti-PAR antibody (10H) for blotting. Re-probe for total CTCF.
- Lysis Buffer (Ice-cold, prepare fresh):
Quantitative Data Summary: Model System Comparison for CTCF PTM Studies
Table 1: Characteristics of Common Model Systems for Studying CTCF PTMs
| Model System | Typical Use Case | PTM Conservation* (vs. Human Primary) | Genetic Manipulability | Throughput | Key Limitation |
|---|---|---|---|---|---|
| Immortalized Cell Lines (e.g., HEK293, HeLa) | High-throughput screening, mechanistic biochemistry | Moderate (60-80%) | High (transfection, CRISPR) | High | Altered metabolism, atypical karyotype, PTM enzyme dysregulation. |
| Primary Cells (e.g., PBMCs, fibroblasts) | Physiology, donor variation, clinically relevant contexts | High (95-100%) | Low (limited division, hard to transfect) | Low | Finite lifespan, donor-to-donor variability. |
| Mouse Models (Knock-in, conditional) | Organismal physiology, development, systems-level integration | High at motif, variable at flanking sequences | Medium (requires generation of transgenic line) | Low | Cost, time, potential compensation. |
| Organoids | Tissue-specific architecture, multi-lineage interactions | Emerging data, appears high | Medium (CRISPR possible) | Medium | Immaturity, lack of full systemic context. |
*Representative estimates based on published phospho-proteomic and acetylation-proteomic comparisons. Conservation varies by specific PTM.
The Scientist's Toolkit: Key Research Reagent Solutions
Table 2: Essential Reagents for CTCF PTM Functional Studies
| Reagent / Material | Function / Application | Example (Supplier Agnostic) |
|---|---|---|
| PTM-Specific CTCF Antibodies | Detection and enrichment of specific modified CTCF forms (e.g., pSer, AcLys). Critical for ChIP, WB. | Anti-CTCF [pS224], Anti-CTCF [AcK74]. |
| PTM-Inhibitor/Activator Chemicals | Pharmacologically modulate enzyme activity to test PTM function (acute treatment). | PARPi (Olaparib), HDACi (TSA), Kinase Inhibitors (CK2i). |
| dCas9-Epigenetic Effectors | Targeted PTM manipulation at specific loci using CRISPR/dCas9 fusions. | dCas9-p300 (for acetylation), dCas9-TET1 (for demethylation). |
| Crosslinkers (Reversible) | For capturing transient PTM-dependent protein-protein interactions. | DSP (Dithiobis(succinimidyl propionate)) - cleavable by DTT. |
| Protease/Phosphatase Inhibitor Cocktails | Preserve the native PTM state during protein extraction. Essential for lysis buffers. | Commercial cocktails including PARG and PARP inhibitors for PAR studies. |
| Biotinylated DNA Oligos with CTCF Motif | For in vitro pull-down assays to test PTM effect on DNA binding affinity. | 5'-biotin-(T-repeat spacer)-CCGCGNGGNGGNGGNGGC-3'. |
| Tag-Specific Beads (e.g., Anti-FLAG, Strep-Tactin) | For gentle, high-specificity purification of tagged CTCF variants for downstream MS analysis. | Anti-FLAG M2 Magnetic Beads, Strep-Tactin XT Superflow. |
Visualizations
Title: Troubleshooting Workflow for Inconsistent CTCF ChIP-qPCR Results
Title: CTCF PTMs Regulate DNA Binding and Chromatin Outcomes
Technical Support Center: Troubleshooting CTCF PTM & Druggability Assays
FAQ & Troubleshooting Guide
Q1: In our AlphaScreen assay assessing small-molecule inhibition of a CTCF acetyltransferase, we observe high background signal in the negative control (no enzyme). What are the primary causes and solutions?
A: High background in AlphaScreen often stems from compound interference or contaminating proteins.
- Cause 1: Compound fluorescence/quenching. Test compounds at working concentration in buffer alone.
- Solution: Pre-incubate beads with compound before adding biotinylated/6xHis-tagged substrate. Use a centrifugal filter plate to separate compound from product if interference is confirmed.
- Cause 2: Non-specific binding of substrate to beads.
- Solution: Increase concentration of blocking agent (e.g., BSA to 0.1%) in assay buffer. Titrate substrate to determine minimal working concentration.
- Protocol: Dilute Streptavidin Donor and Nickel Chelate Acceptor beads in assay buffer. Pre-incubate test compound with enzyme for 15 min. Add substrate (biotinylated histone peptide) and ATP to initiate reaction. After incubation, add beads, incubate in dark for 1 hr, and read on a compatible plate reader.
Q2: When performing CETSA to evaluate target engagement of a putative CTCF methyltransferase inhibitor, the melting curve shift is inconsistent across biological replicates. What key parameters should be optimized?
A: Inconsistent CETSA results typically relate to cell handling or lysis conditions.
- Cause 1: Variable cell number or viability prior to heating.
- Solution: Use a precise cell counter and normalize all samples to the same cell density. Ensure >95% viability.
- Cause 2: Incomplete or inconsistent lysis after heating.
- Solution: Standardize lysis buffer volume, composition (e.g., 1% NP-40, protease inhibitors), and mixing vigor. Perform lysis on ice for a fixed duration (e.g., 30 min) with periodic vortexing.
- Protocol: Plate cells in 96-well format. Treat with compound/DMSO. Heat wells at gradient temperatures (e.g., 37°C–67°C) for 3 min in a thermal cycler. Lyse cells, freeze-thaw, then centrifuge. Analyze soluble fraction for CTCF via Western blot. Quantify band intensity and plot relative soluble protein vs. temperature.
Q3: Our FP assay for a reader domain inhibitor shows a poor signal window (low mP change upon tracer binding). How can we improve it?
A: A low FP signal window indicates suboptimal tracer or protein conditions.
- Cause 1: Tracer affinity is too low or concentration is inappropriate.
- Solution: Titrate fluorescent tracer (e.g., fluorescein-labeled methylated peptide) against a fixed protein concentration to find the Kd. Use tracer concentration near the Kd for competition assays.
- Cause 2: Protein activity or purity is low.
- Solution: Use fresh, aliquoted protein. Check activity with a positive control inhibitor. Consider using a tagged protein purified via affinity chromatography immediately before assay.
- Protocol: Prepare assay buffer with low auto-fluorescence. In a black plate, mix protein, tracer, and serially diluted compound. Incubate for equilibrium (30-60 min). Read polarization (mP) values. Calculate % inhibition using controls (DMSO = 0% inhibition, unlabeled competitor peptide = 100% inhibition).
Q4: During the development of a cellular thermal shift assay for CTCF itself (as a downstream validation), we cannot detect CTCF by Western blot after heating. What might be wrong?
A: This suggests protein degradation or insufficient transfer/detection.
- Cause 1: CTCF is aggregating and pelleting during centrifugation.
- Solution: Reduce centrifugation speed after lysis (e.g., 12,000g to 10,000g). Include 0.4% CHAPS in lysis buffer to aid solubility of aggregates.
- Cause 2: Antibody fails under heated sample conditions.
- Solution: Include a positive control (unheated lysate) on every gel. Validate antibody for recognition of potentially denatured CTCF. Consider using a different antibody clone.
- Protocol: Follow standard CETSA protocol for live cells. Use RIPA lysis buffer supplemented with 0.4% CHAPS. For Western, use a 6% Tris-Glycine gel for better high molecular weight separation. Transfer at 300 mA for 2.5 hrs at 4°C. Block with 5% non-fat milk.
Table 1: Key CTCF PTM "Writers/Erasers" and Representative Inhibitor Data
| Enzyme Target (PTM Type) | Known Role in CTCF Regulation | Representative Inhibitor (Tool Compound) | Reported IC50 / Kd (nM) | Cellular Assay Readout (e.g., pIC50) | Key Limitation (as of 2023) |
|---|---|---|---|---|---|
| p300/CBP (Acetylation) | Acetylates CTCF; modulates insulator activity & enhancer-promoter looping. | A-485 | 10 (p300) / 2500 (CBP) | Reduction in H3K27ac at CTCF sites (~100 nM) | Limited selectivity between p300/CBP; cellular toxicity. |
| PCAF/GCN5 (Acetylation) | Acetylates CTCF; affects apoptosis gene expression. | CPTH2 (tool) | ~40,000 (GCN5) | Modest reduction in CTCF acetylation (µM range) | Low potency; off-target effects. |
| EZH2 (Methylation) | PRC2 subunit; H3K27me3 deposition can exclude CTCF. | Tazemetostat (FDA-approved) | 11 (EZH2) | Global H3K27me3 reduction (nM range) | Indirect effect on CTCF; context-dependent. |
| DNMT1 (DNA Methylation) | Methylates CpGs in CTCF binding motif, disrupting binding. | Azacitidine (FDA-approved) | Incorporated into DNA | CpG island hypomethylation (µM range) | Genome-wide effects; not CTCF-specific. |
| HDAC1/2 (Deacetylation) | Deacetylates CTCF; promotes chromatin compaction. | Romidepsin (FDA-approved) | 36 (HDAC1) | Increased histone acetylation (low nM) | Pan-HDAC inhibitor; severe side effects. |
| LSD1/KDM1A (Demethylation) | Demethylates H3K4me1/2; can antagonize CTCF looping. | GSK2879552 | <20 (LSD1) | H3K4me2 accumulation (nM range) | Limited efficacy in solid tumors; toxicity. |
Table 2: Common In Vitro Assay Platforms for Druggability Assessment
| Assay Type | Target Class | Throughput | Cost | Key Advantage for CTCF PTMs | Key Disadvantage |
|---|---|---|---|---|---|
| Time-Resolved FRET (TR-FRET) | Writers, Erasers, Readers | High | Medium | Homogeneous; low background; suitable for reader domains. | Requires specific tagged reagents. |
| AlphaScreen/AlphaLISA | Writers, Erasers | High | Medium-High | Ultra-sensitive; no wash steps. | Sensitive to light, chemical interference. |
| Fluorescence Polarization (FP) | Readers, some Erasers | High | Low | Simple, homogeneous, kinetic capable. | Limited by tracer molecular weight. |
| Microscale Thermophoresis (MST) | All | Low | Medium | Label-free or mild labeling; uses native protein. | Low throughput; sensitive to buffer conditions. |
| Cellular Thermal Shift Assay (CETSA) | All (cellular context) | Medium | Low-Medium | Confirms cellular target engagement. | Semi-quantitative; depends on antibody quality. |
Experimental Protocols
Protocol 1: TR-FRET Assay for CTCF Acetyltransferase (p300) Inhibitor Screening
- Reagents: Recombinant p300 catalytic domain, biotinylated histone H3 peptide (1-21), acetyl-CoA, anti-acetyllysine Eu³⁺-cryptate antibody, Streptavidin-XL665, test compounds.
- Buffer: 50 mM HEPES pH 8.0, 0.01% BSA, 0.05% Tween-20, 1 mM DTT.
- In a low-volume 384-well plate, dispense 2 µL of compound in buffer.
- Add 4 µL of enzyme/substrate mix (2.5 nM p300, 75 nM biotin-H3 peptide).
- Start reaction by adding 4 µL of acetyl-CoA (final 1 µM).
- Incubate for 60 min at room temperature.
- Stop reaction by adding 10 µL of detection mix (2 nM anti-AcK antibody, 20 nM Streptavidin-XL665).
- Incubate for 30 min in dark.
- Read FRET signal on compatible plate reader (excitation: 337 nm, emission: 665 nm & 620 nm). Calculate ratio (665/620)*10⁴.
Protocol 2: Cellular Thermal Shift Assay (CETSA) for Target Engagement
- Cell Culture: Harvest adherent cells (e.g., HeLa) during log growth.
- Treatment: Incubate cells with inhibitor or DMSO for desired time (e.g., 2-4 hrs).
- Heating: Aliquot cell suspension (~1-2 million cells/tube) and heat at discrete temperatures (e.g., 37, 40, 43, 46, 49, 52, 55, 58, 61, 64°C) for 3 min.
- Lysis: Immediately freeze samples in liquid N₂ for 1 min, then thaw on ice. Lyse with ice-cold buffer (e.g., PBS + 0.4% CHAPS + protease inhibitors) for 30 min on ice with vortexing.
- Separation: Centrifuge at 20,000g for 20 min at 4°C.
- Analysis: Transfer supernatant to new tube. Analyze by SDS-PAGE and Western blot for CTCF. Quantify bands and plot soluble fraction vs. temperature to derive ∆Tm.
Diagrams
Diagram Title: CTCF PTM Impact on DNA Binding and Oncogenesis
Diagram Title: PTM Enzyme Druggability Assessment Pipeline
The Scientist's Toolkit: Research Reagent Solutions
Table 3: Essential Reagents for CTCF PTM & Druggability Research
| Item | Function/Application | Example (Non-endorsing) |
|---|---|---|
| Recombinant PTM Enzymes | Catalytic domains for in vitro inhibitor screening assays. | Active p300 (400-658), EZH2/SUZ12/ED complex, LSD1. |
| CTCF Protein (Full-length) | For binding studies (EMSA, FP) to test PTM effects. | Recombinant human CTCF (full-length, His-tagged). |
| PTM-Specific CTCF Antibodies | Detect acetylated, methylated, or phosphorylated CTCF in ChIP, IP, WB. | Anti-CTSF (acK77), Anti-CTCF (phospho-S224). |
| Biotinylated Histone/Oligo Substrates | For bead-based assays (AlphaScreen) or pull-downs. | Biotin-H3K4me0 peptide, Biotinylated CTCF consensus DNA motif. |
| TR-FRET/FP Compatible Tracers | Labeled peptides or nucleotides for homogeneous binding assays. | Fluorescein-labeled H3K4me2 peptide (for LSD1 assays). |
| Cell-Permeable Tool Compounds | Positive/Negative controls for cellular assays. | A-485 (p300i), CPI-455 (KDM5i), GSK343 (EZH2i). |
| ChIP-Validated qPCR Primers | Quantify CTCF occupancy at specific loci (e.g., MYC insulator). | Primers for CTCF site at MYC super-enhancer, H19 ICR. |
| Mammalian Two-Hybrid System | Study PTM-dependent protein-protein interactions (CTCF-cofactor). | CheckMate/Flexi Vector systems with CTCF fusion constructs. |
| Live-Cell Imaging Dyes | Assess chromatin structure/compaction changes upon treatment. | Hoechst 33342, SiR-DNA dye. |
Conclusion
The investigation of CTCF post-translational modifications reveals a sophisticated and dynamic regulatory layer essential for its genome-organizing function. From foundational mechanisms to advanced methodologies, it is clear that a complex 'PTM code'—governed by phosphorylation, acetylation, PARylation, and other modifications—orchestrates CTCF's DNA binding affinity, insulation strength, and loop formation. The comparative analysis underscores that PTM crosstalk creates a functional hierarchy, with specific modifications acting as context-dependent switches in health and disease. For biomedical and clinical research, this knowledge opens promising avenues: targeting the enzymes that write or erase these marks presents a novel therapeutic strategy for cancers and diseases driven by 3D genome misfolding. Future directions must focus on developing higher-resolution, single-cell PTM mapping technologies, creating comprehensive atlases across tissues and disease states, and functionally validating candidate PTM sites in vivo to translate this fundamental understanding into precise epigenetic therapies.