Technical Validation of Epigenetic Biomarkers: A Comprehensive Guide for Research and Clinical Translation
This article provides a comprehensive guide to the technical validation of epigenetic biomarkers, tailored for researchers, scientists, and drug development professionals.
Technical Validation of Epigenetic Biomarkers: A Comprehensive Guide for Research and Clinical Translation
Abstract
This article provides a comprehensive guide to the technical validation of epigenetic biomarkers, tailored for researchers, scientists, and drug development professionals. It covers the foundational biology of DNA methylation, histone modifications, and non-coding RNAs, exploring their discovery as potential biomarkers. Methodologically, it details best practices for assay design, platform selection (bisulfite sequencing, arrays, qPCR), and sample processing. A dedicated troubleshooting section addresses common challenges in pre-analytics, data normalization, and batch effect correction. Finally, the guide outlines rigorous analytical and clinical validation frameworks, comparing regulatory standards from CLSI, FDA, and EMA to ensure biomarkers are fit-for-purpose in diagnostics, prognostics, and therapeutic monitoring. The synthesis offers a clear pathway from discovery to clinically actionable tools.
The Epigenetic Landscape: Discovering Biomarkers in DNA Methylation, Histones, and Beyond
Technical Support Center for Epigenetic Biomarker Validation
Welcome to the Technical Support Center. This resource, framed within the broader thesis on the technical validation of epigenetic biomarkers, provides troubleshooting guides and FAQs for common experimental challenges in analyzing DNA methylation, histone modifications, and non-coding RNAs.
Troubleshooting Guides & FAQs
Section 1: DNA Methylation Analysis (Bisulfite Conversion & qPCR)
Q1: My bisulfite-converted DNA has extremely low yield or is degraded. What went wrong?
- A: This is a common issue. Primary causes and solutions include:
- Incomplete Desulfonation: Residual bisulfite salts can degrade DNA during storage. Ensure thorough desulfonation and multiple ethanol washes.
- Over-conversion (Degradation): Excessive incubation time, temperature, or pH during conversion fragments DNA. Precisely follow kit protocols and use a dedicated thermal cycler, not a water bath.
- Solution: Always use a DNA integrity check (e.g., Bioanalyzer) post-conversion and include a control locus known to be unmethylated in your subsequent PCR to assess conversion efficiency.
- A: This is a common issue. Primary causes and solutions include:
Q2: My Methylation-Specific PCR (MSP) or qMSP shows amplification in the negative control (no template or unconverted DNA).
- A: This indicates primer/probe failure or incomplete bisulfite conversion.
- Step 1: Verify bisulfite conversion efficiency by designing primers for a fully unmethylated control sequence. If it amplifies, conversion was incomplete.
- Step 2: Re-optimize primer annealing temperatures. Bisulfite-converted DNA has reduced sequence complexity, requiring stringent, often higher, Tm.
- Step 3: Ensure primers for the methylated reaction are specific to CpG-dense regions and that the 3' end terminates at a CpG site to maximize specificity.
- A: This indicates primer/probe failure or incomplete bisulfite conversion.
Section 2: Histone Modification Analysis (ChIP-seq)
Q3: My Chromatin Immunoprecipitation (ChIP) yields very low DNA amount for sequencing/library prep.
- A: Low yield stems from inefficient chromatin preparation or immunoprecipitation.
- Fix 1: Chromatin Fragmentation: Optimize sonication conditions. Use a Covaris or Bioruptor for consistent shear. Check fragment size (200-600 bp) on an agarose gel after decrosslinking. Over-sonication damages epitopes; under-sonication reduces resolution.
- Fix 2: Antibody Validation: Use ChIP-validated antibodies only. Titrate the antibody amount using a positive control locus (e.g., H3K4me3 at active gene promoters) and a negative control region.
- Fix 3: Wash Stringency: High background can dilute signal. Increase salt concentration in wash buffers gradually (e.g., 150 mM to 500 mM NaCl) to reduce non-specific binding.
- A: Low yield stems from inefficient chromatin preparation or immunoprecipitation.
Q4: My ChIP-seq data has high background/noise.
- A: This complicates peak calling.
- Use an appropriate input DNA control (sheared, non-immunoprecipitated chromatin) for background subtraction.
- Employ a mismatch antibody (e.g., normal Rabbit IgG) as a negative IP control to establish baseline.
- In analysis, apply statistical peak callers (e.g., MACS2) with a stringent false discovery rate (FDR < 0.01).
- A: This complicates peak calling.
Section 3: Non-Coding RNA Analysis (qRT-PCR & Sequencing)
Q5: I cannot consistently detect low-abundance circulating miRNAs in plasma/serum.
- A: This is an extraction and normalization challenge.
- Consistent Extraction: Use a spike-in control (e.g., synthetic C. elegans miR-39, cel-miR-39) added at the beginning of RNA isolation to correct for extraction efficiency and inhibit PCR inhibitors.
- Normalization: Do not use a single small RNA (e.g., U6 snRNA) for circulating miRNA normalization. Use the global mean normalization of detected miRNAs or a combination of stable spike-ins.
- Inhibition: Dilute your RNA template 1:5 or 1:10 to dilute potential PCR inhibitors co-purified from biofluids.
- A: This is an extraction and normalization challenge.
Q6: My RNA-seq library prep for small RNAs is biased towards certain miRNA sequences.
- A: Ligation bias during adapter attachment is a known issue.
- Use adapter modifications (e.g., randomized nucleotides at ligation ends) to reduce sequence-specific bias.
- Employ library prep kits specifically designed to minimize ligation bias.
- Consider unique molecular identifiers (UMIs) to correct for PCR duplication biases that amplify initial ligation bias.
- A: Ligation bias during adapter attachment is a known issue.
Data Presentation: Common Epigenetic Biomarker Validation Metrics
Table 1: Technical Validation Parameters for Epigenetic Assays
| Assay | Key Metric | Target Threshold | Common Challenge |
|---|---|---|---|
| qMSP | Conversion Efficiency | >99% | Incomplete conversion leads to false positives. |
| ChIP-qPCR | % Input / Fold Enrichment | >2% Input or >10-fold over IgG | High background from non-specific antibody binding. |
| miRNA qRT-PCR | Spike-in Recovery (Cq Value) | CV < 0.5 between samples | Variable extraction efficiency from biofluids. |
| Bisulfite Sequencing | Coverage Depth | >30x per CpG site | PCR bias from bisulfite-converted templates. |
| ChIP-seq | FRiP (Fraction of Reads in Peaks) | >1% for broad marks, >5% for sharp marks | Low signal-to-noise ratio. |
Experimental Protocols
Protocol 1: High-Resolution Methylation Analysis via Bisulfite Sequencing
- Input: 500 ng high-quality genomic DNA.
- Bisulfite Conversion: Use the EZ DNA Methylation-Lightning Kit (Zymo Research). Incubate at 98°C for 8 minutes, 54°C for 60 minutes. Hold at 4°C.
- Desulfonation: Bind to provided spin column, desulfonate with desulfonation buffer for 20 minutes at room temperature. Wash twice, elute in 20 µL.
- Library Prep & Sequencing: Use a dedicated bisulfite-seq kit (e.g., Accel-NGS Methyl-Seq). Amplify with limited cycles. Sequence on an Illumina platform to achieve minimum 30x coverage.
Protocol 2: Chromatin Immunoprecipitation (ChIP) for Histone Modifications
- Crosslinking: Treat cells with 1% formaldehyde for 10 min at room temp. Quench with 125 mM glycine.
- Chromatin Prep: Lyse cells. Sonicate to achieve 200-600 bp fragments (verify via gel).
- Immunoprecipitation: Pre-clear lysate with protein A/G beads. Incubate 5-10 µg chromatin with 1-5 µg validated antibody overnight at 4°C. Capture with beads, wash with low-salt, high-salt, and LiCl buffers.
- Elution & Decrosslinking: Elute in Chelex-100 slurry or elution buffer, then decrosslink at 65°C overnight (if not using Chelex).
- DNA Purification: Purify DNA (Qiagen MinElute) for qPCR or library prep.
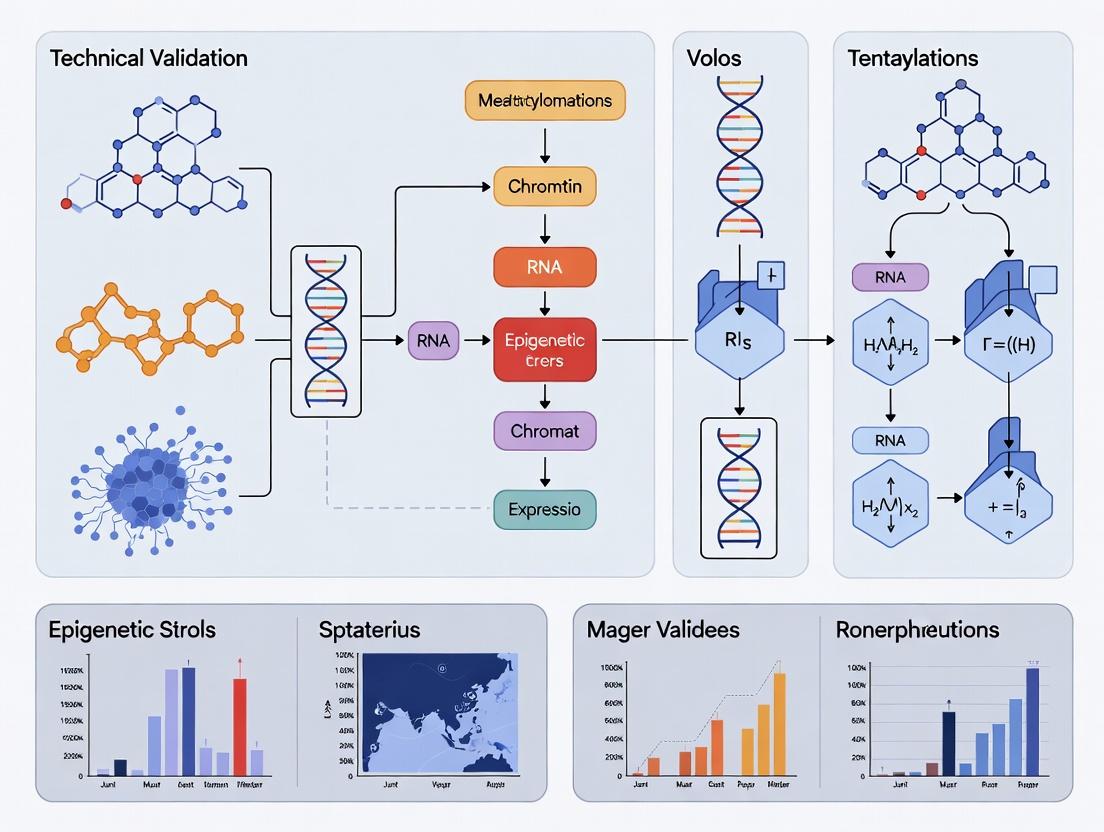
Pathway & Workflow Visualizations
Title: Core Epigenetic Biomarker Analysis Workflow
Title: Epigenetic Mechanisms Regulating Gene Expression
The Scientist's Toolkit: Key Research Reagent Solutions
| Reagent / Kit | Primary Function | Key Consideration for Biomarker Work |
|---|---|---|
| Zymo EZ DNA Methylation-Lightning Kit | Rapid bisulfite conversion of DNA. | Speed reduces DNA degradation; critical for low-input clinical samples. |
| Magna ChIP Kit (MilliporeSigma) | Complete solution for Chromatin IP. | Includes validated control antibodies and beads; ensures reproducibility. |
| miRNeasy Serum/Plasma Kit (Qiagen) | Isolation of total RNA, including small RNAs, from biofluids. | Incorporates carrier RNA and spike-in controls for consistent recovery. |
| TaqMan Advanced miRNA Assays (Thermo Fisher) | Specific detection and quantification of mature miRNAs. | Uses stem-loop RT for superior specificity over SYBR Green. |
| NEBNext Ultra II DNA Library Prep Kit | High-efficiency library construction for NGS. | Compatible with bisulfite-converted DNA and ChIP DNA; low input requirements. |
| CUT&Tag Assay Kits | Low-background, high-signal alternative to ChIP for histone marks. | Requires far fewer cells (~60k), ideal for precious clinical samples. |
| Methylated & Unmethylated Human Control DNA | Positive controls for bisulfite-based assays. | Essential for validating conversion efficiency and assay specificity. |
Technical Support Center
Welcome to the Epigenetic Biomarker Validation Support Center. This resource addresses common technical challenges encountered in research comparing and validating tissue-specific epigenetic marks against genomic mutations.
Troubleshooting Guides & FAQs
Q1: In our bisulfite sequencing experiment for detecting tissue-specific DNA methylation, we are observing consistently low conversion efficiency (<95%). What are the primary causes and solutions?
- A: Low bisulfite conversion efficiency compromises data accuracy by mimicking incomplete methylation. Key troubleshooting steps include:
- DNA Quality: Verify input DNA is high-purity (A260/A280 ~1.8-2.0) and not degraded. Use fresh aliquots of bisulfite reagent.
- Denaturation: Ensure complete denaturation of DNA to single strands prior to bisulfite treatment. Increase incubation time at high temperature (e.g., 98°C for 10 min) and use a thermal cycler with a heated lid.
- Reaction Conditions: Protect the reaction from light. Desulfonation steps must be performed with fresh ethanol-diluted reagents. After conversion, elute DNA in a low-EDTA buffer or water (pH >7.5) to prevent inhibition of downstream PCR.
- Control: Always run a non-CpG methylation control (e.g., Lambda phage DNA) to quantify the conversion rate.
Q2: When performing ChIP-seq for histone modifications from specific tissues, we get high background noise. How can we improve specificity?
- A: High background often stems from non-specific antibody binding or chromatin preparation issues.
- Antibody Validation: Use only antibodies with validated ChIP-grade specificity (check databases like www.abcam.com/primaryantibodies). Include a positive control (a cell line with known mark) and a negative control (IgG).
- Chromatin Shearing: Optimize sonication or enzymatic shearing to achieve a majority of fragments between 200-500 bp. Over-shearing can increase background. Always check fragment size on a gel after decrosslinking.
- Wash Stringency: Increase salt concentration in wash buffers stepwise. Perform more washes, and consider adding a final wash with high-salt detergent buffer.
- Blocking: Use excess sonicated salmon sperm DNA or BSA in binding and wash buffers to block non-specific sites.
Q3: Why do DNA methylation levels measured by pyrosequencing and next-generation sequencing (NGS) from the same tissue sample show discrepancies?
- A: Discrepancies typically arise from methodological biases and data processing.
- PCR Bias: Bisulfite-PCR prior to pyrosequencing can introduce amplification bias. Use polymerase enzymes validated for bisulfite-converted DNA and minimize PCR cycles.
- Primer Design: Ensure both assays interrogate identical CpG sites. Even a 1-base shift can yield different results due to local methylation heterogeneity.
- Coverage Depth: NGS data with low coverage (<30x) may not accurately reflect the average methylation level. Filter low-coverage positions.
- Data Normalization: Verify the normalization methods. Pyrosequencing software provides a direct percentage, while NGS pipelines require stringent alignment (e.g., via Bismark) and calculation metrics (e.g., beta-value).
Q4: How can we technically validate that an observed epigenetic mark is stable and tissue-specific, rather than a transient response to environmental factors?
- A: This requires a multi-pronged experimental validation protocol.
- Longitudinal Sampling: Collect matched tissue samples from the same donor or model organism at multiple time points (e.g., weeks or months apart). Stability is indicated by low intra-individual variation over time.
- Ex Vivo Challenge: Culture primary cells from the tissue of interest under different physiological stimuli (e.g., hypoxia, cytokine exposure). A stable mark will resist change compared to known dynamic marks (e.g., H3K27ac).
- Cross-Platform Concordance: Confirm the finding using two orthogonal techniques (e.g., Whole Genome Bisulfite Sequencing and Methylation-Sensitive Restriction Enzyme PCR).
- In Silico Validation: Use public epigenomic atlases (e.g., ENCODE, Roadmap Epigenomics) to confirm tissue-specificity patterns across hundreds of samples.
Table 1: Comparative Features for Biomarker Development
| Feature | Epigenetic Marks (e.g., DNA Methylation) | Genomic Mutations (e.g., SNP, Indel) |
|---|---|---|
| Tissue-Specificity | High (Cell-type specific patterns) | Low (Typically identical across all somatic cells) |
| Temporal Stability | Mitotically heritable, medium-term stable | Permanent, lifelong |
| Reversibility | Yes (Dynamic, can be modulated) | No (Fixed in DNA sequence) |
| Analytical Sensitivity | High (Detect small changes in population) | High (Detect rare clones) |
| Sample Source Flexibility | High (Cell-free DNA, fixed tissue) | Medium-High (Requires genomic DNA) |
| Influence from Environment | High (Potentially confounding) | Low (Generally independent) |
Table 2: Common Assay Performance Metrics for Validation
| Assay | Typical Input | Resolution | Key Quantitative Metric | Best for Validating |
|---|---|---|---|---|
| EPIC Array | 250 ng DNA | 850K CpG sites | Beta-value (0-1) | Genome-wide methylation patterns |
| Targeted Bisulfite Seq | 50-100 ng DNA | Single CpG | % Methylation / Read Depth | Specific loci, low-input samples |
| Pyrosequencing | 20-50 ng DNA | 5-10 CpGs per amplicon | % Methylation per CpG | Absolute quantification of known sites |
| ChIP-seq | 1-10 μg chromatin | 200-500 bp fragments | Peak Enrichment (Fold-change) | Histone modifications, TF binding |
Experimental Protocol: Validating Tissue-Specificity and Stability of a DMR
Title: Differential Methylation Analysis and Stability Testing Protocol
Objective: To identify and validate a Differentially Methylated Region (DMR) between two tissues and assess its stability over time.
Materials:
- Matched tissue samples (e.g., colon epithelium vs. peripheral blood) from multiple donors.
- Longitudinal samples (if available).
- QIAamp DNA Mini Kit (or equivalent).
- EZ DNA Methylation-Lightning Kit.
- Primer sets for candidate DMR and control genes.
- PyroMark PCR Master Mix.
- Pyrosequencing system (e.g., Qiagen PyroMark Q48).
Methodology:
- Discovery Phase: Perform genome-wide methylation profiling (e.g., EPIC array) on DNA from 10+ matched tissue pairs. Identify top candidate DMRs with >20% mean methylation difference (Δβ) and statistically significant p-value (<0.01, adjusted).
- Technical Validation by Pyrosequencing:
- Bisulfite Conversion: Treat 500 ng of each original DNA sample using the Lightning Kit.
- PCR Amplification: Design pyrosequencing assays for the candidate DMR. Amplify bisulfite-converted DNA.
- Sequencing & Quantification: Run pyrosequencing. Calculate mean % methylation for each CpG site within the DMR across all samples.
- Concordance Check: Confirm correlation (R² > 0.85) between array β-values and pyrosequencing % methylation.
- Stability Testing: Analyze longitudinal samples (e.g., collected at T=0 and T=12 months) from the same donors using the validated pyrosequencing assay. Calculate the intra-individual coefficient of variation (CV). A stable mark will have a low CV (<5-10%).
Visualizations
Diagram Title: DMR Validation and Stability Workflow
Diagram Title: Key Feature Comparison Schematic
The Scientist's Toolkit: Research Reagent Solutions
Table 3: Essential Reagents for Epigenetic Biomarker Validation
| Item | Function in Validation | Example Product/Type |
|---|---|---|
| Bisulfite Conversion Kit | Chemically converts unmethylated cytosines to uracils, enabling methylation detection. | EZ DNA Methylation-Lightning Kit, MethylCode Kit |
| ChIP-Grade Antibody | Specifically immunoprecipitates chromatin complexes containing the target histone mark or protein. | Anti-H3K4me3, Anti-H3K27ac (validated for ChIP-seq) |
| Polymerase for Bisulfite-PCR | Amplifies bisulfite-converted DNA with high fidelity and minimal sequence bias. | ZymoTaq DNA Polymerase, EpiMark Hot Start Taq |
| Methylated & Unmethylated Control DNA | Serves as positive/negative controls for bisulfite conversion and methylation assays. | CpGenome Universal Methylated DNA, Human WGA DNA |
| Pyrosequencing Assay & Reagents | Provides quantitative, base-resolution methylation data for targeted loci. | PyroMark CpG Assays, PyroMark Gold Q96 Reagents |
| DNA Shearing Reagent | Fragments chromatin or DNA to optimal size for NGS library preparation. | Covaris ultrasonicator, MNase for ChIP, Fragmentase |
| Methylation-Sensitive Restriction Enzymes (MSRE) | Orthogonal method to cut unmethylated DNA at specific CpG sites for validation. | HpaII (sensitive), MspI (insensitive control) |
Troubleshooting & Technical Support Center
This guide addresses common issues encountered during GWAS and EWAS workflows, with a focus on technical validation for epigenetic biomarker research.
FAQs & Troubleshooting Guides
Q1: Our EWAS identifies significant differentially methylated positions (DMPs), but validation by pyrosequencing or bisulfite cloning fails. What are the primary technical culprits?
- A: This is a core validation challenge. Primary causes include:
- Bisulfite Conversion Inefficiency: Incomplete conversion of unmethylated cytosines leads to false positive methylation calls. Use spike-in controls (e.g., unconverted lambda DNA) and verify conversion efficiency >99%.
- Probe/ Primer Specificity: Infinium array probes or qPCR primers may align to multiple genomic regions or contain SNPs. Always re-evaluate in silico specificity for your sample's genome and design bisulfite-specific primers for validation.
- Cell Type Heterogeneity: DMPs may reflect shifts in cell population proportions rather than true epigenetic changes within a cell type. Always measure or statistically adjust for cell composition using reference-based (e.g., Houseman method) or reference-free approaches.
- DNA Quality: Degraded DNA or residual contaminants from extraction can bias both array and sequencing results. Check DNA integrity (RIN >7) and purity (A260/280 ~1.8).
Q2: How do we handle batch effects in large-scale EWAS meta-analyses, and what are the best normalization methods for Infinium MethylationEPIC v2.0 arrays?
- A: Batch effects are the most significant technical confounder.
- Prevention: Randomize sample plating by phenotype. Use technical replicates across batches.
- Correction: Apply robust preprocessing pipelines. The current best practice is:
- Background Correction & Normalization: Use
noob(normal-exponential out-of-band) ordasenwithin theminfiorwateRmelonR packages. - Batch Effect Adjustment: After normalization, use
ComBat(fromsvapackage) orRemoveBatchEffect(limma) on the M-values, using known batch variables. Always check PCA plots pre- and post-correction.
- Background Correction & Normalization: Use
- Validation: Ensure your significant hits (
p < 1x10^-7) are not associated with batch or plate number.
Q3: What are the critical positive and negative controls for a ChIP-seq experiment validating GWAS-nominated transcriptional regulators?
- A:
- Positive Control Antibody: Always run a ChIP with an antibody against a well-characterized histone mark (e.g., H3K4me3 for active promoters, H3K27ac for active enhancers) known to be present in your cell type.
- IgG Control: Use a non-specific, species-matched IgG to establish the baseline noise level. Enrichment over IgG is essential.
- Input DNA Control: Sequence non-immunoprecipitated, sheared DNA from the same sample. This controls for genomic copy number and open chromatin bias.
- Positive Genomic Region Control: Include a qPCR assay for a genomic region known to be bound by your target in your cell type.
- Negative Genomic Region Control: Include a qPCR assay for a region known not to be bound (e.g., gene desert).
Q4: Our GWAS-to-function pipeline is stalled; how do we prioritize genetic variants for functional epigenetic follow-up?
- A: Use a systematic, tiered approach as outlined below.
Prioritization Table for GWAS Variants
| Priority Tier | Criteria | Tool/Data Source | Validation Strength |
|---|---|---|---|
| Tier 1 (High) | Colocalizes with meQTL/eQTL (PP >0.8); Linked to promoter via Hi-C | GTEx, eGTEx, Blueprint; 4D Nucleome, Promoter Capture Hi-C | Strong in silico evidence for regulatory function. |
| Tier 2 (Medium) | Overlaps enhancer (H3K27ac) in relevant cell type; Disrupts transcription factor binding motif. | ENCODE, Roadmap Epigenomics; JASPAR, HOCOMOCO | Supports regulatory potential. Requires functional testing. |
| Tier 3 (Experimental) | Alters reporter gene expression in MPRA; CRISPR modulation affects phenotype/gene expression. | Custom MPRA library; CRISPR screening | Direct experimental evidence of variant function. |
Detailed Experimental Protocols
Protocol 1: Validation of EWAS Hits via Pyrosequencing
- Principle: Quantitative analysis of DNA methylation at single-nucleotide resolution following bisulfite conversion.
- Steps:
- Bisulfite Conversion: Treat 500ng genomic DNA with EZ DNA Methylation-Lightning Kit. Incubate: 98°C for 8 min, 54°C for 60 min. Desulphonate and elute in 20µL.
- PCR: Design primers with one biotinylated strand using PyroMark Assay Design SW. Amplify 2µL converted DNA. Verify amplicon on agarose gel.
- Pyrosequencing: Bind 10µL PCR product to Streptavidin Sepharose HP beads. Prepare single-stranded DNA template on PyroMark Q48. Sequence using PyroMark Q48 Autoprep system with 0.5µM sequencing primer.
- Analysis: Quantify methylation percentage at each CpG using PyroMark Q48 Software. Include non-CpG cytosines as internal conversion control.
Protocol 2: Cell-Type Deconvolution for EWAS Using Reference-Based Methods
- Principle: Estimate cellular heterogeneity from bulk methylation data using a validated reference dataset.
- Steps:
- Obtain Reference Matrix: Download cell-type-specific methylomes (e.g., from FlowSorted.Blood.450k for blood) or generate via sorting and profiling target cell types.
- Select Informative Probes: Identify differentially methylated CpGs (FDR <0.05, Δβ >0.2) between pure cell types in reference (≥50 per cell type).
- Deconvolution: Apply the Houseman algorithm via the
minfiorEpiDISHR package. UseprojectCellType()function with your bulk β-values and the reference matrix. - Adjustment: Include estimated cell proportions as covariates in your EWAS linear regression model to adjust for confounding.
The Scientist's Toolkit: Research Reagent Solutions
| Reagent / Material | Function in GWAS/EWAS Workflow | Key Considerations for Validation |
|---|---|---|
| Infinium MethylationEPIC v2.0 BeadChip | Genome-wide profiling of >935,000 methylation sites. | Includes ~80,000 new enhancer regions. Requires minfi or SeSAMe for preprocessing. |
| EZ DNA Methylation-Lightning Kit | Rapid, efficient bisulfite conversion of unmethylated cytosine to uracil. | Critical: Monitor conversion efficiency with unconverted lambda DNA control. |
| PyroMark Q48 Advanced Reagents | Quantitative pyrosequencing for locus-specific methylation validation. | Gold standard for validation. Design primers avoiding SNPs. |
| NEBNext Ultra II DNA Library Prep Kit | High-efficiency library preparation for ChIP-seq or WGBS. | Optimized for low-input samples. Use with Methylation Adaptors for WGBS. |
| Magna ChIP Protein A/G Magnetic Beads | Immunoprecipitation of chromatin-protein complexes for ChIP-seq. | Compatible with low-abundance transcription factors; requires rigorous antibody validation. |
| TruSeq DNA Methylation Kit (WGBS) | Whole-genome bisulfite sequencing library prep with unique dual indexing. | Provides base-resolution methylome. High sequencing depth (>30x) required for robust analysis. |
| Cell Separation Kits (e.g., FACS, MACS) | Isolation of specific cell populations for cell-type-specific analysis. | Essential for generating pure reference profiles and reducing heterogeneity confounding. |
Troubleshooting Guides and FAQs
General Epigenetic Analysis
Q: My bisulfite-converted DNA has very low yield. What could be the cause? A: Low yield is common. Primary causes are: incomplete desulfonation (inhibiting elution), DNA degradation prior to conversion (use fresh, high-quality DNA), or loss of DNA during clean-up steps (use carrier RNA or glycogen). Optimize incubation times and ensure fresh bisulfite reagents.
Q: My ChIP-seq experiment shows high background noise. How can I improve specificity? A: High background often stems from antibody non-specificity or chromatin over-shearing/fragmentation. Troubleshoot by: 1) Validating antibody with a positive/negative control cell line, 2) Optimizing sonication to achieve 200-500 bp fragments, 3) Increasing wash stringency, and 4) Using a robust pre-clearing step with Protein A/G beads.
Q: My qPCR for DNA methylation shows inconsistent amplification curves. A: This is typically due to inefficient bisulfite conversion leaving residual non-converted cytosines, which interferes with primer binding. Ensure complete conversion by: using control DNA with known methylation status, checking pH of bisulfite solution, and verifying thermal cycler lid temperature. Also, design primers specifically for converted DNA using dedicated software.
Cancer-Specific Issues
Q: When analyzing cell-free DNA (cfDNA) for cancer methylation biomarkers, my signal-to-noise ratio is poor. A: cfDNA is fragmented and low-abundance. Use: 1) Dedicated kits for low-input bisulfite conversion, 2) Duplex sequencing to reduce PCR errors, 3) Spike-in synthetic methylated/unmethylated controls to assess recovery, and 4) Targeted panels (e.g., using bisulfite padlock probes) over genome-wide approaches for deeper coverage.
Neurology & Aging-Specific Issues
Q: Post-mortem brain tissue yields inconsistent epigenomic data. How to standardize? A: Post-mortem interval (PMI) and pH significantly impact histone modifications and DNA methylation. For technical validation: 1) Record and covary for PMI and tissue pH in analysis, 2) Use internal reference controls (e.g., housekeeping gene methylation), 3) Employ a consistent dissection protocol for the same brain region, and 4) Consider using snap-frozen tissue over FFPE.
Table 1: Performance Metrics of Epigenetic Biomarkers in Key Diseases
| Disease Area | Biomarker Type | Typical Assay | Sensitivity Range | Specificity Range | Current Clinical Stage (Example) |
|---|---|---|---|---|---|
| Cancer | cfDNA Methylation | Targeted NGS | 70-95% | 85-99% | LDT/IVDs (e.g., Epi proColon, Galleri) |
| Neurology | CSF cgDNA Methylation | Methylation-Specific qPCR | 60-85% | 75-90% | Research / Discovery Phase |
| Aging | Horvath's Clock (DNAm) | BeadChip / NGS | >95% (Age Correlation) | N/A | Research / Biomarker of Healthspan |
Table 2: Common Technical Challenges & Solutions in Biomarker Validation
| Challenge | Impact on Data | Recommended Mitigation Strategy |
|---|---|---|
| Bisulfite Conversion Bias | False positive/negative methylation calls | Use oxidation-resistant conversion kits; include unconverted cytosine controls. |
| Batch Effects | False differential methylation | Randomize samples; use reference standards; apply ComBat or SVA correction. |
| Low Input DNA | High technical noise, failed assays | Use whole-genome amplification post-bisulfite; implement targeted capture. |
| Cell-Type Heterogeneity | Confounded disease signals | Perform cell-type deconvolution (e.g., using reference methylomes). |
Experimental Protocols
Protocol 1: Targeted Bisulfite Sequencing for cfDNA Methylation Analysis
Objective: To validate a panel of differentially methylated regions (DMRs) in plasma cfDNA from cancer patients.
- cfDNA Extraction: Use a silica-membrane column kit designed for low-volume plasma (e.g., 2-4 mL). Elute in 20-30 µL of low-EDTA TE buffer.
- Bisulfite Conversion: Treat 5-20 ng cfDNA using a reagent optimized for low-input/fragmented DNA (e.g., EZ DNA Methylation-Lightning Kit). Include fully methylated and unmethylated control DNA.
- Library Preparation & Target Enrichment: Amplify converted DNA with a multiplex PCR assay targeting DMRs OR perform bisulfite-converted whole-genome library prep followed by hybrid capture using a custom panel of biotinylated probes.
- Sequencing & Analysis: Sequence on a high-output platform (≥100,000x coverage per CpG). Align reads using Bismark/Bowtie2. Call methylation percentages with ≥10x depth filter. Use matched controls to define a methylation score threshold.
Protocol 2: Cell-Type Deconvolution from Bulk Brain Tissue Methylation Data
Objective: To estimate neuronal vs. glial proportions in bulk DNA methylation data from aged or neuro-diseased brain samples, correcting for cellular heterogeneity.
- Data Generation: Generate genome-wide DNA methylation data (e.g., Illumina EPIC array) from bulk homogenate of the brain region of interest.
- Reference Selection: Obtain a pre-established reference matrix of cell-type-specific methylation signatures (e.g., for neurons, microglia, astrocytes, oligodendrocytes) for the same brain region.
- Deconvolution Analysis: Use a computational tool (e.g., Houseman's method via minfi R package, or CIBERSORTx). Input your bulk beta-value matrix and the reference matrix.
- Statistical Adjustment: Use the estimated cell-type proportions as covariates in downstream differential methylation analysis to isolate disease-specific effects from cellular composition changes.
Diagrams
Diagram 1: cfDNA Methylation Biomarker Workflow for Cancer
Diagram 2: DNA Methylation Age Clock in Aging Research
Diagram 3: Key Signaling Pathway Altered by Promoter Methylation in Cancer
The Scientist's Toolkit: Research Reagent Solutions
Table 3: Essential Reagents for Epigenetic Biomarker Validation
| Item | Function | Example Product/Type |
|---|---|---|
| Methylated/Unmethylated Control DNA | Controls for bisulfite conversion efficiency and assay specificity. | MilliporeSigma CpGenome Universal Controls |
| DNA Bisulfite Conversion Kit | Chemically converts unmethylated cytosine to uracil, leaving 5mC intact. Critical first step. | Zymo Research EZ DNA Methylation-Lightning Kit, Qiagen EpiTect Fast DNA Bisulfite Kit |
| Anti-5-Methylcytosine Antibody | For MeDIP or immunoprecipitation-based enrichment of methylated DNA. | Diagenode anti-5mC monoclonal antibody |
| Cell-Type-Specific Reference Methylomes | Essential for deconvolution analysis in heterogeneous tissues (brain, tumor, blood). | Publicly available from repositories like CEEHRC or Blueprint. |
| Bisulfite-Sequencing Library Prep Kit | Prepares bisulfite-converted DNA for next-generation sequencing. | Swift Biosciences Accel-NGS Methyl-Seq DNA Library Kit |
| CpG Methylase (M.SssI) | Generates fully methylated control DNA for assay development. | NEB M.SssI CpG Methyltransferase |
| HDAC/DNMT Inhibitors (Control) | Used as positive controls to induce expected epigenetic changes in cell-based assays. | Trichostatin A (TSA) for HDAC; 5-Azacytidine for DNMT. |
Technical Support Center: Troubleshooting Guides & FAQs
This support center addresses common technical challenges in the validation of epigenetic biomarkers from cfDNA, liquid biopsies, and tissue biopsies, framed within the context of a robust technical validation thesis.
Frequently Asked Questions (FAQs)
Q1: My cfDNA extraction yield from plasma is consistently low and variable. What are the primary factors to investigate? A: Low cfDNA yield is frequently due to pre-analytical variables. Focus on:
- Blood Collection & Processing: Ensure use of cell-stabilizing tubes (e.g., Streck, PAXgene) or rapid processing (<2 hours) in EDTA tubes. Centrifugation protocols are critical: an initial 1,600-2,000 x g step to separate plasma from cells, followed by a 10,000-16,000 x g step to remove residual platelets and debris is standard.
- Plasma Volume: Input at least 3-5 mL of plasma for biomarker discovery studies to ensure sufficient template for downstream assays, especially for genome-wide analyses.
- Extraction Method: Use silica-membrane or bead-based kits specifically validated for low-abundance, short-fragment cfDNA. Avoid phenol-chloroform methods.
Q2: During bisulfite conversion of cfDNA for methylation analysis, my DNA is severely degraded, and recovery is poor. How can I optimize this? A: Bisulfite treatment is harsh. Implement these controls:
- Input Quality & Quantity: Use highly purified cfDNA. Measure fragment size (e.g., Bioanalyzer) to confirm the ~167 bp peak indicative of mononucleosomal cfDNA.
- Conversion Kit Selection: Use modern, rapid-cycle bisulfite kits designed for low-input and fragmented DNA.
- Carrier RNA: If permitted by your kit, include carrier RNA to minimize loss during precipitation and binding steps.
- Elution Volume: Elute in a small, low-EDTA TE buffer or nuclease-free water (e.g., 15-20 µL) to increase concentration.
- QC Post-Conversion: Quantify using methods specific for bisulfite-converted DNA (e.g., qPCR assays for converted ALU elements) rather than standard fluorometry, which overestimates.
Q3: How do I address high background noise and false positives in targeted sequencing of liquid biopsy samples for low-frequency variants? A: This is central to technical validation. The issue often stems from sequencing artifacts and sample preparation errors.
- Duplex Sequencing: Employ unique molecular identifiers (UMIs) and adopt a duplex sequencing approach where both strands of the original DNA molecule are tagged and sequenced. A true variant must be present on both strands. This can reduce error rates to <10⁻⁷.
- Error-Corrected PCR: Use polymerase systems with high fidelity and proofreading activity during pre-amplification steps.
- Bioinformatic Filtering: Apply strict filters for base quality, mapping quality, and strand bias. Use established tools (e.g., Mutect2, VarScan2) with parameters tuned for cfDNA.
Q4: When comparing methylation biomarkers between FFPE tissue biopsies and matched liquid biopsies, the correlation is weak. What could explain this? A: Discrepancies are expected and biologically informative.
- Tumor Heterogeneity: A single tissue biopsy reflects a specific spatial region of the tumor, while cfDNA in liquid biopsy is shed from all tumor deposits, capturing a more global heterogeneity.
- Cellular Source of cfDNA: Plasma cfDNA includes contributions from non-tumor sources (hematopoietic, stromal). Use deconvolution algorithms to estimate the tumor-derived fraction (ctDNA).
- DNA Integrity: FFPE DNA is cross-linked and fragmented differently than natively fragmented cfDNA. Optimization of FFPE DNA extraction and repair is essential.
- Validation: Ensure both assays (tissue-based and liquid biopsy-based) are technically validated for their respective sample matrices with established LOD and LOQ.
Table 1: Comparison of Biomarker Source Characteristics
| Parameter | Tissue Biopsy (FFPE) | Liquid Biopsy (Plasma cfDNA) |
|---|---|---|
| Invasiveness | High (surgical/core needle) | Low (peripheral blood draw) |
| Turnaround Time | Days to weeks | Hours to days |
| Tumor Representation | Limited (spatial heterogeneity) | Comprehensive (shed from all sites) |
| Typical Input DNA | 50-200 ng (variable quality) | 5-30 ng (highly fragmented) |
| Allele Frequency Detectability | Not applicable (bulk tissue) | As low as 0.1% (with error correction) |
| Major Technical Challenge | DNA degradation/cross-linking | Low tumor fraction & background noise |
Table 2: Minimum Technical Validation Benchmarks for ctDNA Assays (Thesis Context)
| Validation Parameter | Recommended Minimum Standard |
|---|---|
| Limit of Detection (LOD) | ≤0.1% variant allele frequency (VAF) |
| Limit of Blank (LOB) | ≤0.01% VAF |
| Precision (Repeatability) | CV ≤ 15% at VAF ≥ LOD |
| Input Material Robustness | Validation across 3-5 ng to 30 ng cfDNA input |
| Contrived Sample Concordance | ≥99.5% specificity, ≥95% sensitivity at ≥0.5% VAF |
Detailed Experimental Protocols
Protocol 1: Optimized cfDNA Extraction from Plasma for Methylation Studies
- Collection: Draw blood into cell-stabilizing tubes. Invert 10x gently.
- Processing: Centrifuge at 1,600-2,000 x g for 20 min at 4°C within 2 hours of draw. Transfer upper plasma layer to a fresh tube without disturbing the buffy coat.
- Double-Spin: Centrifuge plasma a second time at 16,000 x g for 10 min at 4°C. Transfer supernatant to a final tube.
- Extraction: Use a commercial cfDNA extraction kit (e.g., QIAamp Circulating Nucleic Acid Kit). Add proteinase K and carrier RNA to the plasma. Bind to silica membrane, wash, and elute in 20-40 µL of AVE buffer.
- QC: Quantify using a hsDNA Qubit assay. Assess fragment size distribution on a Bioanalyzer High Sensitivity DNA chip.
Protocol 2: Error-Corrected Targeted Sequencing for Low-Frequency Variants
- Library Preparation: Use a hybrid-capture or amplicon-based kit that incorporates UMIs during the initial extension/ligation step.
- Target Enrichment: Perform hybridization capture or multiplex PCR for regions of interest.
- Sequencing: Sequence on a platform yielding ≥150bp paired-end reads to cover cfDNA fragments. Target a minimum mean coverage of 10,000X on the panel.
- Bioinformatic Analysis:
- Alignment: Map reads to the reference genome (e.g., BWA-MEM).
- Consensus Building: Group reads by their UMI families. Generate a single consensus sequence for each original DNA strand (single-strand consensus sequence - SSCS), then pair complementary SSCS to form a duplex consensus sequence (DCS).
- Variant Calling: Call variants from the DCS reads using a standard caller (e.g., GATK). Apply filters for minimum family size and duplex support.
Pathway & Workflow Visualizations
Title: cfDNA Processing for Methylation Analysis
Title: Technical Validation Pathway for ctDNA Assay
The Scientist's Toolkit: Research Reagent Solutions
Table 3: Essential Materials for Epigenetic Biomarker Discovery from cfDNA
| Item | Function & Rationale |
|---|---|
| Cell-Stabilizing Blood Tubes (e.g., Streck) | Preserves blood cell integrity, prevents genomic DNA contamination, and stabilizes cfDNA profile for up to 14 days at room temperature. Critical for reproducible pre-analytics. |
| cfDNA-Specific Extraction Kit (e.g., QIAamp CNA, MagMAX cfDNA) | Optimized for low-concentration, short-fragment DNA binding, maximizing yield from limited plasma volumes. Includes carrier RNA. |
| High-Sensitivity DNA Analysis Kit (Agilent Bioanalyzer/TapeStation) | Accurately quantifies and visualizes fragment size distribution (~167 bp peak), essential for confirming cfDNA quality and detecting genomic DNA contamination. |
| Bisulfite Conversion Kit for Low-Input DNA (e.g., EZ DNA Methylation Lightning) | Rapid, efficient conversion with reduced DNA degradation. Designed for <10 ng inputs, suitable for precious cfDNA samples. |
| UMI-Integrated Library Prep Kit (e.g., Swift Accel-NGS, Twist NGS) | Incorporates unique molecular identifiers (UMIs) at the initial step, enabling error correction and accurate quantification of low-frequency variants in NGS. |
| Methylation-Specific ddPCR Assays (Bio-Rad) | For absolute, digital quantification of specific methylation events (e.g., SEPTIN9, SHOX2) without NGS. Provides high sensitivity and rapid validation. |
| FFPE DNA Repair & Extraction Kit (e.g., QIAamp DNA FFPE) | Reverses formaldehyde cross-links and repairs damaged DNA, enabling more reliable downstream bisulfite conversion and PCR from archival tissue. |
| Deconvolution Software (e.g., EpiDISH, MethAtlas) | Bioinformatics tool to estimate the cellular composition of a sample (e.g., tumor vs. immune vs. stromal) from genome-wide methylation data, crucial for interpreting liquid biopsy results. |
From Lab to Data: Best Practices in Epigenetic Assay Design and Platform Selection
Technical Support Center
Troubleshooting Guides & FAQs
Bisulfite Sequencing (WGBS/RRBS)
- Q: Why is my bisulfite-converted DNA yield extremely low or degraded?
- A: This is often due to incomplete desulfonation or excessive fragmentation during the harsh bisulfite treatment. Ensure fresh sodium bisulfite reagent (pH ~5.0), optimal incubation temperature (55-60°C), and precise desalting/clean-up steps. For FFPE samples, optimize pre-bisulfite repair.
- Q: I observe poor sequencing library complexity in RRBS. What could be the cause?
- A: Inefficient MspI digestion is a primary culprit. Verify enzyme activity, ensure DNA is clean and unmethylated (CpG sites in MspI's CCGG sequence should not be methylated for cutting), and use the correct buffer. Incomplete size selection can also lead to a high duplicate rate.
- Q: How do I handle PCR bias in bisulfite sequencing amplicons?
- A: Use a polymerase validated for unbiased amplification of bisulfite-converted DNA (high processivity). Limit PCR cycles, use unique molecular identifiers (UMIs) to deduplicate reads, and consider designing primers in regions with low CpG density to minimize sequence divergence.
Methylation Arrays
- Q: My sample fails the array quality control (QC) metrics, particularly the detection p-value threshold. What should I do?
- A: This typically indicates poor bisulfite conversion efficiency or insufficient/integrity of input DNA. Re-check bisulfite conversion with control probes, verify Nanodrop/QuBit readings, and ensure no carryover of salts or contaminants. For degraded samples, use restoration kits or consider a platform with lower input requirements.
- Q: How do I correct for batch effects between different array processing runs?
- A: Include technical replicates or control samples across batches. During data analysis, use normalization methods (e.g., BMIQ, SWAN) and implement ComBat or other batch-correction algorithms designed for methylation array data. Randomize sample processing order.
- Q: What causes abnormally high or low background fluorescence on the array?
- A: High background can result from inadequate washing, debris on the array, or fluorescent contaminants. Low signal/background may stem from insufficient hybridization time, degraded labeled DNA, or incorrect hybridization temperature. Strictly follow washing protocols and check scanner calibration.
Targeted qPCR (Methylation-Specific PCR - MSP)
- Q: My methylation-specific PCR shows amplification in both methylated and unmethylated reactions (non-specificity).
- A: Primer design is critical. Ensure primers for the methylated reaction have a CpG at the 3' end and check for secondary structure. Optimize annealing temperature using a gradient PCR. Validate primer specificity with fully methylated and unmethylated control DNA.
- Q: Quantitative Methylation-Specific PCR (qMSP) shows inconsistent standard curves.
- A: Use serially diluted, bisulfite-converted control DNA of known methylation percentage for your locus of interest. Ensure complete bisulfite conversion of the standard. Avoid using plasmid DNA with non-human sequence context, as amplification efficiency may differ.
- Q: How do I normalize input DNA for qMSP?
- A: Co-amplify a reference gene from the bisulfite-converted DNA that is known to be unmethylated in all tissues (e.g., ALU elements, ACTB). Express the target methylation level as a ratio (ΔΔCq method) relative to this reference to account for input variation and bisulfite conversion efficiency.
Data Presentation: Platform Comparison for Technical Validation
Table 1: Quantitative Comparison of DNA Methylation Analysis Platforms
| Feature | WGBS | RRBS | Methylation Arrays (e.g., EPIC) | Targeted qMSP |
|---|---|---|---|---|
| Genome Coverage | >90% of CpGs | ~3-5 million CpGs (enriched for CpG islands, promoters) | ~850,000 - 900,000 pre-selected CpGs | 1 - 10s of specific CpG sites |
| DNA Input Requirement | 10-100 ng (high-quality); >500 ng (post-bisulfite) | 10-100 ng | 250-500 ng (standard); 50-100 ng (low input) | 1-50 ng (post-bisulfite) |
| Typical Cost per Sample | High | Medium | Low-Medium | Very Low |
| Resolution | Single-base | Single-base | Single-base (but pre-defined) | Locus-specific (aggregate) |
| Best Suited For | Discovery, novel biomarker identification, imprinted genes, repetitive regions | Cost-effective discovery in CpG-rich regions | Large cohort screening, biomarker validation | Clinical validation, rapid screening of known markers |
| Key Technical Validation Consideration | Requires high sequencing depth (>30x) for reliable calling; batch effects in library prep. | Bias from restriction enzyme efficiency; less coverage outside enriched regions. | Cross-reactive probes; may miss biology outside probe set. | Prone to PCR bias; requires meticulous optimization and controls. |
Experimental Protocols
Protocol 1: Standard Sodium Bisulfite Conversion for DNA Methylation Analysis
- Denaturation: Mix 500 ng - 1 µg genomic DNA with NaOH (final 0.3 M) in a 20 µL volume. Incubate at 42°C for 20 min.
- Sulfonation: Add 208 µL of freshly prepared 3.6 M sodium bisulfite solution (pH 5.0) and 12 µL of 10 mM hydroquinone. Mix gently. Overlay with mineral oil.
- Incubation: Perform thermal cycling: 95°C for 5 min, then 55°C for 12-16 hours, protected from light.
- Desalting: Bind DNA to a column or bead-based system per manufacturer's instructions (e.g., Zymo Research EZ DNA Methylation kits). Desulfonate by adding NaOH (final 0.3 M) and incubating at room temperature for 15 min.
- Purification & Elution: Neutralize, wash, and elute converted DNA in 10-20 µL TE buffer or water. Store at -80°C.
Protocol 2: qMSP for Quantitative Methylation Biomarker Validation
- Primer/Probe Design: Design primers specific to the bisulfite-converted sequence of the methylated (M) and unmethylated (U) alleles. TaqMan probes are recommended for specificity.
- Standard Curve Preparation: Use commercially available universally methylated and unmethylated human genomic DNA. Mix to create standards with defined methylation percentages (0%, 25%, 50%, 75%, 100%). Perform bisulfite conversion on these standards alongside test samples.
- qPCR Setup: Prepare separate reactions for M and U assays. Each 20 µL reaction contains: 1x qPCR master mix, forward/reverse primers (300 nM each), probe (200 nM), and 2 µL of bisulfite-converted DNA.
- Cycling Conditions: 95°C for 10 min; 45 cycles of 95°C for 15 sec and 60°C for 1 min (annealing/extension, optimize as needed).
- Data Analysis: Generate standard curves for M and U assays. Calculate the methylation percentage as: %Methylation = (QuantityM / (QuantityM + QuantityU)) * 100. Normalize to a reference gene if accounting for input.
Diagrams
Title: DNA Methylation Analysis Platform Selection Workflow
Title: Bisulfite Conversion Core Process
The Scientist's Toolkit: Research Reagent Solutions
Table 2: Essential Reagents for DNA Methylation Analysis
| Item | Function | Key Considerations for Validation |
|---|---|---|
| Sodium Bisulfite (NaHSO₃) | Converts unmethylated cytosine to uracil, leaving 5-methylcytosine unchanged. | Purity and freshness are critical; prepare solution at pH ~5.0 immediately before use for optimal conversion efficiency. |
| DNA Polymerase for Bisulfite PCR | Amplifies bisulfite-converted DNA, which is AT-rich and fragmented. | Must be "bisulfite-tolerant" (lack of strand-displacement activity) to prevent bias. Examples: ZymoTaq, EpiMark Hot Start. |
| Methylation-Specific Primers & Probes | Detect sequence differences between methylated and unmethylated alleles post-conversion. | Designed with CpGs at 3' ends for specificity; validated against control DNA of known methylation states. |
| Universal Methylated/Unmethylated Control DNA | Positive controls for bisulfite conversion and assay specificity. | Used to generate standard curves for qMSP and verify complete conversion in any protocol. |
| MSPI Restriction Enzyme (for RRBS) | Enriches for CpG-rich regions by cutting CCGG sites. | Enzyme must be active on genomic DNA; avoid using if target regions lack CCGG sites. |
| Bisulfite Conversion Kit | Provides optimized reagents and columns for the multi-step conversion and clean-up process. | Choose based on DNA input range, sample type (e.g., FFPE), and compatibility with downstream platform. |
| Infinium Methylation BeadChip Kit | Contains all reagents for whole-genome amplification, enzymatic fragmentation, array hybridization, and single-base extension. | Platform-specific; requires precise handling and the iScan or comparable imaging system. |
| Methylation DNA Standard (Plasmid) | Quantitative standard for droplet digital PCR (ddPCR) assays of methylation. | Contains cloned target sequence; allows absolute quantification of methylated allele copies. |
FAQs & Troubleshooting Guides
Q1: Why do my qPCR assays for bisulfite-converted DNA consistently show high Ct values or no amplification? A: This is often due to inefficient bisulfite conversion or suboptimal primer design. Ensure complete conversion using unconverted genomic DNA controls. Primer sequences must account for cytosine-to-uracil conversion; design for the converted strand (all non-CpG cytosines become thymines). Verify primer Tm is between 58-62°C and avoid regions with high CpG density in the primer binding site, as this creates complexity. Increase template input if DNA degradation is suspected.
Q2: How can I ensure my primers are specific to the methylated vs. unmethylated allele after bisulfite treatment? A: Specificity is achieved by placing at least 2-3 CpG sites at the 3'-end of the primer. For Methylation-Specific PCR (MSP), design two separate primer pairs: one fully complementary to the converted methylated sequence (where CpG cytosines remain as cytosines, represented as 'C' in the primer), and one fully complementary to the converted unmethylated sequence (where CpGs become thymines, represented as 'T' in the primer). Use stringent, matched annealing temperatures.
Q3: What causes non-specific amplification or false positives in my methylation assays? A: The primary cause is incomplete bisulfite conversion, where unconverted cytosines are misinterpreted as methylated cytosines. Always include controls: fully methylated and fully unmethylated DNA. Secondary causes include primer dimers or mis-priming due to the reduced sequence complexity of the bisulfite-converted genome (rich in A/T). Use a hot-start polymerase and design primers with bioinformatics tools that check for bisulfite-converted genome specificity.
Q4: How do I handle sequencing results from bisulfite-PCR products that show inconsistent or low methylation percentages? A: Inconsistent results often stem from PCR bias, where one allele (often the unmethylated) amplifies preferentially. Use a polymerase validated for unbiased amplification of bisulfite-converted DNA and minimize PCR cycles. For pyrosequencing or NGS, ensure primers are tagged to prevent amplification of primer-dimers and use a nested approach if necessary.
Key Experimental Protocols
Protocol 1: Sodium Bisulfite Conversion (Optimized for High Recovery)
- Denaturation: Dilute 500 ng genomic DNA in 20 µL TE buffer. Add 130 µL of 0.3M NaOH. Incubate at 42°C for 20 min.
- Conversion: Add 850 µL of freshly prepared bisulfite solution (2.5M sodium metabisulfite, 125 mM hydroquinone, pH 5.0). Mix gently.
- Incubation: Perform cyclic incubation: 95°C for 30 seconds, 50°C for 15 minutes, for 16-20 cycles in a thermal cycler with a heated lid.
- Desalting: Bind DNA to a silica membrane column (from commercial kits). Wash with wash buffer/ethanol mixture.
- Desulfonation: Add 200 µL of 0.2M NaOH directly to the column membrane and incubate at room temperature for 5 min. Wash.
- Elution: Elute in 20-30 µL of 10 mM Tris-HCl, pH 8.5. Quantify with a fluorescence assay specific for ssDNA.
Protocol 2: Methylation-Specific PCR (MSP) Optimization
- Primer Design: Design methylated (M) and unmethylated (U) primers as per FAQ A2. Keep product size <300 bp.
- Reaction Setup: Prepare a 25 µL reaction: 1X PCR buffer, 2.0-2.5 mM MgCl2, 200 µM dNTPs, 0.3 µM each primer, 1 unit hot-start Taq polymerase, 10-50 ng bisulfite-converted DNA.
- Thermocycling: Initial denaturation: 95°C for 5 min. Then 35-40 cycles of: 95°C for 30s, Optimized Annealing Temp (60-65°C) for 30s, 72°C for 30s. Final extension: 72°C for 5 min.
- Analysis: Run products on a 2-3% agarose gel. Include water (NTC), unconverted DNA (negative control), and in vitro methylated DNA (positive M control) on every run.
Data Presentation
Table 1: Common Bisulfite Conversion Kits & Performance Metrics
| Kit Name | Conversion Efficiency (%) | DNA Recovery (%) | Recommended Input (ng) | Hands-on Time |
|---|---|---|---|---|
| EZ DNA Methylation-Lightning | >99.5 | 50-70 | 50-500 | Low |
| MethylCode Bisulfite | >99 | 40-60 | 10-500 | Medium |
| innuCONVERT Bisulfite | >99.5 | 60-80 | 10-1000 | Low |
| Epitect Fast FFPE | >99 | 30-50 (FFPE) | 100-2000 | Medium |
Table 2: Troubleshooting Guide for Specificity Challenges
| Problem | Possible Cause | Diagnostic Control | Solution |
|---|---|---|---|
| False Positive Methylation | Incomplete Bisulfite Conversion | Unconverted genomic DNA control | Increase conversion time/temp; fresh bisulfite |
| False Negative Methylation | PCR Bias towards U allele | Mixtures of M/U DNA controls | Redesign primers; use bias-resistant polymerase |
| High Background/Noise | Primer-Dimers or Mis-priming | No-Template Control (NTC) | Increase annealing temp; use touchdown PCR |
| Inconsistent Replicates | Degraded/Damaged DNA post-conversion | Analyze DNA on bioanalyzer | Reduce conversion time; elute in neutral pH buffer |
The Scientist's Toolkit: Research Reagent Solutions
| Item | Function in Bisulfite-Based Assays |
|---|---|
| Sodium Bisulfite (Fresh) | The core converting agent; transforms non-methylated C to U. Must be freshly prepared. |
| Hydroquinone | Antioxidant added to bisulfite solution to prevent DNA degradation during conversion. |
| Hot-Start DNA Polymerase | Reduces non-specific amplification and primer-dimer formation during PCR setup. |
| Bias-Resistant Polymerase (e.g., PfuTurbo Cx) | Engineered to amplify methylated and unmethylated alleles without sequence bias. |
| Fluorometric ssDNA Assay | Accurately quantifies the single-stranded DNA yield after bisulfite conversion. |
| In Vitro Methylated Genomic DNA | Essential positive control for methylated allele assays. |
| Universal Unmethylated DNA | Essential negative control (e.g., from whole genome amplification). |
| Methylated & Unmethylated Primer Pairs | Validated, sequence-specific primers for MSP or bisulfite sequencing. |
Diagrams
Bisulfite Assay Workflow & Specificity Checkpoints
Primer Design for Methylation Specificity
Technical Support Center
Troubleshooting Guides & FAQs
Q1: Our DNA extracted from blood shows poor bisulfite conversion efficiency. What could be the cause and how can we fix it? A: This is often due to DNA degradation or contamination with heme/cellular proteins. Ensure blood is collected directly into EDTA or specialized cell-stabilization tubes (e.g., PAXgene) and processed within 2-4 hours. For archived samples, use a cleanup kit designed for bisulfite sequencing. Verify DNA integrity with a Bioanalyzer; RIN/ DIN should be >7.
Q2: We observe inconsistent DNA methylation profiles from different regions of the same FFPE tissue block. How should we standardize sampling? A: Intra-tumor heterogeneity and differential fixation are key culprits. Standardize by:
- Performing H&E staining on consecutive sections to guide macro-dissection of target cell populations.
- Using a minimum of 3-5 serial sections (10 µm thick) to average regional variability.
- Applying a validated deparaffinization and proteinase K digestion protocol (see protocol below).
Q3: How can we minimize the loss of histone modifications during tissue processing for ChIP-seq? A: Rapid fixation and avoidance of acid decalcification are critical. For fresh tissue, immediately mince and crosslink with 1% formaldehyde for 10-15 minutes. For frozen tissue, use a methanol-free fixative. For FFPE, antigen retrieval must be optimized for histone epitopes; citrate buffer (pH 6.0) with 0.1% SDS often works, but perform an epitope retrieval validation test.
Q4: Cell-free DNA (cfDNA) yields from plasma are low, compromising our methylome analysis. What steps improve yield and quality? A: Centrifugation protocol is paramount. Perform a double centrifugation: first at 1,600 x g for 10 min at 4°C to isolate plasma from whole blood, then transfer supernatant and centrifuge at 16,000 x g for 10 min to remove residual cells. Use blood collection tubes with formaldehyde stabilizers cautiously as they can fragment DNA. Process plasma within 2 hours or freeze at -80°C immediately.
Q5: RNA from FFPE samples yields poor results for epitranscriptomic (m6A) analysis. How can we improve RNA integrity for these assays? A: Standard FFPE RNA is often fragmented, unsuitable for certain m6A mapping techniques. Optimize by:
- Using RNA-targeted fixation reagents (e.g., RNAlater) prior to formalin fixation when possible.
- Performing rigorous DNase treatment and using ribosomal RNA depletion libraries instead of poly-A selection for sequencing.
- Employing an antibody validated for immunoprecipitation of methylated sites from fragmented RNA.
Detailed Experimental Protocols
Protocol 1: Standardized Processing of Blood for Cell-Free Methylation Analysis
- Collection: Draw blood into 10mL K2EDTA tubes. Invert 8-10 times gently.
- Processing: Within 2 hours, centrifuge at 1,600 x g for 10 min at 4°C. Carefully transfer supernatant (plasma) to a fresh tube.
- Secondary Spin: Centrifuge plasma at 16,000 x g for 10 min at 4°C. Transfer supernatant into a final tube, avoiding the pellet.
- Storage: Aliquot plasma and store at -80°C. Avoid freeze-thaw cycles.
- cfDNA Extraction: Use a silica-membrane based kit optimized for cfDNA (e.g., QIAamp Circulating Nucleic Acid Kit). Elute in 10-20 µL of low-EDTA TE buffer or molecular grade water.
- Quality Control: Quantify using a fluorometer sensitive to low DNA concentrations (e.g., Qubit HS dsDNA assay). Assess fragment size distribution using a Bioanalyzer HS DNA chip.
Protocol 2: Optimized DNA Extraction from FFPE for Bisulfite Sequencing
- Sectioning: Cut 3-5 sections of 10 µm thickness. Use a fresh, clean blade for each block.
- Deparaffinization:
- Place sections in a 1.5 mL microcentrifuge tube.
- Add 1 mL xylene. Vortex. Incubate at 55°C for 10 min. Centrifuge at full speed for 2 min. Discard supernatant.
- Repeat xylene step once.
- Wash with 1 mL 100% ethanol. Vortex. Centrifuge 2 min. Discard supernatant.
- Repeat ethanol wash twice.
- Air dry pellet for 10-15 min.
- Digestion: Add 180 µL of digestion buffer and 20 µL of Proteinase K. Incubate at 56°C with agitation until tissue is fully lysed (2-16 hours). Heat-inactivate at 90°C for 10 min.
- DNA Purification: Use a column-based FFPE DNA purification kit with an optional de-crosslinking step (incubation with 2 µL RNase A at 37°C for 30 min, then with 20 µL Proteinase K at 70°C for 1 hour).
- Bisulfite Conversion: Use a kit specifically designed for highly fragmented/degraded DNA (e.g., EZ DNA Methylation-Lightning Kit). Follow manufacturer’s instructions, ensuring optimal conversion conditions (thermocycler program).
Protocol 3: Crosslinking Chromatin Immunoprecipitation (ChIP) from Fresh/Frozen Tissue
- Crosslinking: For 50 mg minced tissue, resuspend in 10 mL PBS. Add 270 µL of 37% formaldehyde (final ~1%). Incubate at room temperature for 10-15 min with gentle rotation.
- Quenching: Add 1 mL of 1.25M glycine (final ~0.125M). Incubate 5 min at RT.
- Washing: Pellet tissue at 700 x g for 5 min at 4°C. Wash twice with 10 mL cold PBS.
- Lysis & Sonication: Lyse tissue in 1 mL Lysis Buffer with protease inhibitors. Sonicate using a Covaris or tip sonicator to achieve 200-500 bp fragments. (Validate fragment size on agarose gel).
- Immunoprecipitation: Follow standard ChIP protocol with 5-10 µg chromatin and 1-5 µg of validated, epitope-specific antibody. Include an isotype control.
- Decrosslinking & Purification: Incubate with Proteinase K at 65°C overnight. Purify DNA with SPRI beads. Elute in 20 µL.
Data Presentation Tables
Table 1: Recommended Sample Handling Conditions for Key Epigenetic Analyses
| Sample Type | Target Analysis | Optimal Collection/Stabilization | Max Hold Before Processing | Recommended Storage Long-Term |
|---|---|---|---|---|
| Whole Blood | Global DNA Methylation (Array/Seq) | EDTA tube, process <4h | 24h (4°C) | DNA at -80°C |
| Whole Blood | Cell-Free Methylation | Streck cfDNA BCT or K2EDTA, double spin <2h | 6h (Streck) / 2h (EDTA) | Plasma at -80°C |
| Fresh Tissue | Histone Modifications (ChIP-seq) | Snap-freeze LN2 or 1% Formalin fix <15min | N/A | Tissue at -80°C or fixed, paraffin-embedded |
| FFPE Tissue | DNA Methylation | 10% NBF, fix 18-24h | N/A | Block at 4°C, dark |
| Buffy Coat | Hydroxymethylation (hMeDIP) | Isolate within 4h, preserve in DNA/RNA Shield | 24h (4°C) | DNA at -80°C |
Table 2: QC Metric Thresholds for Downstream Epigenetic Assays
| Assay | Input Material | Key QC Metric | Acceptable Threshold | Instrument/Method |
|---|---|---|---|---|
| Bisulfite Sequencing | Genomic DNA | DNA Integrity Number (DIN) | >7 (Fresh), >5 (FFPE) | Agilent TapeStation |
| RRBS/oxBS-seq | Genomic DNA | Concentration | >20 ng/µL | Qubit HS dsDNA |
| ChIP-seq | Sonicated Chromatin | Fragment Size Distribution | 200-500 bp peak | Agilent Bioanalyzer HS |
| ATAC-seq | Viable Nuclei | Nuclei Count & Purity | >50k intact nuclei | Trypan Blue/Flow Cytometry |
| MeDIP-seq | Fragmented DNA | Fragment Size | 100-300 bp | Agilent Bioanalyzer HS |
Diagrams
Title: Blood cfDNA Processing Workflow
Title: FFPE DNA Extraction for Methylation
Title: Threats to Epigenetic Marks in Biospecimens
The Scientist's Toolkit: Essential Research Reagent Solutions
| Item | Function in Epigenetic Preservation |
|---|---|
| Cell-Free DNA BCT Tubes (e.g., Streck) | Stabilizes nucleated blood cells to prevent genomic DNA contamination of plasma and minimizes cfDNA degradation. |
| PAXgene Blood DNA/RNA Tubes | Contains additives that immediately stabilize blood cells and nucleic acids for consistent methylation profiles. |
| RNAlater Stabilization Solution | Rapidly penetrates tissues to stabilize and protect cellular RNA (and thus epitranscriptomic marks) prior to fixation/freezing. |
| Methanol-Free Formaldehyde (1%) | Preferred crosslinker for ChIP-seq; avoids histone epitope masking that can occur with methanol-stabilized formalin. |
| DNA/RNA Shield (e.g., Zymo) | A nucleic acid stabilization buffer that inactivates nucleases and protects against oxidation for ambient temperature storage. |
| Proteinase K (Recombinant, PCR-Grade) | Essential for efficient digestion of FFPE tissue and reversal of crosslinks without introducing enzyme contaminants. |
| Methylation-Specific DNA Cleanup Beads (SPRI) | Magnetic beads optimized for post-bisulfite converted DNA cleanup, improving library prep efficiency. |
| Histone Modification Validated Antibodies | Antibodies specifically validated for ChIP-seq in FFPE or frozen tissue (e.g., by ENCODE or C-HPP consortia). |
| EZ DNA Methylation-Lightning Kit | A fast bisulfite conversion kit optimized for low-input and partially degraded DNA from FFPE/blood. |
| Covaris microTUBE & SonoLab | For consistent, reproducible chromatin or DNA shearing to ideal fragment sizes for NGS library construction. |
Technical Support Center
Troubleshooting Guides & FAQs
Q1: My post-bisulfite conversion DNA yield is consistently low. What are the primary causes and solutions? A: Low yield is often due to incomplete DNA recovery or excessive degradation. Key factors:
- Incomplete Desalting: Ensure ethanol washes during cleanup are performed with fresh 70-80% ethanol. Do not over-dry the pellet.
- DNA Fragmentation: Starting material should be high-quality (RIN >8 for FFPE, use appropriate shearing/crosslink reversal).
- Inadequate Incubation: Verify thermal cycler calibration for the bisulfite conversion step (typically 98°C for denaturation and 60°C for conversion).
- Solution: Include a spike-in of unmethylated lambda phage DNA as a conversion and recovery control. Quantify pre- and post-conversion using a fluorescence-based assay (e.g., Qubit) specific for ssDNA.
Q2: I observe high duplication rates in my final sequencing data. Which step in the workflow is most likely responsible? A: High duplication rates primarily stem from low input material into library preparation, leading to over-amplification.
- Primary Cause: Insufficient bisulfite-converted DNA entering the library prep PCR.
- Troubleshooting Steps:
- Accurately quantify bisulfite-converted DNA (use ssDNA-specific assays).
- Increase input mass if possible (aim for >10 ng where feasible).
- Optimize PCR cycle number; use the minimum necessary for library detection.
- Ensure proper size selection to remove very small fragments that amplify more efficiently.
Q3: After bisulfite conversion and library prep, my Bioanalyzer trace shows a broad smear or no peak. What does this indicate? A: This indicates severe DNA degradation or the presence of large contaminants.
- For a Broad Smear: DNA was degraded prior to or during bisulfite treatment (acidic conditions). Check starting DNA quality and strictly adhere to conversion time/temperature.
- For No Peak/Shifted Peak: Incomplete bisulfite conversion or carryover of bisulfite salts inhibiting enzymatic steps. Ensure proper cleanup and desalting. Validate conversion efficiency with control DNA.
Q4: My bisulfite sequencing results show low conversion efficiency (<95%). How can I troubleshoot this? A: Low conversion efficiency invalidates methylation calls.
- Check Reagents: Ensure bisulfite reagent is fresh (sodium bisulfite solution degrades; aliquot and store at -20°C, protected from light and moisture).
- Verify Incubation Conditions: Ensure the reaction is protected from evaporation (use mineral oil or a thermal cycler with a heated lid).
- Cleanup Protocol: Follow cleanup protocol meticulously to remove all traces of the bisulfite reagent, which can inhibit downstream enzymes.
- Control: Always run a known unmethylated control (e.g., lambda DNA) to calculate the non-conversion rate.
Q5: During library preparation, my post-PCR purification recovery is low. What should I adjust? A: Low recovery post-purification can be due to bead-based cleanup issues.
- Bead-to-Sample Ratio: Verify you are using the correct volumetric ratio of SPRI beads to sample (typically 0.8X to 1.8X, depending on the step).
- Ethanol Wash: Use freshly prepared 80% ethanol. Ensure all ethanol is removed after washing, but do not over-dry the beads (cracking indicates over-drying).
- Elution Buffer: Elute in a low-EDTA or EDTA-free buffer (e.g., 10 mM Tris-HCl, pH 8.0-8.5) and ensure it is properly warmed.
Table 1: Typical Yield and Quality Metrics Across Workflow Steps
| Workflow Step | Recommended Input | Expected Yield (Efficiency) | Key QC Metric & Target |
|---|---|---|---|
| Nucleic Acid Extraction | Tissue: 5-10 mg; Cells: 10^4-10^6 | 0.5-5 µg total DNA | A260/A280: 1.8-2.0; A260/A230: >2.0; DNA Integrity (RIN/DIN): >7 |
| Bisulfite Conversion | 10 pg - 2 µg DNA | 30-70% recovery | Conversion Efficiency (via Control DNA): >99.5% |
| Library Preparation | 1-100 ng converted DNA | 50-80% of input into amplifiable library | Pre-PCR Size Distribution: Peak ~200-300 bp; Post-PCR Library Concentration: >5 nM |
| Final Library QC | 1 µL of library | N/A | Average Fragment Size (Bioanalyzer): Target size ± 50 bp; Adapter Dimer: <10% |
Table 2: Common Bisulfite Kits: Key Performance Indicators
| Kit Name (Example) | Recommended Input Range | Incubation Time | Elution Volume | Claimed Recovery | Best For |
|---|---|---|---|---|---|
| Kit A (Rapid) | 10 pg - 500 ng | 90 min | 10-20 µL | >80% | High-throughput, intact DNA |
| Kit B (FFPE-Optimized) | 50 pg - 2 µg | 5-16 hrs | 10-40 µL | 50-70% | Degraded/FFPE samples |
| Kit C (Low-Input) | 1 pg - 50 ng | 4-8 hrs | 10-15 µL | >60% | Limited or precious samples |
Experimental Protocols
Protocol 1: Nucleic Acid Extraction from FFPE Tissue Sections for Bisulfite Sequencing
- Deparaffinization: Cut 5-10 µm sections. Add 1 mL xylene, vortex, incubate 5 min, centrifuge. Repeat with fresh xylene.
- Ethanol Washes: Remove xylene, add 1 mL 100% ethanol, vortex, centrifuge. Repeat with 90% and 70% ethanol.
- Proteinase K Digestion: Air dry pellet. Resuspend in 200 µL digestion buffer (e.g., ATL buffer) with 20 µL Proteinase K. Incubate at 56°C overnight.
- RNAse A Treatment: Add 4 µL RNAse A (100 mg/mL), mix, incubate at room temp for 2 min.
- DNA Purification: Add 200 µL AL buffer, mix, incubate at 70°C for 10 min. Add 200 µL 100% ethanol, mix.
- Column Binding & Washes: Transfer mixture to a spin column, centrifuge. Wash with AW1 and AW2 buffers as per kit instructions.
- Elution: Elute DNA in 50-100 µL of 10 mM Tris-HCl (pH 8.5). Quantify via fluorometry.
Protocol 2: Sodium Bisulfite Conversion (Modified In-House Protocol)
- Denaturation: Mix 20 µL DNA (up to 2 µg) with 130 µL of CT Conversion Reagent (2 M sodium bisulfite, 4 M urea, pH 5.0) and 10 µL of DNA Protection Buffer. Incubate at 98°C for 10 min, then 60°C for 2.5 hours (protected from light).
- Desalting/Binding: Prepare a column/binding plate. Add 600 µL of Binding Buffer to the conversion mix, load onto the column, and centrifuge.
- Washes: Wash with 200 µL Wash Buffer 1, centrifuge. Wash twice with 200 µL Wash Buffer 2/ethanol mix, centrifuge. Dry column with an additional spin.
- Desulfonation/Elution: Add 200 µL Desulphonation Buffer (0.2 M NaOH), incubate at room temp for 5 min, centrifuge. Wash with Wash Buffer 2, dry, and elute in 20 µL Elution Buffer.
Protocol 3: Bisulfite-Seq Library Preparation (Post-Conversion)
- End Repair & A-Tailing: Use 10-50 ng of bisulfite-converted DNA in a reaction with DNA polymerase, dNTPs, and ATP. Incubate at 20°C for 30 min, then 65°C for 30 min.
- Adapter Ligation: Add methylated or universal adapters (compatible with bisulfite-converted uracil-containing DNA) and ligase. Incubate at 20°C for 15 min.
- Cleanup: Purify using a 0.8X SPRI bead ratio to remove excess adapters.
- PCR Enrichment: Amplify with a high-fidelity, uracil-tolerant polymerase. Use 8-12 cycles. Include index primers for multiplexing.
- Final Cleanup & Size Selection: Perform a double-sided SPRI bead cleanup (e.g., 0.5X to 0.8X ratio) to select fragments ~200-400 bp and remove primer dimers.
- QC: Quantify by qPCR and analyze fragment size on a Bioanalyzer/TapeStation.
Workflow and Relationship Diagrams
Title: Integrated Workflow for Bisulfite Sequencing
Title: Troubleshooting High Duplication Rates
The Scientist's Toolkit
Table 3: Essential Research Reagent Solutions for Bisulfite Sequencing Workflow
| Item | Function | Key Consideration |
|---|---|---|
| DNA Extraction Kit (FFPE) | Isolates DNA from cross-linked, degraded tissue samples. | Optimized for deparaffinization and proteinase K digestion; maximizes yield from limited material. |
| Fluorometric DNA Quantitation Kit | Accurately quantifies dsDNA and ssDNA. Critical for post-bisulfite converted DNA (ssDNA). | Use a dye specific for ssDNA (e.g., Quant-iT OliGreen) for post-conversion quantitation. |
| High-Sensitivity DNA Analysis Kit | Assesses DNA integrity (RIN/DIN) and library fragment size distribution. | Essential for QC of FFPE input and final library before sequencing. |
| Sodium Bisulfite Conversion Kit | Chemically converts unmethylated cytosines to uracils while leaving methylated cytosines intact. | Choose based on input DNA quality (intact vs. FFPE) and required incubation time. |
| Uracil-Tolerant DNA Polymerase | Amplifies bisulfite-converted, uracil-containing DNA without bias during library PCR. | Required for efficient and unbiased amplification post-conversion. |
| Methylated Adapters | Adapters compatible with bisulfite-converted DNA for NGS library construction. | Prevents bias; standard unmethylated adapters would be degraded in subsequent bisulfite treatment if used pre-conversion. |
| SPRI Magnetic Beads | For DNA size selection and cleanup after ligation and PCR. | Ratios (e.g., 0.8X) are critical for selecting the desired fragment range and removing dimers. |
| Bisulfite Conversion Control DNA | A known unmethylated DNA (e.g., Lambda phage) spiked into the conversion reaction. | Allows precise calculation of non-conversion rate, a critical QC metric. |
Troubleshooting Guides & FAQs for Epigenetic Biomarker Research
This technical support center addresses common issues encountered when choosing between targeted and genome-wide epigenetic analysis strategies, crucial for the technical validation of epigenetic biomarkers.
FAQ 1: When should I use a targeted approach (like bisulfite sequencing-PCR or pyrosequencing) over a genome-wide approach (like whole-genome bisulfite sequencing or EPIC array)?
- Answer: A targeted approach is the recommended strategy for validation and clinical assay development. Use it when you have specific, pre-identified CpG sites or regions of interest (e.g., from a prior discovery study). It offers higher depth, lower cost per sample, and is more amenable to standardized clinical testing. A genome-wide approach (e.g., array or sequencing-based) is essential for novel biomarker discovery, screening, or when the epigenetic landscape of a disease is unknown.
FAQ 2: My targeted bisulfite sequencing results show inconsistent methylation percentages between technical replicates. What could be wrong?
- Answer: Inconsistency often stems from suboptimal bisulfite conversion or PCR bias. Follow this troubleshooting guide:
- Verify Bisulfite Conversion Efficiency: Include unmethylated and methylated control DNA in every conversion batch. Efficiency should be >99%. Low efficiency skews results.
- Check PCR Primer Design: Primers must be specific to bisulfite-converted DNA and avoid CpG sites. Re-design using dedicated software (e.g., MethPrimer) if necessary.
- Optimize PCR Conditions: Use a polymerase robust to uracil-rich templates (post-bisulfite). Perform gradient PCR to optimize annealing temperature.
- Review Sequencing Quality: For next-gen-based targeted panels, ensure adequate coverage depth (>500x is typical for validation).
FAQ 3: My genome-wide DNA methylation array data has a high background signal or fails quality control metrics.
- Answer: This is commonly due to sample degradation or technical artifacts.
- Assess DNA Quality: Use an integrity number (e.g., RIN/DIN) >7.0. Degraded DNA performs poorly on arrays.
- Check Hybridization Controls: Review the control probe intensities on the array. Abnormal profiles indicate failed hybridization.
- Normalization: Apply appropriate within-array (e.g., background subtraction) and between-array normalization (e.g., BMIQ, SWAN). Raw data is not analysis-ready.
- Remove Technical Artifacts: Use packages like
meffilorminfiin R to detect and correct for batch effects, stain intensity, and array row/column effects.
FAQ 4: How do I technically validate a candidate biomarker from a genome-wide discovery study?
- Answer: Follow a multi-stage technical validation protocol:
- Stage 1: Replication: Confirm the differential methylation in an independent sample cohort using the same genome-wide platform.
- Stage 2: Orthogonal Validation: Measure methylation at the candidate locus using a different, targeted technology (e.g., pyrosequencing, droplet digital PCR) on the same samples. This confirms the signal is not platform-specific.
- Stage 3: Assay Optimization: Develop and optimize a robust, cost-effective targeted assay (e.g., multiplex bisulfite-seq PCR) suitable for future clinical testing.
Data Presentation: Comparison of Key Methodologies
Table 1: Core Characteristics of Targeted vs. Genome-Wide Approaches
| Feature | Targeted Approaches (e.g., Bisulfite Pyrosequencing, ddPCR) | Genome-Wide Arrays (e.g., Illumina EPIC) | Genome-Wide Sequencing (e.g., WGBS, RRBS) |
|---|---|---|---|
| Primary Use Case | Validation, Clinical Assay Development | Discovery, Biomarker Screening | Discovery, Base-Resolution Mapping |
| Genomic Coverage | Pre-defined loci (10-1000 CpGs) | ~850,000 CpG sites (EPICv2) | Whole genome (WGBS) or CpG-rich regions (RRBS) |
| Typical Sample Throughput | High (96-384 well formats) | Medium (12-96 samples/batch) | Low to Medium (library prep constraints) |
| Cost per Sample | Low ($10-$50) | Medium ($200-$500) | High ($500-$2000+) |
| Data Analysis Complexity | Low to Moderate | High (Bioinformatics required) | Very High (Advanced bioinformatics) |
| Optimal for Technical Validation? | Yes (High precision, quantitative) | Less suitable (Proxy for validation) | Less suitable (Overkill for validation) |
Table 2: Technical Validation Success Rates from Recent Studies
| Validation Step | Typical Success Rate | Key Reason for Failure |
|---|---|---|
| Discovery (Array) to Replication (Array) | 60-80% | Underpowered discovery, biological heterogeneity |
| Replication (Array) to Orthogonal (Targeted) | 40-70% | Platform-specific bias, poor assay design for target |
| Orthogonal to Clinical Assay Development | 30-50% | Lack of analytical robustness, pre-analytical variables |
Experimental Protocols
Protocol 1: Orthogonal Validation via Bisulfite Pyrosequencing
Purpose: To quantitatively validate differential methylation at a candidate CpG site identified from a genome-wide study.
Steps:
- Design: Design PCR primers flanking (but not including) the target CpG(s) using PyroMark Assay Design software. Amplicon size should be <250 bp.
- Bisulfite Conversion: Convert 500 ng genomic DNA using the Zymo EZ DNA Methylation-Lightning Kit. Elute in 20 µL.
- PCR: Perform PCR using PyroMark PCR Master Mix. Cycle conditions: 95°C for 15 min; 45 cycles of (94°C 30s, 56°C 30s, 72°C 30s); 72°C for 10 min.
- Pyrosequencing: Prepare single-stranded PCR product using the PyroMark Q96 Vacuum Workstation. Sequence on a PyroMark Q96 ID system using the prescribed sequencing primer and dispensation order.
- Analysis: Calculate percentage methylation per CpG site directly from the pyrogram using PyroMark Q96 software.
Protocol 2: Genome-Wide Discovery Using the Illumina EPICv2 Array
Purpose: To perform unbiased screening for differentially methylated positions (DMPs) associated with a phenotype.
Steps:
- Sample QC: Use genomic DNA with 260/280 ratio ~1.8 and integrity (DIN) >7.0.
- Bisulfite Conversion: Use 250 ng of DNA and the Illumina Infinium HD Assay Methylation Protocol. Convert with sodium bisulfite.
- Amplification & Hybridization: Isothermally amplify converted DNA, fragment, and hybridize to the Illumina Infinium MethylationEPIC v2.0 BeadChip for 16-24 hours.
- Scanning: Wash the beadchip and scan on an Illumina iScan or NextSeq 550 system.
- Data Processing: Process IDAT files in R using
minfi. Perform background subtraction, dye bias correction (Noob), and between-sample normalization (e.g., Functional normalization). Probe filtering (remove cross-reactive, SNP-containing) is critical.
Visualizations
Diagram 1: Strategy Selection Workflow
Diagram 2: Technical Validation Pipeline
The Scientist's Toolkit: Research Reagent Solutions
| Item | Function | Example Product |
|---|---|---|
| DNA Bisulfite Conversion Kit | Converts unmethylated cytosines to uracil, leaving methylated cytosines intact, enabling methylation detection. | Zymo Research EZ DNA Methylation-Lightning Kit |
| Methylation-Specific PCR Master Mix | Contains polymerases optimized for amplifying bisulfite-converted, uracil-rich DNA templates. | Qiagen PyroMark PCR Master Mix |
| Infinium Methylation BeadChip | Genome-wide array for simultaneous interrogation of methylation at 850,000+ CpG sites. | Illumina Infinium MethylationEPIC v2.0 |
| Methylation Spike-In Controls | Pre-methylated and unmethylated DNA controls to monitor bisulfite conversion efficiency and assay performance. | MilliporeSigma CpGenome Universal Methylated DNA |
| Pyrosequencing System & Reagents | Provides quantitative, sequence-based analysis of methylation at individual CpG sites in a short amplicon. | Qiagen PyroMark Q96 ID System & Reagents |
| Digital PCR Master Mix for Methylation | Enables absolute quantification of methylated vs. unmethylated alleles without a standard curve. | Bio-Rad ddPCR Supermix for Probes (No dUTP) |
Solving Common Challenges: Pre-analytics, Data Noise, and Batch Effects in Epigenetic Analysis
Troubleshooting Guides & FAQs
Q1: We see inconsistent methylation values between replicate samples. Could the type of blood collection tube be a factor? A: Yes, absolutely. Different anticoagulants in collection tubes can significantly impact DNA integrity and methylation stability. EDTA tubes are generally preferred for epigenetic studies. Heparin tubes can inhibit downstream enzymatic reactions in PCR and bisulfite conversion, leading to quantification errors and bias. Cell-free DNA BCT tubes contain preservatives that stabilize cells but may introduce their own biases for methylation analysis. For consistent results, validate your protocol with a single tube type across the entire study.
Q2: What is the maximum allowable delay time between blood collection and plasma/lymphocyte separation for reliable methylation analysis? A: Delay time is a critical pre-analytical variable. For DNA methylation studies, especially on labile loci, processing within a narrow window is essential. See the quantitative summary below.
Q3: How does long-term storage of extracted DNA affect bisulfite conversion efficiency and subsequent methylation measurements? A: Long-term storage conditions are crucial. DNA should be stored in TE buffer or similar, aliquoted to avoid freeze-thaw cycles, and kept at -80°C. Degraded or fragmented DNA from improper storage can lead to incomplete bisulfite conversion and preferential amplification of less-converted fragments, skewing results.
Q4: Our bisulfite-converted DNA yields are low. Could pre-analytical factors be responsible? A: Yes. Pre-analytical factors causing DNA degradation (e.g., long delay times at room temperature, improper tube type) directly reduce the amount of intact DNA available for conversion. Degraded DNA is also less efficiently recovered during the desulfonation and purification steps of the bisulfite protocol.
Table 1: Impact of Delay Time to Processing on DNA Methylation Stability
| Sample Type | Room Temp Delay | Effect on Global Methylation | Effect on Specific Loci |
|---|---|---|---|
| Whole Blood (EDTA) | ≤ 2 hours | Stable (<2% deviation) | Stable for most loci |
| Whole Blood (EDTA) | 6-8 hours | Mild global hypomethylation (~5-8% decrease) | Significant drift in immune-related genes |
| Whole Blood (Heparin) | >4 hours | Moderate to severe drift | Highly variable, PCR inhibition likely |
| Plasma for cfDNA | >3 hours | Increased background, lower yield | False-positive/negative signals possible |
Table 2: Recommended Storage Conditions for Methylation Analysis
| Material | Short-Term (≤1 month) | Long-Term (>1 month) | Key Risk |
|---|---|---|---|
| Whole Blood (EDTA) | 4°C | Not recommended; separate and freeze | Cellular degradation, leukocyte profile shift |
| Isolated DNA | -20°C or -80°C | -80°C, aliquoted | Strand breaks, deamination over time |
| Bisulfite-Converted DNA | -20°C (dark) | -80°C, aliquoted (dark) | Desulfonation, degradation |
| FFPE Tissue Sections | Room temp (dark, dry) | 4°C or -20°C for blocks | Oxidative damage, cross-linking |
Experimental Protocols
Protocol 1: Validating Collection Tube Compatibility for Methylation Studies
- Sample Collection: Draw blood from a single healthy donor into multiple tube types (e.g., K2EDTA, Sodium Heparin, Cell-Free DNA BCT, PAXgene).
- Processing: Split each tube. Process one set immediately (within 2 hrs) for PBMC and plasma isolation. Hold the second set at room temperature for 24 hours before identical processing.
- DNA Extraction: Use a silica-column based method for all samples to minimize kit variability.
- Analysis: Perform pyrosequencing or targeted bisulfite sequencing on 3-5 control loci known to be stable and labile. Calculate % methylation and compare across tube types and delay times using ANOVA.
Protocol 2: Assessing the Impact of Freeze-Thaw Cycles on Bisulfite-Converted DNA
- Preparation: Extract high-quality DNA from a cell line. Perform a large-scale bisulfite conversion (using a standardized kit) and purify.
- Aliquoting: Aliquot the converted DNA into single-use volumes.
- Cycling: Subject aliquots to 0, 1, 3, 5, and 7 freeze-thaw cycles (cycling between -80°C and room temperature water bath until just thawed).
- Quantification: Measure DNA concentration and purity (A260/A280) after each cycle.
- Functional Assay: Perform a quantitative Methylation-Specific PCR (qMSP) for a control gene on all aliquots in the same run. Compare Ct values and amplicon melt curves.
Visualizations
Pre-analytical Variables Impact on Methylation Workflow
Pathway to Methylation Measurement Bias
The Scientist's Toolkit: Research Reagent Solutions
| Item | Function & Importance for Methylation Studies |
|---|---|
| K2EDTA Blood Collection Tubes | Preferred anticoagulant; minimizes enzymatic inhibition for downstream molecular assays. |
| Cell-Free DNA BCT Tubes | Stabilizes nucleated blood cells for up to 14 days at room temp; useful for remote collections but requires validation. |
| RNAlater or DNA/RNA Shield | Tissue preservative that rapidly penetrates to stabilize nucleic acids and epigenomic profiles at collection. |
| Magnetic Bead-Based DNA Purification Kits | Provide high-quality, consistent DNA yields with minimal organic contaminant carryover. |
| Commercial Bisulfite Conversion Kits | Ensure efficient, standardized conversion with optimized incubation times and DNA protection buffers. |
| Methylated/Unmethylated Control DNA | Essential for bisulfite conversion efficiency calculations and assay validation in every run. |
| PCR Inhibitor Removal Beads/Columns | Critical for samples with potential heparin carryover or other inhibitors from collection tubes. |
| DNA Lo-Bind Tubes | Reduce DNA adsorption to tube walls during storage, especially for low-concentration and bisulfite-converted DNA. |
Within the framework of technical validation for epigenetic biomarker research, ensuring high bisulfite conversion efficiency is paramount. Incomplete conversion of unmethylated cytosines to uracils leads to false-positive methylation signals, compromising data integrity and subsequent clinical or translational conclusions. This technical support center provides targeted guidance for measuring, troubleshooting, and establishing quality thresholds for bisulfite conversion.
Measuring Conversion Efficiency
Key Methodologies
Accurate measurement is the first step in validation. The following table summarizes common quantitative and qualitative methods.
Table 1: Methods for Assessing Bisulfite Conversion Efficiency
| Method | Principle | Readout | Ideal Threshold | Pros/Cons |
|---|---|---|---|---|
| Methylated/Unmethylated Control DNA | Parallel conversion of fully methylated and unmethylated DNA standards. | PCR & sequencing of control loci. | ≥99% for unmethylated control; ≥95% for methylated control. | Gold standard; quantitative; requires specific controls. |
| CpG-less Region PCR | Amplification of a genomic region devoid of CpG sites. | Successful PCR indicates complete conversion (C→U). | Qualitative pass/fail (successful amplification). | Simple, quick; not quantitatively precise. |
| Pyrosequencing of Non-CpG Cytosines | Quantification of C→T conversion at non-CpG cytosines (e.g., CHH sites). | % T at sequenced non-CpG sites. | ≥99% conversion rate. | Quantitative, uses experimental DNA; requires specific assay design. |
| Droplet Digital PCR (ddPCR) | Absolute quantification of converted vs. unconverted alleles at specific loci. | Copies/μL of converted/unconverted DNA. | ≥99.5% conversion efficiency. | Highly precise, sensitive; expensive equipment. |
Detailed Protocol: Pyrosequencing for Non-CpG Conversion Efficiency
This protocol provides a quantitative measure directly from your sample DNA.
- Assay Design: Design PCR primers to amplify a 100-300bp region containing at least 3-5 non-CpG cytosines (CHH or CHG, where H = A, T, or C). One primer is biotinylated.
- PCR Amplification: Perform PCR on the bisulfite-converted DNA.
- Pyrosequencing Preparation: Bind the biotinylated PCR product to streptavidin-sepharose beads. Prepare the single-stranded template using the Pyrosequencing Vacuum Prep Tool.
- Sequencing Run: Load the sequencing primer targeting a non-CpG site onto the Pyrosequencer. Program the dispensation order to sequence the non-CpG cytosines.
- Analysis: Using the instrument software (e.g., PyroMark Q24), calculate the percentage of thymine (T) incorporation at each non-CpG cytosine position. The average %T across all assessed sites equals the conversion efficiency. For example, 99.2% T indicates 99.2% efficiency.
Troubleshooting Guides & FAQs
Q1: My conversion efficiency is consistently low (<95%) across multiple samples. What are the primary causes?
- A: This is a systemic issue. Key culprits include:
- Degraded Bisulfite Reagent: Sodium bisulfite solution degrades upon exposure to air, light, or moisture. Always use fresh aliquots and check solution pH (should be ~5.0).
- Insufficient Denaturation: Incomplete DNA denaturation before conversion shields cytosines. Ensure incubation temperature is precisely 95-98°C and use high-quality thermal cyclers.
- Suboptimal Incubation Time/Temperature: The conversion reaction (typically 50-65°C) must be long enough (often 90-120 min). Refer to kit specifications but verify with controls.
- Inadequate Desulfonation: Residual bisulfite salts inhibit downstream reactions and can cause artifactual deamination during PCR. Ensure proper alkaline desulfonation step (fresh NaOH, correct incubation time).
Q2: My conversion efficiency is highly variable between samples in the same run.
- A: This points to sample-specific or procedural inconsistency.
- DNA Quality/Purity: Contaminants (e.g., ethanol, salts, proteins) inhibit conversion. Re-purity DNA, check A260/A280 (1.8-2.0) and A260/A230 (>1.8) ratios.
- DNA Overloading/Underloading: Exceeding kit capacity leads to incomplete conversion. Precisely quantify input DNA (e.g., with Qubit) and stay within the recommended range (often 10-500 ng).
- Incomplete Mixing or Pellet Loss: Ensure bisulfite reagent is thoroughly mixed with DNA. During purification, take care not to disturb the DNA pellet/binding column.
Q3: My unmethylated control passes, but my methylated control shows low apparent methylation (<95%). What does this mean?
- A: This indicates over-conversion or DNA degradation. Excessive heat, time, or acid pH during conversion can cause deamination of methylated cytosines (5mC to T), leading to false low methylation values. It can also fragment DNA.
- Action: Shorten conversion incubation time, verify incubation temperature, and assess DNA fragment size post-conversion (e.g., Bioanalyzer).
Q4: How should I set quality thresholds for my biomarker validation study?
- A: Thresholds are study-specific but must be justified.
- Define Minimum Efficiency: Based on your detection method's sensitivity. For most quantitative assays (pyrosequencing, ddPCR), ≥99% is standard. For exploratory sequencing, ≥98% may be acceptable.
- Use Statistical Process Control: Run controls in every batch. Calculate the mean and standard deviation (SD) of conversion efficiency across 10-20 successful runs. Set an alert threshold at mean - 2SD and a rejection threshold at mean - 3SD.
- Document & Report: Explicitly state the threshold and validation method in your thesis and publications. Reject any sample or batch failing the threshold.
The Scientist's Toolkit: Research Reagent Solutions
Table 2: Essential Materials for Bisulfite Conversion QC
| Item | Function & Importance | Example/Notes |
|---|---|---|
| Fully Unmethylated Control DNA | Provides the benchmark for maximum possible conversion (C→U). Critical for threshold setting. | Often derived from whole genome amplification or specific cell lines. |
| Fully Methylated Control DNA | Assesses specificity; ensures the conversion process does not deaminate 5mC (over-conversion). | Treated with M.SssI methylase. |
| Commercially Available Bisulfite Kits | Standardized, optimized reagents with protocols for consistent performance. | EZ DNA Methylation kits (Zymo), Epitect Fast (Qiagen), MethylCode (Thermo Fisher). |
| PCR Primers for CpG-less Regions | Quick, qualitative check for complete conversion. | Target mitochondrial DNA or designed genomic regions. |
| Pyrosequencing Assay for Non-CpG Sites | Enables quantitative efficiency measurement directly on sample DNA. | Custom designed; key for formal validation. |
| Droplet Digital PCR (ddPCR) Assay | Provides ultra-precise, absolute quantification of conversion efficiency. | Ideal for validating low-input or precious samples. |
| DNA Integrity Analyzer | Assesses DNA fragmentation post-conversion, a sign of over-conversion/degradation. | Agilent Bioanalyzer/TapeStation, Fragment Analyzer. |
| Fluorescent DNA Quantitation Kit | Accurate DNA concentration measurement post-conversion for downstream normalization. | Qubit dsDNA HS Assay (Thermo Fisher). |
Troubleshooting Guides and FAQs
Q1: After applying RMA to my microarray data, my positive control genes show low expression. What went wrong?
A: This often indicates over-aggressive background correction or normalization. RMA's model can sometimes over-correct. First, verify your raw data (.CEL files) quality with the simpleaffy package in R. Check the AffyRNAdeg plot; a slope > 1 suggests RNA degradation. For a targeted fix, re-run the analysis using the GCRMA method, which incorporates sequence-specific background adjustment, or switch to the MAS 5.0 algorithm with a higher scaling target (e.g., 500) to preserve signal dynamics. If the issue persists, manually inspect the probe-level data for your controls to confirm they are above background intensity.
Q2: How do I choose between quantile and loess normalization for my two-color array experiment?
A: The choice depends on your assumption of global vs. feature-specific dye bias. Use quantile normalization if you assume the overall distribution of gene expression is similar between your two channels (Cy3 and Cy5). This method forces the intensity distributions to be identical. Use within-array loess normalization (print-tip loess) if you suspect spatial or intensity-dependent dye bias varies across the slide. Protocol: In R, use normalizeWithinArrays(your_MAList, method="loess", layout=your_layout) from the limma package for loess. For quantile, use normalizeBetweenArrays(your_MAList, method="quantile"). Always perform visual diagnostics with maPlot() before and after to assess correction.
Q3: My RNA-seq data shows batch effects correlated with sequencing depth after TMM normalization. How can I resolve this?
A: TMM (Trimmed Mean of M-values) normalizes for library composition but not for technical batch effects. You need to integrate an additional batch correction step. Recommended Workflow: 1) Normalize counts using TMM (e.g., in edgeR: calcNormFactors(your_DGEList, method="TMM")). 2) Convert to log2-counts-per-million (logCPM) using cpm(your_DGEList, log=TRUE). 3) Apply removeBatchEffect() from the limma package, specifying your batch factor (e.g., sequencing run date). Critical: Do not use the batch-corrected data for differential expression p-value calculation; use it for visualization and clustering. Retain the original normalized counts for statistical testing, including batch as a covariate in your linear model.
Q4: What is the best practice for background correction in ChIP-seq data analysis for histone marks?
A: For broad marks like H3K27me3, local background estimation is superior to global. Avoid using input DNA as a simple subtraction. Instead, use a peak caller with sophisticated background modeling. Protocol: Use MACS2 with the --broad flag and a loose p-value cutoff (e.g., -p 1e-3). Key steps: macs2 callpeak -t ChIP.bam -c Input.bam -f BAM -g hs --broad -p 1e-3 -n output_name. For normalization, use the "deepTools" bamCompare function with the --operation ratio and --scaleFactorsMethod set to readCount to generate a normalized bigWig file for visualization. This corrects for background and sequencing depth simultaneously.
Q5: How should I handle zero or low counts in methylation array data (e.g., Illumina EPIC) before beta-value calculation?
A: Adding an offset is standard to avoid undefined values and stabilize variance. The minfi package's getBeta function uses a default offset of 100. However, for differential analysis, it's better to use M-values calculated from raw methylated/unmethylated intensities. Protocol: Use preprocessNoob() in minfi for background correction and dye-bias equalization. Then, extract beta values with: getBeta(preprocessed_RGSet). For statistical testing, convert to M-values: getM(preprocessed_RGSet). If you have many zeros, consider using the missMethyl package's impute.knn function on the M-values before proceeding.
Key Experimental Protocols
Protocol 1: Microarray Preprocessing with RMA and Quality Control
Method: Robust Multi-array Average (RMA) for Affymetrix GeneChips.
- Background Correction: Apply the RMA convolution model to adjust for optical noise and non-specific binding using the
justRMA()function in theaffypackage orrma()inoligo. - Normalization: Perform quantile normalization across all arrays to make probe intensity distributions identical.
- Summarization: Fit a robust linear model (median polish) to combine multiple probe intensities for each probe set into a single expression value. QC Step: Generate an NUSE (Normalized Unscaled Standard Error) plot. Values consistently >1.05 for an array indicate poor quality. Generate an RLE (Relative Log Expression) plot; median values far from zero indicate a problematic array.
Protocol 2: RNA-seq Normalization and Differential Expression with DESeq2
Method: Median-of-ratios normalization and negative binomial GLM.
- Background/Base Correction: The
DESeq2pipeline begins by estimating size factors for each library. For each gene, it calculates the geometric mean across all samples. The size factor for a sample is the median of the ratios of the sample's counts to these geometric means. - Modeling: A negative binomial generalized linear model is fit, and dispersion is estimated, inherently accounting for mean-variance relationship.
- Statistical Testing: Wald test or Likelihood Ratio Test is performed on model coefficients. Code:
dds <- DESeqDataSetFromMatrix(countData, colData, ~condition); dds <- DESeq(dds); res <- results(dds).
Protocol 3: Methylation Array Preprocessing with Functional Normalization
Method: Functional normalization for Illumina Infinium Methylation BeadChips.
- Background Correction: Use the
noob(normal-exponential out-of-band) method inminfito correct for dye bias and background signal using the Infinium I/II probe design. - Normalization: Perform functional normalization (
preprocessFunnorm). This method uses control probe principal components (PCs) to remove unwanted technical variation, which is more effective than quantile normalization for methylation data as it preserves biological variation. - QC: Plot the median intensity of methylated vs. unmethylated channels; samples should cluster tightly.
Table 1: Comparison of Common Normalization Methods
| Method | Platform | Principle | Best For | Key Software/R Package |
|---|---|---|---|---|
| RMA | Affymetrix 3' Arrays | Convolution BG correction, Quantile norm, Median polish summarization | Single-species gene expression studies | affy, oligo |
| GCRMA | Affymetrix 3' Arrays | Incorporates sequence info for BG, then RMA | When GC-content bias is suspected | gcrma |
| TMM | RNA-seq | Scales library sizes based on a trimmed mean of log expression ratios | Most RNA-seq DGE experiments | edgeR, DESeq2 (variant) |
| Median-of-Ratios | RNA-seq | Estimates size factors from geometric means | Paired or multi-condition RNA-seq | DESeq2 |
| Upper Quartile | RNA-seq | Scales counts using the upper quartile of counts | Experiments with many differentially expressed genes | edgeR (option) |
| Quantile | Microarrays, Methylation | Forces all array intensity distributions to be identical | Homogeneous sample sets | limma, preprocessCore |
| Functional Norm | Methylation Arrays | Regresses out variation using control probe PCs | Illumina 450K/EPIC arrays with batch effects | minfi (preprocessFunnorm) |
| Cyclic LOESS | Two-color arrays | Corrects intensity-dependent dye bias per array/print-tip | Dual-label microarray experiments | limma |
Table 2: Troubleshooting Scenarios and Solutions
| Problem | Likely Cause | Diagnostic Check | Recommended Solution |
|---|---|---|---|
| Low signal for all probes on one array | Scanner gain setting, poor hybridization | View raw intensity image; check average raw intensity vs others. | If globally low, apply linear scaling normalization (e.g., in limma). If localized, discard array. |
| High background in sequencing data | Adapter contamination, poor library prep | FastQC report: overrepresented sequences, per base sequence content. | Trim adapters with Trim Galore! or cutadapt. Re-assess library prep protocol. |
| Batch effect in PCA plot post-norm | Uncorrected technical batch | Color PCA plot by batch variable (date, lane). | Apply ComBat-seq (for counts) or removeBatchEffect (logCPM) before exploratory analysis. |
| Inconsistent replicate correlation | Biological outlier, sample swap | Calculate inter-replicate Pearson/Spearman correlation. | Check sample metadata and raw data for the outlier. Consider robust normalization methods. |
| Beta values clipped at 0 or 1 (Methylation) | Extreme background/very low signal | Density plot of raw methylated/unmethylated intensities. | Use noob preprocssing; switch to M-values for analysis; consider using SeSAMe pipeline. |
Diagrams
Diagram 1: Microarray Data Preprocessing Workflow
Diagram 2: RNA-seq Differential Expression Analysis Pipeline
Diagram 3: Methylation Array Data Processing Paths
The Scientist's Toolkit: Research Reagent Solutions
| Item | Function in Normalization/Correction | Example Product/Kit |
|---|---|---|
| RNA Spike-In Controls | Equimolar mixes of exogenous transcripts added pre-library prep to monitor technical variation, validate normalization (e.g., ERCC for arrays, SIRV for RNA-seq). | Thermo Fisher ERCC Spike-In Mix, Lexogen SIRV Set 4 |
| Methylation Spike-Ins | Pre-methylated and unmethylated human DNA controls to assess bisulfite conversion efficiency and normalization accuracy. | ZymoResearch EZ DNA Methylation Spike-In |
| UMI Adapters | Unique Molecular Identifiers (UMIs) incorporated during library prep to correct for PCR duplication bias in sequencing, improving count accuracy. | Illumina TruSeq UMI Adapters, NEBNext Multiplex Oligos for Illumina (UMI) |
| Control Probes (Arrays) | Built-in on array platforms for background estimation, spatial correction, and normalization (e.g., Affymetrix hybridization controls, Illumina methylation control probes). | Inherent to Affymetrix GeneChip, Illumina BeadChip |
| Normalization Standards | Genomic DNA or synthetic oligonucleotides used to create standard curves or calibrate cross-platform measurements. | Microarray Quality Control (MAQC) Consortium reference RNA (e.g., Universal Human Reference RNA) |
| Bisulfite Conversion Kit | Critical for methylation studies; high conversion efficiency (>99%) minimizes background noise and false positives. | ZymoResearch EZ DNA Methylation Kit, Qiagen EpiTect Fast Kit |
| Library Quantification Standards | For accurate library quantification by qPCR (not just fluorometry), ensuring equimolar pooling and reducing batch effects from loading. | KAPA Library Quantification Kit, Illumina Library Quantification Kit |
Troubleshooting Guides & FAQs
Q1: My PCA plot shows clear clustering by sample processing date, not by experimental condition. What does this indicate and what should I do first?
A: This is a classic sign of a strong batch effect. Your first step is to validate the observation statistically using a method like PERMANOVA on the distance matrix to confirm the variance explained by "Date" is significant. Do not proceed with differential analysis until this is corrected. Immediately audit your lab protocol for any changes in reagents, instrument calibration, or technician on those dates. For correction, apply ComBat (if you have many features and samples) or limma's removeBatchEffect function, then re-run the PCA to assess improvement.
Q2: After applying ComBat, my negative control regions (e.g., non-differentially methylated regions) now show apparent differential signals. What went wrong?
A: This is likely over-correction, often due to mis-specifying the model or applying batch correction when batches are confounded with the biological condition. If all samples from Condition A were processed in Batch 1 and all from B in Batch 2, ComBat cannot disentangle the two. Stop. You must redesign the experiment. The only statistical recourse is to use a surrogate variable analysis (SVA) method like sva::ComBat with the model parameter or svaseq to estimate and adjust for latent variables, but this requires extreme caution and validation with positive/negative controls.
Q3: I have a "batches-of-one" problem due to sample preparation over many days. Which tools can handle this?
A: This is a severe design flaw, but methods exist for post-hoc mitigation. Tools designed for latent variable estimation are essential:
- RUVseq/RUVcorr: Uses negative control genes/sites (empirical or spike-ins) to estimate factors of unwanted variation.
- SVA (Surrogate Variable Analysis): Identifies unmodeled factors directly from the data.
- Harmony: An integration algorithm that can project individual samples into a corrected space.
Your protocol must include consistent use of internal controls (e.g., unmethylated spike-ins for bisulfite-seq) in every sample for methods like RUV to work reliably.
Q4: My negative control samples from the same source cluster separately in MDS plots based on their batch. How can I use this quantitatively?
A: This is a powerful diagnostic. Calculate the Median Absolute Difference (MAD) of your negative controls between batches versus within batches.
| Metric | Batch 1 vs Batch 2 (Within-Batch MAD) | Batch 1 vs Batch 2 (Between-Batch MAD) | Acceptable Threshold |
|---|---|---|---|
| DNAm Beta Value (450k/EPIC) | 0.015 | 0.032 | Between-Batch MAD < 2x Within-Batch MAD |
| ChIP-seq log2(Peak Height) | 0.25 | 0.89 | Between-Batch MAD < 3x Within-Batch MAD |
| ATAC-seq log2(Read Count) | 0.31 | 1.15 | Between-Batch MAD < 3x Within-Batch MAD |
If the between-batch MAD exceeds the threshold (as in the example data), batch correction is mandatory. Use the control samples to tune the parameters (k for RUV, number of SVs for SVA) by minimizing their between-batch variance post-correction.
Key Experimental Protocols for Batch Effect Mitigation
Protocol 1: Randomized Block Design for Multi-Omics Studies
- Planning: For each biological condition (e.g., Case/Control), divide your samples into n groups equal to the number of processing batches you anticipate.
- Randomization: Use a random number generator to assign an equal number of samples from each condition to each batch. Record this assignment.
- Processing: Include a universal reference sample (e.g., commercial methylated DNA, pooled from all conditions) in every batch as a longitudinal control.
- QC: Generate a pre-analytical PCA. The first principal component (PC1) should not correlate significantly with batch ID (p > 0.05, linear model).
Protocol 2: Using Spike-In Controls for Bisulfite Sequencing (BS-seq)
- Reagent Preparation: Dilute commercially available unmethylated (e.g., Lambda phage) and fully methylated DNA to a known concentration.
- Spike-In: Add exactly 0.5% (by mass) of each spike-in control to every sample's genomic DNA prior to bisulfite conversion and library prep.
- Post-Seq Analysis: Map reads to the spike-in genomes separately. Calculate the observed methylation percentage for the methylated spike-in.
- Calibration: If the observed methylation deviates from the expected 100% (e.g., batch average is 92% vs 95%), use this deviation factor to globally adjust your sample's methylation calls for that batch.
Protocol 3: Post-Hoc Assessment with Negative Control Regions
- Identify Controls: From public data (e.g., Epigenomics Roadmap), curate a set of genomic loci (e.g., 100-200 probes/regions) known to be invariant across your tissue/cell type of interest.
- Extract Data: Isolate the methylation value or read count for these control regions in your dataset.
- Statistical Test: Perform a one-way ANOVA with batch as the factor on these control regions. A significant p-value (p < 0.01) indicates persistent batch effects after correction.
- Iterate: Return to correction tool parameter adjustment until the control-region ANOVA is non-significant.
Visualization
Title: Batch Effect Management & Correction Workflow
Title: Confounded vs Randomized Experimental Design
Title: Common Statistical Tools for Batch Effect Correction
The Scientist's Toolkit: Research Reagent Solutions
| Item | Function & Rationale | Example Product/Catalog |
|---|---|---|
| Unmethylated Lambda Phage DNA | Spike-in control for BS-seq. Used to assess bisulfite conversion efficiency and correct for inter-batch variation in conversion rates. | Promega, Cat# D1521 |
| Fully Methylated Human Genomic DNA | Positive control for methylation assays. Provides a baseline for 100% expected signal, used to calibrate and normalize across batches. | Zymo Research, Cat# D5011 |
| Universal Methylation BeadChip Reference | A pre-characterized, stable human DNA sample for array platforms. Run in every batch to directly measure technical drift. | Illumina, Infinium HD Reference (Not sold separately, often from a specific donor like "GSM3181412") |
| Pooled Sample Reference | A pool of equal amounts of all experimental samples created at project start. Aliquoted and run in every processing batch to anchor batch correction algorithms. | Must be created in-house. |
| EPIC/850k Methylation BeadChip | Array platform with extensive coverage. Includes built-in control probes for staining, hybridization, extension, and specificity to monitor each technical step. | Illumina, Infinium MethylationEPIC Kit |
| Synchronization Cocktail (for cell-based studies) | Ensures cells from different batches/sacrifices are harvested at the same cell cycle stage, removing a major biological confounder of batch. | Palbociclib (CDK4/6i) + Aphidicolin |
| Commercial Preserved Blood Kit | Standardizes sample collection and initial preservation for translational studies, minimizing pre-analytical batch effects from collection sites. | PAXgene Blood DNA Tube |
Troubleshooting Guides & FAQs
FAQ 1: Why is my cfDNA extraction yield from plasma lower than expected?
- Answer: Low cfDNA yield is common and often stems from pre-analytical variables. Key factors include:
- Blood Collection & Processing: Delays in plasma processing (>2 hours) can lead to leukocyte lysis, contaminating the sample with high-molecular-weight genomic DNA and diluting the cfDNA fraction. Always use cell-stabilizing blood collection tubes (e.g., Streck, PAXgene) and process within the recommended timeframe.
- Plasma Volume: Starting with less than 3-4 mL of plasma increases the impact of sample loss. For low-input protocols, optimize by scaling up the input volume, not by eluting in a smaller volume.
- Extraction Kit Selection: Not all kits perform equally with low-concentration samples. Use kits specifically validated for low-abundance cfDNA and containing efficient carrier molecules (like poly-A RNA) to prevent adsorption losses.
FAQ 2: How can I improve library preparation success from degraded FFPE DNA?
- Answer: Archival FFPE tissue DNA is often fragmented and cross-linked. Optimize by:
- Pre-Assay QC: Use a fluorescence-based assay (e.g., Qubit) for concentration and a multiplex qPCR or Fragment Analyzer to assess fragment size distribution and amplifiability. Do not rely on A260/280 alone.
- DNA Repair & Enzymatic Clean-Up: Employ a combination of enzymatic steps: uracil-DNA glycosylase (UDG) to treat deamination-induced cytosine-to-uracil artifacts, plus repair mixes to fix nicks and gaps.
- Library Construction Chemistry: Use hybridization capture-based or multiplex PCR-based approaches tailored for degraded DNA, as they perform better than traditional ligation-based methods on short fragments (<150 bp).
FAQ 3: What are the best practices for bisulfite conversion of low-input samples to minimize DNA loss?
- Answer: Bisulfite conversion is harsh and causes significant DNA fragmentation and loss. For low-input samples (e.g., <50 ng):
- Use High-Recovery Kits: Select kits designed for low-input conversion, often incorporating post-conversion cleanup beads with enhanced binding properties for single-stranded DNA.
- Optimize Elution Volume: Elute in a smaller volume (e.g., 10-15 µL) to increase concentration, but avoid over-drying the beads which reduces elution efficiency.
- Incorplicate a Carrier: If permitted by downstream assays, use a defined, non-interfering carrier (like salmon sperm DNA) during conversion to reduce tube adsorption, but confirm it does not bias amplification.
FAQ 4: My qPCR or NGS data from low-input samples shows high technical variability. How can I improve reproducibility?
- Answer: High variability stems from stochastic sampling effects and pipetting errors at low template concentrations.
- Increase Technical Replicates: Perform at least 4-6 qPCR replicates per sample to accurately measure the mean Cq value and variance.
- Use Digital PCR (dPCR): For absolute quantification of biomarkers (e.g., methylation density at a specific locus), adopt dPCR. It partitions the sample into thousands of reactions, mitigating the impact of template concentration fluctuations and providing absolute counts without a standard curve.
- Pre-Ampification (with caution): For targeted NGS panels, consider a limited-cycle (4-6 cycles) targeted pre-amplification step to increase library yield, but be aware it can exacerbate allelic bias and must be rigorously validated.
FAQ 5: How do I validate that my optimized low-input protocol is technically robust?
- Answer: Technical validation within an epigenetic biomarker thesis requires a systematic assessment of key performance parameters. Design experiments to measure:
- Limit of Detection (LoD): The lowest input amount at which the target (e.g., methylated allele) is detected ≥95% of the time.
- Precision: Both repeatability (same operator, day, instrument) and reproducibility (different days, operators) measured via Coefficient of Variation (CV%) for quantitative outputs.
- Linearity: Assess if the measured value (e.g., % methylation) is proportional to the expected value across the working range (e.g., from 1% to 100% methylated control mixtures).
Experimental Protocols
Protocol 1: Optimized Low-Input cfDNA Extraction from Plasma
- Materials: Cell-free DNA BCT tubes, double-spin plasma preparation protocol, magnetic stand, low-input cfDNA extraction kit (e.g., QIAamp MinElute ccfDNA, Circulating Nucleic Acid Kit).
- Method:
- Collect blood in cell-stabilizing tubes. Process within 6 hours (if stored at room temp) or 24 hours (if stored at 4°C).
- Centrifuge at 1600-1900 RCF for 20 min at 4°C. Transfer supernatant to a fresh tube.
- Conduct a second, high-speed centrifugation at 16,000 RCF for 20 min at 4°C to remove residual cells.
- Transfer the final plasma supernatant (at least 4 mL) to a fresh tube. Proceed with kit-specific extraction protocol, ensuring thorough mixing with lysis/binding buffer.
- Elute in 20-25 µL of low-EDTA TE buffer or nuclease-free water. Preheat elution buffer to 60°C for higher yield.
- QC: Quantify using a high-sensitivity dsDNA assay (e.g., Qubit dsDNA HS). Assess fragment profile on a high-sensitivity bioanalyzer chip (e.g., Agilent High Sensitivity DNA kit).
Protocol 2: Degraded FFPE DNA Repair and Library Prep for Targeted Bisulfite Sequencing
- Materials: FFPE DNA (10-50 ng), DNA repair enzyme mix (e.g., PreCR Repair Mix, NEBNext FFPE DNA Repair), uracil-DNA glycosylase, bisulfite conversion kit (e.g., EZ DNA Methylation-Lightning Kit), low-input bisulfite-seq library kit (e.g., Accel-NGS Methyl-Seq).
- Method:
- Repair: Incubate FFPE DNA with repair enzymes at 20°C for 20 min, then 70°C for 10 min. Clean up with 1.8x SPRI beads.
- UDG Treatment (Optional for ancient/deamination-prone samples): Incubate with UDG at 37°C for 30 min.
- Bisulfite Conversion: Convert purified DNA using the low-input protocol of a dedicated kit.
- Library Preparation: Use a library kit that includes a built-in bisulfite-converted DNA amplification step. Follow manufacturer's instructions, typically involving adapter ligation to converted single-stranded DNA and a low-cycle (4-8) PCR with indexing primers.
- Target Enrichment: Perform hybridization capture using biotinylated RNA probes designed for bisulfite-converted sequences.
- QC: Assess final library concentration (Qubit) and size distribution (Fragment Analyzer). Validate methylation status with control loci via pyrosequencing or dPCR.
Table 1: Comparison of cfDNA Extraction Kits for Low-Input (<5 mL Plasma) Applications
| Kit Name | Recommended Min. Plasma Input | Avg. Yield from 3 mL Plasma* | Carrier Molecule | Bisulfite Conversion Compatible? | Avg. Cost per Sample |
|---|---|---|---|---|---|
| Kit A | 1 mL | 8.5 ng | Poly-A RNA | Yes | $$$ |
| Kit B | 2 mL | 12.1 ng | Protein-based | Yes | $$ |
| Kit C | 3 mL | 15.7 ng | Acrylic Copolymer | Limited | $ |
| Yields are approximate and highly dependent on donor and plasma preparation. |
Table 2: Performance Metrics for Low-Input Methylation Assay Validation
| Parameter | Target (e.g., SEPT9 Methylation) | Acceptable Criterion | Result from Validation Study |
|---|---|---|---|
| Limit of Detection (LoD) | Methylated Allele Count | ≥95% detection rate | 6 copies of methylated allele |
| Repeatability (Intra-assay CV%) | Methylation Ratio (% ) | CV% < 10% | 5.2% |
| Reproducibility (Inter-assay CV%) | Methylation Ratio (% ) | CV% < 15% | 9.8% |
| Linearity (R²) | 1% - 50% Methylated Controls | R² > 0.98 | 0.995 |
Diagrams
Low-Input cfDNA Methylation Analysis Workflow
Troubleshooting High Variability in Low-Input Assays
The Scientist's Toolkit
Table: Essential Research Reagent Solutions for Low-Input/ Degraded Epigenetic Analysis
| Item | Function | Key Consideration for Low-Input/Degraded Samples |
|---|---|---|
| Cell-Free DNA BCT Tubes | Stabilizes nucleated blood cells to prevent genomic DNA contamination of plasma. | Critical for pre-analytical consistency; choose based on validated hold times. |
| Magnetic SPRI Beads | Size-selective nucleic acid purification and cleanup. | Use high-recovery formulations. Optimize bead-to-sample ratio for short fragments. |
| High-Sensitivity DNA Assay Kits | Fluorometric quantification of low-concentration DNA (e.g., Qubit HS). | Essential for accurate input measurement; superior to UV absorbance for dilute samples. |
| DNA Restoration Enzyme Mix | Repairs nicks, gaps, and deamination damage in FFPE/degraded DNA. | Improves library complexity and yield from suboptimal samples. |
| Uracil-DNA Glycosylase (UDG) | Removes uracil bases resulting from cytosine deamination. | Reduces C>T artifacts in ancient DNA or long-term FFPE samples before conversion. |
| Bisulfite Conversion Kit (Low-Input) | Chemically converts unmethylated cytosines to uracil. | Select kits with high recovery (<50 ng input) and single-strand DNA protection. |
| Digital PCR Master Mix | Enables absolute quantification by partitioning samples. | Gold standard for precise, reproducible measurement of low-abundance methylated alleles. |
| Dual-Indexed Unique Molecular Identifiers (UMIs) | Tags individual DNA molecules pre-amplification. | Allows bioinformatic correction of PCR duplicates and errors, improving accuracy. |
Rigorous Validation Frameworks: Meeting Regulatory Standards for Clinical Utility
Troubleshooting Guides & FAQs
Q1: During bisulfite sequencing for DNA methylation analysis, my control samples show unexpected high methylation levels. What could be the issue? A: This is commonly due to incomplete bisulfite conversion. Ensure the bisulfite reagent is fresh (< 6 months from opening, stored correctly). Degraded reagent leads to inadequate conversion of unmethylated cytosines, causing false-positive methylation signals. Verify conversion efficiency with a non-methylated lambda DNA control in every run. If efficiency is <99%, repeat the conversion step with a new reagent batch and check incubation temperature (50-55°C) and pH (5.0-5.2).
Q2: My qPCR assay for a specific histone modification (e.g., H3K4me3) shows high technical variability (poor precision) between replicates. How can I troubleshoot this? A: High variability in chromatin immunoprecipitation (ChIP)-qPCR often stems from inconsistent chromatin shearing or antibody-binding efficiency. First, verify chromatin fragment size (200-500 bp) post-sonication using a bioanalyzer. Second, ensure antibody specificity by using a knockout cell line or peptide competition control. Normalize data to both input DNA and a stable histone mark (e.g., H3 total). Use a robotic liquid handler for library preparation to improve pipetting precision.
Q3: When establishing the Limit of Detection (LoD) for a 5-hydroxymethylcytosine (5hmC) assay, my standard curve is non-linear at low concentrations. What steps should I take? A: Non-linearity at low analyte levels often indicates inhibitor carryover or substrate limitation. For oxidative bisulfite-based 5hmC assays, ensure complete removal of β-glucosyltransferase and oxidation reagents via thorough clean-up with magnetic beads (multiple washes). Prepare standard dilutions in the same background matrix as your samples (e.g., human genomic DNA) to account for interference. Use a minimum of 10 replicate measurements per low-concentration standard to robustly define the lower limit of the curve.
Q4: I am observing low specificity in my digital PCR assay for a rare epigenetic allele. How can I reduce false positives? A: In digital PCR for rare epigenetic variants, false positives can arise from pre-amplification contamination or droplet merging. Implement strict uracil-DNA glycosylase (UDG) treatment to combat amplicon contamination. Redesign probes to increase the Tm difference between wild-type and variant alleles by >5°C. Analyze droplet size and event amplitude plots to exclude merged or irregular droplets from the analysis. Re-optimize primer/probe concentrations to minimize off-target amplification.
Table 1: Example Performance Metrics for an EpiQuest Methylation-Specific PCR Assay
| Parameter | Value | 95% CI | Acceptable Criterion |
|---|---|---|---|
| Analytical Sensitivity | 98.5% | 96.2-99.5% | ≥95% |
| Analytical Specificity | 99.1% | 97.5-99.8% | ≥98% |
| Precision (Repeatability, %CV) | 2.1% | 1.5-3.0% | ≤5% |
| LoD (Copies of Methylated Allele) | 5 copies/reaction | 3-10 copies | Defined by 95% hit rate |
Table 2: Comparative LoD for Key Epigenetic Assay Platforms
| Assay Platform | Target | Typical LoD | Key Influencing Factor |
|---|---|---|---|
| Pyrosequencing | Methylation % at CpG | 5% allele frequency | PCR bias, bisulfite conversion |
| ChIP-qPCR | Histone Modification | 1% enrichment over input | Antibody affinity, shearing uniformity |
| ddPCR (Digital PCR) | Rare Methylated Allele | 0.001% variant frequency | Partitioning efficiency, non-specific amplification |
| NGS-based (e.g., ATAC-seq) | Chromatin Accessibility | 50-100 cells | Library complexity, PCR duplicates |
Experimental Protocols
Protocol 1: Determining LoD for Bisulfite Pyrosequencing
- Standard Preparation: Create a dilution series of fully methylated control DNA (e.g., CpGenome Universal Methylated DNA) in unmethylated human genomic DNA (from GM12878 cell line). Range: 0%, 1%, 5%, 10%, 25%, 50%, 100% methylated.
- Bisulfite Conversion: Treat 500 ng of each standard with the EZ DNA Methylation-Lightning Kit. Elute in 20 µL.
- PCR & Pyrosequencing: Amplify 2 µL of converted DNA with biotinylated primers. Validate amplicon size on agarose gel. Perform pyrosequencing on a PyroMark Q48 Autoprep system using 10 µL of PCR product and 0.3 µM sequencing primer.
- Data Analysis: For each %methylation standard, run 20 replicates. The LoD is defined as the lowest concentration where 19/20 (95%) replicates are detected with a methylation value within ±30% of the expected value.
Protocol 2: Establishing Precision (Repeatability & Reproducibility) for ChIP-qPCR
- Sample & Replicate Design: Use a well-characterized cell line (e.g., HeLa). Prepare three identical chromatin aliquots per run (within-run repeats). Repeat the entire experiment on three different days, by two different operators, using different reagent lots (between-run reproducibility).
- ChIP Procedure: Shear 1 x 10^6 cells per aliquot to 200-500 bp fragments. Immunoprecipitate with 1 µg of target-specific antibody (e.g., anti-H3K27ac) and matched IgG control. Use magnetic protein A/G beads. Wash, elute, and reverse crosslinks.
- qPCR Analysis: Analyze purified DNA in triplicate qPCR reactions for both a positive target locus and a negative control locus. Use % Input method for quantification.
- Statistical Analysis: Calculate the mean, standard deviation, and coefficient of variation (%CV) for the % Input values at the target locus across all replicates. Acceptable precision is typically ≤15% CV.
Diagrams
Diagram 1: Workflow for Analytical Validation of an Epigenetic Assay
Diagram 2: Key Factors Influencing Specificity in Epigenetic Analysis
The Scientist's Toolkit
Table 3: Research Reagent Solutions for Epigenetic Validation
| Item | Function in Validation | Example Product/Catalog |
|---|---|---|
| Universal Methylated & Unmethylated DNA | Positive/Negative controls for methylation assays, constructing standard curves for LoD. | MilliporeSigma CpGenome Universal Methylated Human DNA |
| Bisulfite Conversion Kit | Converts unmethylated cytosine to uracil for methylation-specific detection. Critical for sensitivity. | Zymo Research EZ DNA Methylation-Lightning Kit |
| High-Affinity ChIP-Validated Antibodies | For specific pull-down of histone modifications or DNA-binding proteins. Key for specificity. | Cell Signaling Technology Histone H3 (tri-methyl K4) Antibody |
| Digital PCR Master Mix | Enables absolute quantification for LoD studies of rare epigenetic variants with high precision. | Bio-Rad ddPCR Supermix for Probes (No dUTP) |
| Synthetic Spike-In Controls (for NGS) | Normalize samples and identify technical biases in chromatin accessibility or methylation sequencing. | EpiCypher SNAP-CUTANA Spike-in Controls |
| DNA Shearing System | Produces consistent chromatin fragment sizes (200-500 bp), crucial for ChIP precision. | Covaris M220 Focused-ultrasonicator |
| Next-Generation Sequencing Library Prep Kit | For converting immunoprecipitated or bisulfite-converted DNA into sequencing libraries. | Illumina TruSeq ChIP or DNA Methylation Kits |
Troubleshooting Guides & FAQs
FAQ 1: How do I address poor correlation between biomarker levels and clinical phenotype in my cohort?
Answer: This is often due to pre-analytical or analytical variables. Follow this checklist:
- Sample Integrity: Verify sample collection, processing, and storage protocols were identical across all subjects. Epigenetic marks (e.g., DNA methylation) can degrade with prolonged ischemia or improper freezing.
- Assay Validation: Ensure your assay (e.g., bisulfite sequencing, ChIP-qPCR) has passed technical validation for precision, accuracy, and linearity within the expected analyte range. High intra-assay coefficient of variation (CV) can obscure true biological signals.
- Cohort Stratification: Re-examine cohort inclusion criteria. Phenotypes must be rigorously and uniformly defined. Consider confounding factors like medication, comorbidities, or batch effects in sample processing.
FAQ 2: My biomarker shows prognostic potential, but the hazard ratio confidence interval is very wide. How can I improve this?
Answer: Wide confidence intervals indicate low statistical power or high outcome variability.
- Increase Sample Size: This is the most direct method. Use power calculations based on preliminary data to determine the required cohort size for validation.
- Refine Biomarker Quantification: Transition from a qualitative (positive/negative) to a continuous measurement or a multi-level categorical score to capture more prognostic information.
- Multivariate Analysis: Combine your biomarker with other known clinical or molecular variables in a Cox proportional hazards model to see if it provides independent prognostic value and tightens the estimate.
FAQ 3: What are common pitfalls when linking biomarker modulation to treatment response in a clinical trial setting?
Answer:
- Incorrect Sampling Timepoint: The biomarker may be transiently modulated. Map a kinetic profile in a pilot study to identify the optimal post-treatment sampling window.
- Tumor Heterogeneity: In oncology, a biopsy from a single lesion may not represent the overall treatment response. Consider liquid biopsy approaches (e.g., ctDNA methylation) for a systemic view.
- Using an Un-validated Assay Cut-off: The pre-defined threshold to define "biomarker high" vs. "low" must be locked before analyzing response data. Do not optimize the cut-off on the same dataset used for testing association.
FAQ 4: My NGS-based biomarker detection has high technical noise. How can I improve signal-to-noise for clinical validation?
Answer: For techniques like whole-genome bisulfite sequencing or MeDIP-seq:
- Increase Sequencing Depth: For rare markers or heterogeneous samples, depth >30x may be required. Use pilot data to model depth vs. detection power.
- Bioinformatic Normalization: Apply batch correction algorithms (e.g., ComBat, RUV) to remove technical artifacts. Ensure you use control samples (e.g., spike-in controls, reference standards) within each batch.
- Wet-lab Optimization: Use duplicate or triplicate library preparations and confirm findings with an orthogonal method (e.g., pyrosequencing for DNA methylation) on key targets.
Experimental Protocols
Protocol: Technical Validation of a DNA Methylation Biomarker via Pyrosequencing
Objective: To quantitatively measure methylation percentage at specific CpG sites within a candidate biomarker region.
Materials: See "The Scientist's Toolkit" below. Procedure:
- DNA Extraction & Bisulfite Conversion: Isolate genomic DNA (minimum 50 ng) using a column-based kit. Treat DNA with sodium bisulfite using a commercial conversion kit (e.g., EZ DNA Methylation-Lightning Kit). Purify converted DNA.
- PCR Amplification: Design PCR primers specific to the bisulfite-converted sequence, avoiding CpG sites. Perform PCR in a 25 µL reaction with Hot Start Taq polymerase. Validate amplicon size and purity on an agarose gel.
- Pyrosequencing: Immobilize biotinylated PCR product to Streptavidin Sepharose beads. Wash, denature, and anneal the sequencing primer to the single-stranded template. Load the cartridge into the Pyrosequencer and run the analysis using the dispensation order designed for the target sequence.
- Data Analysis: The PyroQ-CpG software outputs methylation percentage per CpG site. Calculate the mean methylation across target CpGs for each sample.
Protocol: Validating a Prognostic Biomarker Using Kaplan-Meier Survival Analysis
Objective: To assess the association between biomarker level and patient survival time.
Procedure:
- Cohort Definition: Define a retrospective cohort with documented clinical follow-up (Overall Survival or Progression-Free Survival). Obtain necessary ethical approvals.
- Biomarker Stratification: Measure the biomarker in all baseline samples. Apply a pre-defined, clinically relevant cut-off (e.g., median value, established reference range) to dichotomize the cohort into "Biomarker High" and "Biomarker Low" groups.
- Statistical Analysis: Perform Kaplan-Meier analysis using statistical software (R, SPSS, GraphPad Prism). Input columns for: Patient ID, Group (High/Low), Time (to event or last follow-up), and Event Status (1=event occurred, 0=censored).
- Plot & Interpretation: Generate the survival curves. Use the log-rank test (Mantel-Cox) to determine if the difference between curves is statistically significant (p < 0.05). Report hazard ratios with 95% confidence intervals from a Cox model.
Data Presentation
Table 1: Example Data from a Technical Validation Study of a DNA Methylation Biomarker Assay
| Validation Parameter | Metric | Acceptance Criterion | Observed Result |
|---|---|---|---|
| Intra-Assay Precision | Coefficient of Variation (CV) | CV < 5% | 3.2% |
| Inter-Assay Precision | Coefficient of Variation (CV) | CV < 10% | 8.7% |
| Accuracy (Spike-Recovery) | % Recovery of known standard | 90-110% | 102% |
| Linearity | R² across 0-100% methylated control mix | R² > 0.98 | 0.994 |
| Limit of Detection (LoD) | Lowest % methylation reliably detected | < 5% | 3.5% |
Table 2: Hypothetical Prognostic Performance of a Biomarker in Two Cancer Cohorts
| Cohort (Cancer Type) | Number of Patients (N) | Biomarker High Prevalence | Median OS (Biomarker High) | Median OS (Biomarker Low) | Hazard Ratio (95% CI) | Log-rank P-value |
|---|---|---|---|---|---|---|
| Discovery (Lung) | 150 | 45% | 24 months | 42 months | 2.1 (1.4 - 3.2) | 0.001 |
| Validation (Bladder) | 200 | 38% | 31 months | 52 months | 1.8 (1.2 - 2.7) | 0.003 |
Visualizations
Diagram 1: Clinical Validation Workflow for Epigenetic Biomarkers
Diagram 2: Key Signaling Pathway Involving an Epigenetic Biomarker
The Scientist's Toolkit: Research Reagent Solutions
Table 3: Essential Materials for Epigenetic Biomarker Validation
| Item | Function | Example Product(s) |
|---|---|---|
| Bisulfite Conversion Kit | Chemically converts unmethylated cytosine to uracil, leaving methylated cytosine unchanged, enabling methylation analysis. | EZ DNA Methylation-Lightning Kit, EpiTect Bisulfite Kit |
| Methylation-Specific PCR Primers | Amplify bisulfite-converted DNA; primers are designed to differentiate methylated vs. unmethylated sequences. | Custom-designed oligonucleotides. |
| Pyrosequencing System & Reagents | Provides quantitative, sequence-based analysis of methylation percentage at individual CpG sites. | PyroMark Q48 System, PyroGold Reagents |
| Universal Methylated & Unmethylated DNA Controls | Serve as 100% and 0% methylation standards for assay calibration, accuracy, and linearity testing. | EpiTect PCR Control DNA Set |
| Cell-Free DNA Collection Tubes | Preserve blood samples for liquid biopsy by stabilizing nucleated cells and preventing genomic DNA contamination of plasma. | Streck Cell-Free DNA BCT tubes, PAXgene Blood cDNA tubes |
| NGS Library Prep Kit for Bisulfite-Seq | Prepares bisulfite-converted DNA for next-generation sequencing to analyze genome-wide or targeted methylation. | Illumina DNA Prep, Methylation, Accel-NGS Methyl-Seq DNA Library Kit |
| HDAC/DNMT Inhibitors (Control Reagents) | Used as positive controls in functional assays to demonstrate expected changes in histone acetylation or DNA methylation. | Trichostatin A (HDACi), 5-Azacytidine (DNMTi) |
Troubleshooting Guides & FAQs
Q1: We observed high inter-assay variability in our bisulfite-converted DNA qPCR results for a candidate methylation biomarker. What are the primary culprits and how can we mitigate them?
A: High variability in bisulfite-converted DNA qPCR often stems from incomplete or inconsistent bisulfite conversion, poor DNA quality/quantity, or suboptimal primer design. Follow this protocol to troubleshoot:
- Assess DNA Integrity: Run pre-conversion DNA on a 1% agarose gel. A clear, high-molecular-weight band is ideal. Degraded DNA (smearing) leads to inconsistent conversion.
- Verify Bisulfite Conversion Efficiency:
- Protocol: Spike a known unmethylated control (e.g., Lambda DNA) into your sample pre-conversion. Post-conversion, perform qPCR with primers specific for converted unmethylated sequences in the spike-in. Efficiency should be >99%, indicated by a Cq value >35 or undetectable in the no-conversion control.
- Solution: If efficiency is low, ensure fresh bisulfite reagent (sodium bisulfite pH 5.0), precise thermal cycling (alternating 55°C and 95°C steps), and proper desalting/clean-up post-conversion.
- Analyze Primer Specificity: Design primers targeting sequences with multiple CpGs to ensure they only bind to fully converted DNA. Use in silico tools (e.g., MethPrimer) and always run a melt curve analysis post-qPCR. A single sharp peak confirms specificity.
Q2: Our chromatin immunoprecipitation (ChIP) yields low DNA concentration for next-generation sequencing (NGS), especially for histone marks in limited clinical samples. How can we optimize this?
A: Low ChIP-DNA yield is common with low-input samples or low-abundance targets. Implement this micro-ChIP (µChIP) protocol and troubleshooting guide:
- Cell Cross-linking & Lysis: Use 1x10^4 to 1x10^5 cells. Cross-link with 1% formaldehyde for exactly 10 minutes at RT. Quench with 125mM Glycine. Lyse cells in a stringent RIPA buffer (50mM Tris-HCl pH 8.0, 150mM NaCl, 1% NP-40, 0.5% Sodium deoxycholate, 0.1% SDS) with fresh protease inhibitors.
- Chromatin Shearing:
- Critical: Optimize sonication for small fragments (200-500 bp). Over-sonication destroys epitopes; under-sonication reduces resolution. Check fragment size on a 2% agarose gel after reverse cross-linking.
- Immunoprecipitation (IP):
- Use validated, high-affinity antibodies specifically qualified for ChIP. Include a positive control antibody (e.g., H3K4me3) and a negative control IgG.
- Pre-clear lysate with Protein A/G beads for 1 hour.
- Perform IP overnight at 4°C with gentle rotation. Use magnetic beads for easier handling and lower background.
- Washing & Elution: Wash beads sequentially with: a) Low Salt Wash Buffer, b) High Salt Wash Buffer, c) LiCl Wash Buffer, d) TE Buffer. Elute DNA in freshly prepared ChIP Elution Buffer (1% SDS, 0.1M NaHCO3) at 65°C for 15 minutes with shaking.
- DNA Recovery: Reverse cross-links at 65°C overnight. Treat with RNase A and Proteinase K. Purify DNA using silica-membrane columns designed for low DNA recovery.
Q3: When transitioning a research-use-only (RUO) DNA methylation sequencing assay to an in vitro diagnostic (IVD) prototype, what are the key validation parameters that must be formally tested?
A: Moving from RUO to IVD requires a "fit-for-purpose" shift to higher stringency. The following parameters must be formally documented, typically using Clinical Laboratory Standards Institute (CLSI) guidelines:
- Analytical Sensitivity (Limit of Detection): Minimum methylation level detectable at a defined confidence (e.g., 5% methylated alleles with 95% confidence).
- Analytical Specificity: Assess interference from bisulfite-converted unmethylated DNA, cross-reactivity with homologous sequences, and impact of common interferents (e.g., hemoglobin, genomic DNA fragmentation).
- Precision: Repeatability (intra-assay) and reproducibility (inter-assay, inter-operator, inter-lot reagent) must be quantified using percent coefficient of variation (%CV) for quantitative assays or percent agreement for qualitative ones.
- Accuracy: Comparison to a reference method (e.g., pyrosequencing, digital PCR) using well-characterized reference materials.
- Reportable Range: The validated range of methylation levels (e.g., 0-100%) over which the test provides accurate and precise results.
- Robustness/Ruggedness: Deliberate, minor variations in protocol (incubation times, temperatures, reagent volumes) to establish operational tolerances.
Table 1: Comparison of Key Validation Parameters for RUO vs. IVD Assays
| Validation Parameter | Research Use Only (RUO) Typical Practice | In Vitro Diagnostic (IVD) Minimum Requirement | Common CLSI Guideline |
|---|---|---|---|
| Precision | 3 replicates, %CV <20-25% often accepted. | 20+ replicates over 5+ days, %CV <10-15% for qPCR. | EP05-A3, EP15-A3 |
| Accuracy | Comparison to literature or one alternative method. | Formal comparison to a certified reference method using standard reference materials (SRMs). | EP09-A3 |
| Reportable Range | Linear range from standard curve (R² >0.98). | Defined range with tested lower/upper limits verified with patient samples. | EP06-A |
| Limit of Detection (LoD) | Estimated from dilution series. | Statistically derived with 95% confidence from 20+ replicates of low-level samples. | EP17-A2 |
| Reference Interval | May use historical lab data or literature. | Must be established from at least 120 healthy, annotated donor samples. | EP28-A3C |
Table 2: Essential Controls for Epigenetic Assay Validation
| Control Type | Example for DNA Methylation Assay | Example for ChIP-Seq Assay | Purpose |
|---|---|---|---|
| Positive Control | Commercially available fully methylated DNA. | Antibody for H3K4me3 (active promoter mark). | Verifies assay technical success. |
| Negative Control | Commercially available fully unmethylated DNA. | Normal Rabbit/IgG antibody. | Establishes background/non-specific signal. |
| Process Control | Spike-in unconverted DNA to check conversion efficiency. | Spike-in alien chromatin (e.g., Drosophila S2 cells). | Normalizes for technical variation. |
| Biological Control | Cell line with known, stable epigenetic state. | Cell line with well-characterized histone modification profile. | Ensures consistency across experiments. |
Experimental Protocol: Analytical Sensitivity (LoD) Determination for a Methylation-Specific qPCR Assay
Objective: Statistically determine the lowest percentage of methylated alleles detectable by the assay with 95% confidence.
Materials:
- DNA: Fully methylated (100% M) and fully unmethylated (0% M) control DNA.
- Method: Methylation-specific qPCR assay (primers/probe for target sequence).
- Equipment: qPCR instrument, digital pipettes.
Procedure:
- Prepare Dilution Series: Create a mock "patient sample" series by mixing methylated and unmethylated DNA to generate the following methylation percentages: 0%, 0.5%, 1%, 2%, 5%, 10%. Use a constant total DNA input (e.g., 50 ng) per reaction.
- Bisulfite Conversion: Convert each dilution in duplicate through the entire sample processing workflow.
- qPCR Amplification: Run each converted sample in a minimum of 24 technical replicates per concentration level across multiple runs (≥3 days), operators (≥2), and reagent lots (≥2).
- Data Analysis: For each dilution level, calculate the detection rate (number of positive replicates / total replicates).
- Statistical Modeling: Use a probit or logit regression model (software: e.g., R, MedCalc) to fit the detection rate against the log10(methylation %). The LoD with 95% confidence is the concentration at which the model predicts a 95% detection probability.
Visualizations
Title: Evolution of Protocol, Controls & Data from RUO to IVD
Title: Integrated QC & Control Workflow for Epigenetic NGS
The Scientist's Toolkit: Research Reagent Solutions
Table 3: Essential Materials for Epigenetic Biomarker Technical Validation
| Item | Function in Validation | Example Product/Category | Key Consideration for IVD Transition |
|---|---|---|---|
| Certified Reference Materials (CRMs) | Provides a ground truth for accuracy studies and calibrators. | Seraseq Methylated DNA, Horizon Dx PCR/Sequencing Reference Materials. | Must be traceable to an internationally recognized standard. |
| Bisulfite Conversion Kits | Converts unmethylated cytosines to uracil for downstream detection. | EZ DNA Methylation kits, Epitect Bisulfite kits. | Lot-to-lot consistency, defined shelf-life, and carryover contamination controls become critical. |
| Methylation-Specific qPCR Assays | Quantitative detection of low-frequency methylation events. | TaqMan Methylation Assays, Precision Methylation Assays. | Requires formal analytical specificity testing against homologous sequences and interferents. |
| ChIP-Grade Antibodies | High-affinity, specific antibodies for histone marks or DNA-binding proteins. | Cell Signaling Technology ChIP Validated Abs, Active Motif CUT&Tag kits. | Vendor must provide IVD-compatible regulatory support files (e.g., Certificate of Analysis, Statement of Performance). |
| Universal Library Prep Kits | Converts enriched DNA into sequencing-ready libraries. | KAPA HyperPrep, NEBNext Ultra II FS DNA. | Must be validated for input range compatibility and demonstrate minimal bias in GC/methylation content. |
| Bioinformatic Pipeline Software | Analyzes raw sequencing data to generate a clinical report. | nf-core/methylseq, Bismark, Partek Flow. | For IVD, software must be Class I/II medical device compliant (e.g., 21 CFR Part 11, ISO 13485). |
Technical Support Center: Troubleshooting Epigenetic Biomarker Validation
Frequently Asked Questions (FAQs)
Q1: During LoB/LoD estimation per CLSI EP17, my qPCR data for methylated alleles shows high variability in the low-concentration region. What are the primary causes and solutions? A: High variability near the limit of detection is common. First, ensure your dilution series uses a certified, non-methylated background matrix (e.g., leukocyte DNA from healthy donors). Common issues are:
- Carryover Contamination: Implement strict unidirectional workflow and UV decontamination of workspaces.
- Inconsistent Bisulfite Conversion: Use a conversion control with known, low methylation percentage. Standardize incubation times and thermal cycler ramping rates.
- Stochastic Sampling: For digital PCR (dPCR) methods, ensure sufficient partitions are analyzed (>20,000). For qPCR, increase replicate number to 12-20 at each low concentration level as EP17 recommends.
- Primer/Probe Degradation: Aliquot all reagents and perform fresh dilutions for LoB/LoD experiments.
Q2: How do FDA's "Bioanalytical Method Validation" and EMA's "Guideline on Bioanalytical Method Validation" differ in requirements for precision and accuracy for biomarker assays, and which applies to our exploratory epigenetic study? A: For exploratory biomarkers (Phase 1-2), both allow "fit-for-purpose" validation, but thresholds differ. See Table 1. If your biomarker is a probable candidate for drug co-development with a diagnostic (e.g., a companion diagnostic), follow the stricter FDA IVD framework early.
Q3: Our microarray data for genome-wide DNA methylation was rejected by a journal for non-compliance with MIAME/MINSEQE. What are the absolute minimum data annotations required? A: Beyond raw data files, you must provide:
- Sample Annotation: Disease state, organism, tissue, cell type, epigenetic mark assayed, genetic manipulation.
- Experimental Design: Sample-to-array relationships, including technical replicates.
- Array Specification: Platform manufacturer, catalog number, array serial/batch number.
- Hybridization & Processing Protocols: Detailed, step-by-step methodology, including bisulfite conversion kit and version, staining, scanning equipment and settings.
- Normalization & Data Transformation: The exact computational methods used.
Q4: For dPCR-based absolute quantification of 5-hydroxymethylcytosine (5hmC), how do I establish the Limit of Quantitation (LoQ) to satisfy both CLSI EP17 and regulatory expectations? A: The LoQ is the lowest concentration meeting defined precision (e.g., ≤20% CV) and accuracy (e.g., 80-120% recovery) criteria.
- Protocol: Perform a 6-10 point dilution series in triplicate across 3 separate days. Include a zero (blank) sample.
- Calculation: Plot CV% and %Recovery vs. concentration. The LoQ is the lowest point where both your precision and accuracy criteria are consistently met across all runs.
- Key Reagent: Use spike-in synthetic DNA fragments with known 5hmC modifications as a positive control for recovery calculations.
Comparative Data Tables
Table 1: Precision & Accuracy Requirements Comparison
| Guideline / Agency | Applicable Context | Precision (CV%) Requirement | Accuracy (% Bias) Requirement | Key Distinguishing Feature |
|---|---|---|---|---|
| CLSI EP17 (LoB/LoD) | Analytical Sensitivity | Defines LoB/LoD calculation method; precision assessed via replicate testing. | Not directly defined for LoB/LoD. | Defines statistical protocols (e.g., non-parametric) for establishing limits. |
| FDA - Bioanalytical Method Validation | Drug Development (Biomarker) | ≤15% (≤20% at LoQ) | ±15% (±20% at LoQ) | Emphasizes stability data under storage & processing conditions. |
| EMA - Guideline on Bioanalytical Method Validation | Drug Development (Biomarker) | ≤15% (≤20% at LoQ) | ±15% (±20% at LoQ) | More explicit on cross-validation between labs/methods. |
| MIAME/MINSEQE | Microarray/NGS Data Reporting | Not Specified | Not Specified | Focuses on complete metadata reporting for reproducibility. |
Table 2: Key Validation Parameter Alignment Across Guidelines
| Validation Parameter | CLSI EP17 | FDA (Biomarker) | EMA (Biomarker) | MIAME/MINSEQE |
|---|---|---|---|---|
| Lower Limit of Detection (LoD) | Primary Focus | Required | Required | Not Applicable |
| Lower Limit of Quantification (LoQ) | Covered | Required | Required | Not Applicable |
| Precision (Repeatability) | Required for LoD estimation | Required | Required | Implied via replicate reporting |
| Specificity/Selectivity | Implied (blank testing) | Required (interference testing) | Required (interference testing) | Not Specified |
| Minimum Data Reporting | Experimental results for LoB/LoD | Full validation report | Full validation report | Primary Focus (Raw data, protocols) |
Experimental Protocols
Protocol 1: Establishing LoB and LoD for a Bisulfite Sequencing-Based Methylation Assay (Per CLSI EP17-A2) Objective: Determine the lowest methylation percentage detectable that can be reliably distinguished from background. Materials: See "Scientist's Toolkit" below. Procedure:
- Prepare Sample Series: Create a dilution series of fully methylated control DNA in a background of confirmed non-methylated genomic DNA. Include at least 5 low-level concentrations (including zero) near the expected LoD.
- Replication: Analyze each concentration level with a minimum of 4 replicates per run, over 3-5 independent days (total n ≥ 20 per level).
- Bisulfite Conversion & Library Prep: Treat all samples uniformly using a validated bisulfite conversion kit. Perform library preparation and sequencing (targeted or genome-wide) according to standardized protocol.
- Data Analysis:
- LoB: Calculate the 95th percentile of results from the zero (blank) samples.
- LoD (Non-parametric): Identify the lowest tested concentration where ≥ 90% of results (≥18 out of 20) are above the calculated LoB.
- LoD (Parametric): If data is normally distributed, LoD = LoB + 1.645*(SD of low-concentration sample).
Protocol 2: Fit-for-Purpose Assay Validation for an Exploratory DNA Methylation Biomarker (Aligning with FDA/EMA) Objective: Validate a candidate methylation-sensitive dPCR assay for use in a Phase II clinical trial. Materials: Clinical sample aliquots, dPCR master mix, target-specific assays, digital PCR system. Procedure:
- Precision (Repeatability & Reproducibility): Run 3 levels of QC (Low, Mid, High methylation) with 5 replicates each within one run (within-run). Repeat across 3 different days/operators (between-run). Calculate CV% for copy number concentration. Accept if CV ≤20% at LoQ and ≤15% at higher levels.
- Accuracy/Recovery: Spike known quantities of methylated synthetic template into patient-derived negative matrix. Perform at 3 concentrations across the range in triplicate. Calculate %Recovery = (Measured / Expected) * 100. Accept if 80-120%.
- Specificity: Test against genomic DNA from cell lines with known unmethylated status for the target locus. Signal should be at or near background.
- Reportable Range: Demonstrate linearity (R² > 0.98) and dynamic range across expected physiological concentrations.
- Stability: Perform freeze-thaw (3 cycles) and short-term bench-top stability tests on sample types.
Visualizations
Diagram 1: Epigenetic Biomarker Validation Workflow
Diagram 2: CLSI EP17 LoB & LoD Determination Logic
The Scientist's Toolkit: Key Research Reagent Solutions
| Item | Function in Epigenetic Validation | Example/Note |
|---|---|---|
| Certified Reference DNA (Methylated/Unmethylated) | Provides absolute standard for calibration, accuracy (recovery), and LoD studies. | E.g., Seraseq Methylated DNA standards, Horizon Multiplex I cfDNA Reference. |
| Bisulfite Conversion Kit | Converts unmethylated cytosine to uracil while preserving methylated cytosine. Critical for specificity. | Check conversion efficiency (>99.5%) via control assays. |
| Digital PCR (dPCR) Master Mix | Enables absolute quantification without a standard curve. Essential for precise LoD/LoQ. | Use a mix validated for bisulfite-converted DNA (often uracil-tolerant). |
| Spike-In Synthetic Controls | Monitors enzymatic steps (conversion, amplification) and identifies inhibition. | Add a known, non-human methylated sequence to each sample. |
| Methylation-Naive Background Matrix | Provides consistent background for dilution series in LoB/LoD experiments. | Pooled leukocyte DNA from healthy donors, thoroughly characterized as target-negative. |
| Universal Human Methylated/Unmethylated Controls | Assess overall assay performance (bisulfite conversion, PCR efficiency) per run. | Commercially available from multiple vendors (e.g., Zymo, Qiagen). |
Technical Support Center for Longitudinal Epigenetic Biomarker Studies
This support center provides solutions for common technical challenges in long-term epigenetic studies, framed within the need for robust technical validation of biomarkers for real-world evidence (RWE) generation.
FAQs & Troubleshooting Guides
Q1: In our longitudinal DNA methylation study (e.g., using Illumina EPIC arrays), we observe high batch effects between sample collection waves years apart, obscuring true biological signals. How can we diagnose and correct for this? A: This is a critical issue for proving stability. First, diagnose using Principal Component Analysis (PCA) colored by batch. Correct using:
- Pre-Experimental Design: Use randomized plate placements across time points.
- Post-Hoc Correction: Apply functional normalization (minfi R package) or ComBat with empirical Bayes methods (sva package), using control probes. Validate correction by confirming PCA plots no longer cluster by batch.
- Replication: Spike in universal control DNA (e.g., from a single donor) across all batches to quantify technical variance.
Q2: When tracking epigenetic biomarkers in blood over time, how do we distinguish true longitudinal change from variation due to fluctuating cell type proportions? A: Cellular heterogeneity is a major confounder.
- Solution: Always perform cell type deconvolution. Use a reference-based method (e.g., EWAS or FlowSorted.Blood.EPIC in R) to estimate proportions of neutrophils, lymphocytes, etc., for each sample.
- Troubleshooting: If biomarker association is lost after adjusting for cell counts, the signal may reflect immune system changes, not the disease of interest. Report results both before and after adjustment.
- Protocol: Incorporate estimation into your preprocessing pipeline. Use the
estimateCellCounts2function (minfi) with an appropriate reference.
Q3: Our candidate biomarker shows strong cross-sectional association but high intra-individual variability in a longitudinal cohort. What statistical and experimental steps should we take? A: High variability threatens claims of stability.
- Analysis: Calculate the Intraclass Correlation Coefficient (ICC) for your biomarker. An ICC > 0.75 suggests good stability, <0.4 suggests poor reliability for measuring trait stability.
- Investigation: Check for pre-analytical factors (sample collection time, fasting status, storage time) correlated with variability. Implement stricter standard operating procedures (SOPs).
- Follow-up Experiment: Design a technical replication study using the same archived samples measured in duplicate across different days/plates to partition technical vs. biological variance.
Q4: How do we determine the minimum sample size and follow-up duration for a longitudinal epigenetic study to prove clinical relevance? A: Power is a function of expected effect size, variance, and drop-out rate.
- Key Parameters: Use tools like
EWASpower(R) or simulations. Essential inputs are:- Expected methylation difference (Δβ) at CpG site (e.g., 0.02 to 0.05).
- Variance estimate from pilot/literature.
- Correlation of repeated measures over time (higher correlation increases power).
- Anticipated attrition rate (often 10-20% per decade in long-term studies).
- Recommendation: For RWE, follow-up should align with clinical outcome trajectories (e.g., 5+ years for chronic diseases).
Q5: What are the best practices for integrating disparate RWE data sources (e.g., biobanks, electronic health records) with our longitudinal epigenetic data? A: This is key for proving clinical relevance.
- Challenge: Inconsistent data formats, missingness, and variable definitions.
- Solution: Create a structured data harmonization plan using a common data model (e.g., OMOP CDM). Use unique, anonymized patient identifiers. For epigenetic data, ensure alignment of CpG identifiers (cg numbers) and genome builds (hg38).
- Technical Step: Use ETL (Extract, Transform, Load) pipelines with quality control checkpoints to map clinical variables (e.g., "heart attack" to ICD-10 code I21) consistently.
Table 1: Common Sources of Variance in Longitudinal Methylation Studies
| Variance Source | Typical Magnitude (σ²) | Mitigation Strategy |
|---|---|---|
| Technical (Array Batch) | High (Can be >30% of total) | Randomized plating, functional normalization, ComBat. |
| Biological (Inter-Individual) | Moderate to High | This is the signal of interest for population differences. |
| Biological (Intra-Individual) | Low to Moderate | Calculate ICC; control pre-analytical variables. |
| Cell Type Composition | Very High | Statistical deconvolution, physical cell sorting. |
| Storage/Archive Effects | Low (if stored <-80°C) | Avoid freeze-thaw cycles; use consistent storage. |
Table 2: Statistical Metrics for Assessing Biomarker Stability & Relevance
| Metric | Formula / Method | Interpretation in Longitudinal Context |
|---|---|---|
| Intraclass Correlation (ICC) | ICC = σ²_subjects / (σ²_subjects + σ²_residual) |
ICC > 0.75: Excellent temporal stability. ICC < 0.4: Unreliable for tracking individuals. |
| Longitudinal EWAS p-value | Linear Mixed Models (LMM) with random subject intercept | Accounts for within-subject correlation. Preferred over repeated-measures ANOVA. |
| Hazard Ratio (HR) | Cox Proportional Hazards Model | Quantifies association between biomarker change and time-to-event (e.g., disease progression). Proves clinical relevance. |
| Minimum Detectable Effect (MDE) | Power calculation simulation (e.g., EWASpower) |
Smallest Δβ detectable given your N, variance, and follow-up duration. |
Experimental Protocols
Protocol 1: Cell Type Deconvolution for Blood-Based Longitudinal Studies
- Input: Idat files or β-value matrix from Illumina methylation array.
- Reference Selection: Load an appropriate pre-built reference matrix (e.g.,
FlowSorted.Blood.EPICfor whole blood,FlowSorted.DLPFC.450kfor brain tissue). - Estimation: Run the
estimateCellCounts2function (minfi) orprojectCellType_CPfunction (EWAS R package) on your data. - Output: A matrix of estimated cell proportions (e.g., CD8T, CD4T, Neutrophils,...) for each sample.
- Downstream Analysis: Include these proportions as covariates in all association models to adjust for cellular heterogeneity.
Protocol 2: Calculating Intraclass Correlation (ICC) for Biomarker Stability
- Data Structure: Organize data in long format with columns:
Subject_ID,Timepoint,Beta_Value. - Model Fitting: Fit a null linear mixed model:
lmer(Beta_Value ~ 1 + (1 | Subject_ID), data = your_data)using thelme4R package. - Variance Extraction: Extract the variance components:
σ²_subjects(variance between subjects) andσ²_residual(variance within subjects over time). - Calculation: Compute ICC as:
ICC = σ²_subjects / (σ²_subjects + σ²_residual). - Reporting: Report ICC with confidence intervals (use
iccfunction inpsychorIRRpackage).
Visualizations
Title: Longitudinal Epigenetic Biomarker Analysis Workflow
Title: Variance Partitioning in Longitudinal Studies
The Scientist's Toolkit: Key Research Reagent Solutions
| Item | Function in Longitudinal Studies |
|---|---|
| Universal Methylation Standards (e.g., fully methylated/unmethylated DNA) | Serve as inter-batch controls to calibrate assay performance across longitudinal runs. |
| Reference DNA for Deconvolution (e.g., FlowSorted.Blood.EPIC reference set) | Essential for estimating and adjusting for cell type composition changes over time. |
| Bisulfite Conversion Kits (e.g., EZ DNA Methylation kits) | High-conversion efficiency (>99%) is critical for accurate β-value quantification; must be consistent. |
| DNA Integrity Number (DIN) Assay Kits (e.g., Agilent TapeStation) | Quality control of input DNA; low DIN scores correlate with unreliable methylation data. |
| Long-Term Storage Reagents (Stable -80°C freezers, LN2 storage) | Preserve sample integrity over decades to enable future replication or new assay testing. |
| Unique Dual-Indexed Adapters (for NGS-based assays) | Allow high-level multiplexing and pooling of samples from many time points to reduce batch effects. |
Conclusion
The successful technical validation of epigenetic biomarkers requires a meticulous, multi-stage process that bridges foundational biology, robust methodology, proactive troubleshooting, and rigorous validation. By understanding the epigenetic landscape and its disease correlations, researchers can identify high-potential markers. Implementing optimized, platform-specific protocols while vigilantly managing pre-analytical and analytical variables is crucial for generating reproducible data. Ultimately, validation must be contextual and adhere to evolving regulatory frameworks to ensure clinical reliability. The future lies in standardizing these pipelines, integrating multi-omic data, and advancing liquid biopsy applications, which will accelerate the translation of epigenetic biomarkers from research tools into mainstream diagnostics, personalized therapeutics, and dynamic monitors of disease progression and treatment efficacy.