Histone Modification Biomarkers for Early Cancer Detection: The Epigenetic Frontier
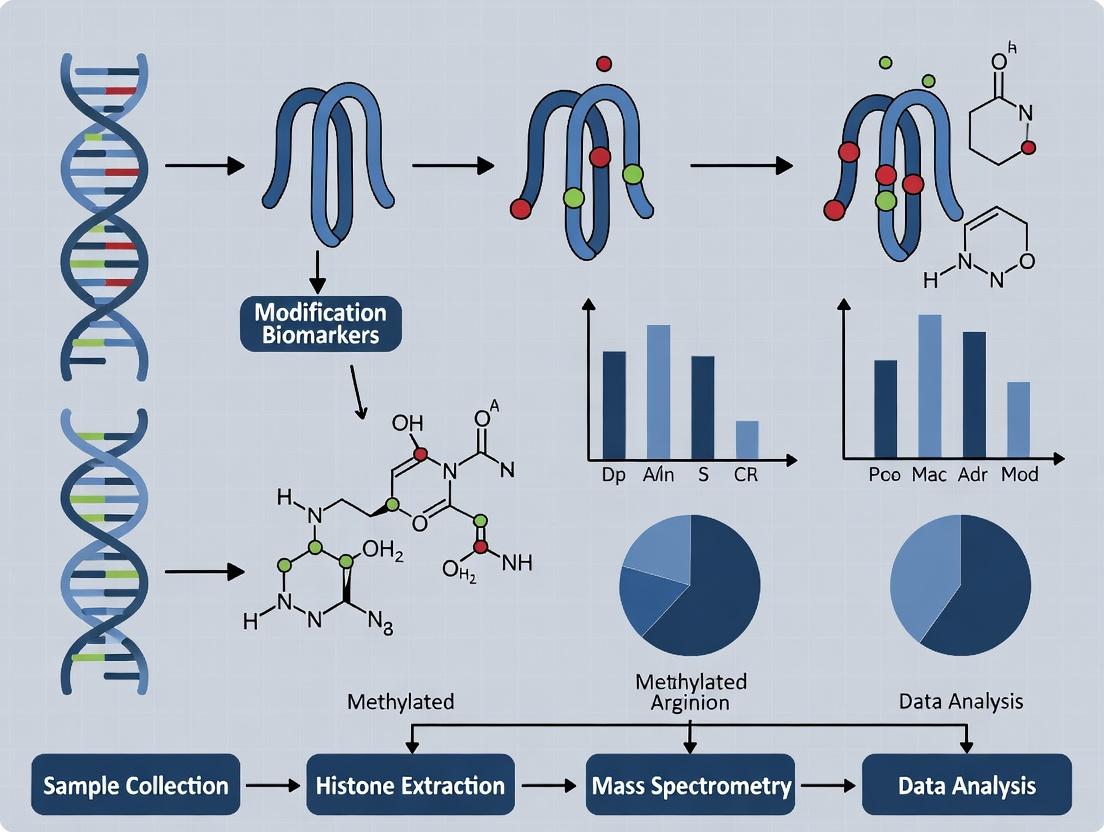
This article provides a comprehensive review of histone modification biomarkers for early cancer detection, tailored for researchers, scientists, and drug development professionals.
Histone Modification Biomarkers for Early Cancer Detection: The Epigenetic Frontier
Abstract
This article provides a comprehensive review of histone modification biomarkers for early cancer detection, tailored for researchers, scientists, and drug development professionals. It explores the foundational biology of histone marks in oncogenesis, details current methodologies for their detection and profiling, addresses key technical challenges in translation to liquid biopsies, and critically evaluates their validation status against traditional and emerging biomarkers. The synthesis aims to guide biomarker discovery and the development of next-generation epigenetic diagnostics.
Decoding the Epigenetic Blueprint: How Histone Modifications Drive Early Carcinogenesis
Within the framework of early cancer detection, histone post-translational modifications (PTMs) have emerged as promising epigenetic biomarkers. This whitepaper provides a technical overview of core histone modifications—acetylation, methylation, and phosphorylation—detailing their mechanisms, functional consequences, and quantitative measurement. The content is specifically contextualized for their application in oncogenic transformation research and early diagnostic biomarker discovery.
Core Histone Modifications: Mechanisms and Functions
Histone PTMs alter chromatin structure and recruit effector proteins, directly influencing transcriptional programs. Dysregulation of these marks is a hallmark of cancer epigenetics.
Histone Acetylation
Catalyzed by histone acetyltransferases (HATs) and reversed by histone deacetylases (HDACs), acetylation of lysine residues neutralizes the positive charge on histones, reducing affinity for negatively charged DNA and promoting an "open" euchromatin state. It primarily correlates with transcriptional activation.
Histone Methylation
Catalyzed by histone methyltransferases (HMTs) and reversed by histone demethylases (KDMs). Lysine can be mono-, di-, or tri-methylated; arginine can be mono- or di-methylated. The functional outcome is site- and state-dependent. For example, H3K4me3 is activating, while H3K9me3 and H3K27me3 are repressive.
Histone Phosphorylation
The addition of a phosphate group to serine, threonine, or tyrosine residues by kinases. It introduces a negative charge, altering histone-DNA interactions and serving as a binding platform. Key in DNA damage response (e.g., γH2AX) and mitotic chromatin condensation.
Beyond: Ubiquitination, SUMOylation, ADP-ribosylation
These complex modifications regulate processes like DNA repair and transcriptional fine-tuning. For instance, H2BK120ub is a prerequisite for H3K4 methylation.
Histone Modifications as Early Cancer Biomarkers: A Quantitative Perspective
Altered global and locus-specific histone modification patterns are detectable in pre-malignant lesions and liquid biopsies, offering potential for early intervention.
Table 1: Quantitative Alterations of Key Histone Marks in Early Carcinogenesis
| Histone Mark | Normal Tissue Level (Approx.) | Common Change in Early Neoplasia | Associated Cancers (Examples) | Potential Diagnostic Utility |
|---|---|---|---|---|
| H3K9ac | High at active promoters | Global decrease | Colorectal, NSCLC | Global loss correlates with dysplasia grade |
| H3K27me3 | Focal, polycomb-repressed regions | Global redistribution; focal gains/losses | Prostate, Breast | EZH2 overexpression leads to aberrant silencing |
| H3K4me2 | Broad at active enhancers/promoters | Global reduction | Hepatocellular | Serum nucleosome levels show decrease |
| H3S10ph | Peaks during mitosis | Constitutive elevation | Various (linked to unrestrained growth) | Marker of proliferative drive |
| H2AXS139ph (γH2AX) | Low/undetectable | Focal increase (genomic instability) | All (early DNA damage response) | Sensitive marker of oncogenic stress |
Key Methodologies for Histone Modification Analysis
Chromatin Immunoprecipitation Sequencing (ChIP-seq)
Protocol: Cells/tissues are cross-linked with formaldehyde. Chromatin is isolated and sheared by sonication to 200-500 bp fragments. Specific antibody-coated beads immunoprecipitate chromatin fragments bearing the target histone mark. After reverse cross-linking, purified DNA is used to prepare a sequencing library. Bioinformatics alignment identifies genomic enrichment sites. Key Application: Mapping genome-wide distribution of histone marks (e.g., identifying oncogene enhancers marked by H3K27ac).
Mass Spectrometry-Based Proteomics
Protocol (Bottom-Up): Histones are acid-extracted, derivatized (e.g., propionylation) to protect unmodified lysines, and digested with trypsin. Peptides are separated by liquid chromatography and analyzed by tandem MS (LC-MS/MS). Modified peptides are identified by mass shifts and fragmentation patterns. Quantification is achieved via label-free or stable isotope labeling. Key Application: Precise, quantitative profiling of combinatorial histone modification states (e.g., PTM crosstalk in patient samples).
Immunohistochemistry (IHC) / Immunofluorescence (IF)
Protocol: Formalin-fixed, paraffin-embedded (FFPE) tissue sections are deparaffinized, rehydrated, and subjected to antigen retrieval. Blocking is followed by incubation with a primary antibody specific to the histone PTM (e.g., anti-H3K9me3). Detection uses enzyme-conjugated (IHC) or fluorophore-conjugated (IF) secondary antibodies, visualized by microscopy. Key Application: Spatial analysis of histone mark levels and patterns in tumor biopsies and adjacent normal tissue.
Visualizing Key Pathways and Workflows
Diagram Title: Histone Acetylation Dynamics Regulating Chromatin State
Diagram Title: ChIP-seq Experimental Workflow for Histone Modifications
Diagram Title: Histone Modification Dysregulation as an Early Cancer Biomarker
The Scientist's Toolkit: Essential Research Reagents
Table 2: Key Reagent Solutions for Histone Modification Research
| Reagent / Material | Primary Function | Key Application Notes |
|---|---|---|
| PTM-Specific Antibodies | High-affinity binding to specific histone modifications (e.g., anti-H3K27me3). | Critical for ChIP-seq, IHC, WB. Validation (e.g., peptide arrays) is essential. |
| HDAC/HMT Inhibitors | Pharmacological inhibition of histone-modifying enzymes (e.g., SAHA, GSK343). | Used to probe PTM function and as therapeutic leads in cancer. |
| Recombinant Nucleosomes | Defined, modified nucleosome substrates for in vitro assays. | Essential for enzymatic activity assays of writers, erasers, and readers. |
| Stable Isotope-Labeled Amino Acids (SILAC) | Metabolic labeling for quantitative MS-based proteomics. | Enables accurate comparison of histone PTM abundance between cell states. |
| Chromatin Shearing Enzymes (e.g., MNase) | Controlled digestion of chromatin for nucleosome-level analysis. | Used for native ChIP protocols to preserve endogenous complexes. |
| Bivalent Nucleosome Standards | Synthetic nucleosomes with two defined PTMs for MS calibration. | Enables detection and quantification of combinatorial histone codes. |
| Cell-Free DNA (cfDNA) Extraction Kits | Isolation of circulating nucleosomal DNA from plasma/serum. | First step in liquid biopsy approaches for histone variant/PTM analysis. |
Within the broader thesis on histone modification biomarkers for early cancer research, the dysregulation of histone-modifying enzymes represents a foundational hallmark. These enzymes—lysine acetyltransferases (KATs), histone deacetylases (HDACs), lysine methyltransferases (KMTs), and lysine demethylases (KDMs)—establish and maintain the epigenetic landscape. Their aberrant activity in cancer leads to transcriptomic reprogramming, cellular plasticity, and the acquisition of oncogenic capabilities. Their measurable activity and resultant histone modification patterns offer significant promise as sensitive, early-detection biomarkers.
Core Enzyme Classes: Functions and Dysregulation
Lysine Acetyltransferases (KATs) and Histone Deacetylases (HDACs)
KATs catalyze the transfer of an acetyl group to lysine residues on histone tails, generally promoting an open chromatin state and transcriptional activation. HDACs remove these groups, leading to chromatin compaction and transcriptional repression.
Table 1: Key Dysregulated KATs and HDACs in Cancer
| Enzyme/Complex | Gene(s) | Common Alteration in Cancer | Primary Cancer Association(s) | Net Effect on Chromatin |
|---|---|---|---|---|
| KAT3B/p300 | EP300 | Inactivating mutations, deletions | Colorectal, Gastric, Lymphoma | Loss of H3K27ac → Transcriptional instability |
| KAT2B/PCAF | KAT2B | Amplification, Overexpression | Breast, Prostate | Increased H3K9ac → Oncogene activation |
| HDAC Class I | HDAC1,2,3 | Overexpression | Colorectal, Breast, Prostate | Global H3/H4 deacetylation → Tumor suppressor silencing |
| SIRT1 (Class III) | SIRT1 | Context-dependent (Overexp./Underexp.) | Various (e.g., Liver, Breast) | Altered metabolic gene expression |
Lysine Methyltransferases (KMTs) and Lysine Demethylases (KDMs)
KMTs deposit methyl groups on histone lysines (mono-, di-, or tri-methylation), with effects dependent on the residue. KDMs remove these marks. The functional outcome is highly context-specific.
Table 2: Key Dysregulated KMTs and KDMs in Cancer
| Enzyme | Gene(s) | Target Residue | Common Alteration in Cancer | Primary Cancer Association(s) | Net Oncogenic Effect |
|---|---|---|---|---|---|
| EZH2 (PRC2) | EZH2 | H3K27me3 | Gain-of-function mutations, Overexpression | Lymphoma, Breast, Prostate | Silencing of differentiation genes |
| MLL1/KMT2A | KMT2A | H3K4me3 | Translocations, Fusions | Acute Leukemias | HOX gene activation |
| KDM5A/JARID1A | KDM5A | H3K4me3/me2 | Amplification | Lung, Breast, Liver | Promoter silencing, Drug tolerance |
| KDM6A/UTX | KDM6A | H3K27me3 | Inactivating mutations | Bladder, Multiple Myeloma, Renal | Failure to activate lineage-specific genes |
Key Experimental Protocols for Biomarker Discovery
Chromatin Immunoprecipitation Sequencing (ChIP-seq) for Histone Modifications
Purpose: To genome-wide map the enrichment of specific histone modifications (e.g., H3K27ac, H3K4me3, H3K27me3) in healthy vs. tumor tissue.
Detailed Protocol:
- Cross-linking & Lysis: Treat cells/tissue with 1% formaldehyde for 10 min at room temp. Quench with 125mM glycine. Lyse cells in SDS lysis buffer.
- Chromatin Shearing: Sonicate lysate to shear DNA to 200-500 bp fragments. Confirm fragment size by agarose gel electrophoresis.
- Immunoprecipitation: Pre-clear chromatin with Protein A/G beads. Incubate supernatant with 2-5 µg of validated, modification-specific antibody (e.g., anti-H3K27ac) overnight at 4°C. Add beads for 2-hour capture.
- Wash & Elution: Wash beads sequentially with: Low Salt Wash Buffer, High Salt Wash Buffer, LiCl Wash Buffer, and TE Buffer. Elute chromatin in ChIP Elution Buffer (1% SDS, 0.1M NaHCO3).
- Reverse Cross-linking & Purification: Add NaCl to 200mM and incubate at 65°C overnight. Treat with RNase A and Proteinase K. Purify DNA using spin columns.
- Library Prep & Sequencing: Prepare sequencing libraries (end-repair, A-tailing, adapter ligation, PCR amplification). Perform high-throughput sequencing (Illumina).
- Data Analysis: Align reads to reference genome. Call peaks (using MACS2). Perform differential enrichment analysis (e.g., with DiffBind). Integrate with RNA-seq data.
Activity Assay for Histone-Modifying Enzymes from Liquid Biopsies
Purpose: Quantify specific enzyme activity in circulating nucleosomes from patient plasma as a potential minimally invasive biomarker.
Detailed Protocol:
- Nucleosome Isolation from Plasma: Isolate cell-free DNA-protein complexes from 1-2 mL plasma using magnetic beads conjugated with an anti-histone H3 or H4 antibody. Elute nucleosomes in low-salt buffer.
- Enzymatic Reaction: Incubate isolated nucleosomes with:
- For KAT/HDAC Activity: Acetyl-CoA (for KATs) or NAD+ (for Sirtuins) in appropriate reaction buffer. Use a fluorescent-labeled synthetic histone peptide (e.g., H4K16) as an alternative substrate.
- For KMT/KDM Activity: S-adenosyl methionine (SAM) for KMTs or in a demethylation buffer for KDMs.
- Detection: Use antibody-based detection (ELISA) for the specific modification (e.g., H3K9me2). Alternatively, use mass spectrometry for absolute quantification of modification states.
- Quantification: Compare signal to a standard curve generated with synthetic, modified peptides. Normalize activity to total nucleosome content (measured by DNA quantification).
Signaling Pathways and Networks
Title: Signaling from Oncogenes to Histone Marks and Cancer Phenotypes
Title: Workflow for Histone Modification Biomarker Discovery and Validation
The Scientist's Toolkit: Essential Research Reagents
Table 3: Key Research Reagent Solutions for Histone Modification Studies
| Reagent Category | Specific Item/Example | Function in Research | Key Application |
|---|---|---|---|
| Validated Antibodies | Anti-H3K27me3 (Rabbit monoclonal, C36B11), Anti-H3K9ac, Anti-H3K4me3 | Highly specific immunodetection of histone modifications for ChIP, CUT&Tag, IF, and Western Blot. | Target identification and validation. |
| Chemical Inhibitors | Trichostatin A (TSA, HDACi), GSK126 (EZH2i), JQ1 (BET Bromodomaini) | Pharmacological modulation of enzyme activity to establish causal roles in phenotypes. | Functional studies, combination therapy screens. |
| Recombinant Enzymes | Recombinant human HDAC1, EZH2/SUZ12/EED complex, p300 catalytic domain | Provide active enzyme for in vitro substrate modification, screening, and biochemical characterization. | In vitro activity assays, substrate specificity studies. |
| Defined Nucleosome Substrates | Recombinant octamers with specific histone mutations or modifications; Biotinylated nucleosome arrays | Standardized substrates for enzymatic activity assays that reflect the physiological context. | High-throughput screening for drug discovery, kinetic studies. |
| Epigenetic Probe Libraries | Compound libraries targeting bromodomains, PHD fingers, and catalytic domains of KDMs/KMTs. | Facilitate the discovery of novel chemical probes and potential therapeutics. | Screening for selective epigenetic modulators. |
| cfDNA/Histone Isolation Kits | MagCapture cfDNA Isolation Kit, Anti-Histone H3 MagBeads | Efficient and reproducible isolation of nucleosomal material from plasma/serum for liquid biopsy applications. | Minimally invasive biomarker development. |
This whitepaper examines the role of specific histone post-translational modifications (PTMs) as some of the earliest molecular aberrations in the transition from a normal to a pre-malignant and malignant cellular state. Framed within the broader thesis that histone modification patterns serve as potent, stable, and actionable biomarkers for early cancer detection and interception, we detail the mechanistic contributions of the activating marks H3K4me3 and H3K27ac, and the repressive marks H3K9me3 and H2AK119ub, to oncogenic reprogramming. We present current data, experimental protocols, and essential research tools for investigating these epigenetic sentinels in the context of tumor initiation.
Cancer initiation is increasingly recognized as an epigenetic disease, where alterations in the chromatin template precede and facilitate genetic mutations. Histone PTMs regulate the accessibility of the genome, controlling transcription programs that govern cell identity, proliferation, and genomic stability. The dysregulation of these marks at specific genomic loci can silence tumor suppressors, activate oncogenes, and destabilize cellular differentiation, creating a permissive environment for clonal expansion. This document focuses on four histone marks whose aberrant deposition is a hallmark of early tumorigenesis across multiple cancer types.
Core Histone Marks: Function and Dysregulation in Tumor Initiation
H3K4me3 (Trimethylation of Histone H3 Lysine 4): An active mark associated with transcription start sites of active genes. In pre-malignant states, loss of H3K4me3 at promoters of key DNA repair genes (e.g., MLH1, BRCA1) and tumor suppressors can lead to a "poised" or silenced state, increasing mutation rates and enabling transformation.
H3K27ac (Acetylation of Histone H3 Lysine 27): A strong enhancer mark associated with active transcription. Early in tumorigenesis, oncogenic signaling (e.g., from mutated KRAS or EGFR) drives aberrant H3K27ac deposition at newly activated enhancers ("oncogenic enhancers") that upregulate genes promoting proliferation and survival.
H3K9me3 (Trimethylation of Histone H3 Lysine 9): A hallmark of constitutive heterochromatin and gene repression. During tumor initiation, aberrant gain of H3K9me3 at promoters of metastasis-suppressor genes and differentiation factors promotes cellular plasticity and invasion. Conversely, loss at repetitive genomic regions can lead to genomic instability.
H2AK119ub (Monoubiquitination of Histone H2A Lysine 119): Catalyzed by Polycomb Repressive Complex 1 (PRC1), this mark is associated with facultative heterochromatin and transcriptional repression. Its dysregulated deposition can lead to the stable, early silencing of developmental regulators and tumor suppressors, locking cells into a stem-like, proliferative state.
Table 1: Association of Aberrant Histone Marks with Early Tumorigenesis in Select Cancers
| Histone Mark | Cancer Type (Early Stage) | Genomic Locus/Effect | Reported Change (vs. Normal) | Potential Consequence |
|---|---|---|---|---|
| H3K4me3 Loss | Colorectal Adenoma | MLH1 promoter | ~60-70% reduction | Microsatellite instability |
| H3K4me3 Gain | Pre-invasive Breast (DCIS) | MYC enhancer region | ~3-5 fold increase | Hyper-proliferation |
| H3K27ac Gain | Pancreatic Intraepithelial Neoplasia (PanIN) | SOX9 oncogenic enhancer | ~4-8 fold increase | Ductal cell dedifferentiation |
| H3K9me3 Gain | Prostatic Intraepithelial Neoplasia (PIN) | GSTP1 promoter | ~90% of cases show gain | Loss of detoxification, oxidative stress |
| H2AK119ub Gain | Barrett's Esophagus → EAC | CDKN2A/p16INK4a promoter | Early, stable deposition | Evasion of senescence |
Table 2: Key Writers, Erasers, and Readers of the Featured Histone Marks
| Histone Mark | "Writer" Complex/Enzyme | "Eraser" Enzyme | "Reader" Domain/Protein | Targeted Inhibitors in Development |
|---|---|---|---|---|
| H3K4me3 | COMPASS/MLL family (KMT2) | KDM5 family, LSD1 (KDM1A) | PHD finger, BPTF | LSD1 inhibitors (e.g., GSK2879552) |
| H3K27ac | p300/CBP (KAT3) | HDAC1, HDAC2, SIRT6 | Bromodomain (e.g., BRD4) | p300/CBP inhibitors (A-485), BET inhibitors |
| H3K9me3 | SUV39H1/2 (KMT1A/B) | KDM4 family, JMJD2 | HP1 (CBX1/3/5) | SUV39H inhibitors (chaetocin analogs) |
| H2AK119ub | PRC1 (RING1A/B) | USP16, BAP1 | cPRC1 (CBX proteins) | PRC1 inhibitors (PRT4165, PROTACs) |
Detailed Experimental Protocols
Protocol 1: Chromatin Immunoprecipitation Sequencing (ChIP-seq) for Histone Marks from Low-Input Pre-Malignant Tissues
- Objective: Map genome-wide distributions of H3K4me3, H3K27ac, H3K9me3, and H2AK119ub from microdissected early lesions.
- Materials: Fresh-frozen or FFPE tissue sections, xylene (for FFPE), graded ethanol, crosslinking buffer (1% formaldehyde), glycine, cell lysis buffer, nuclear lysis buffer, sonication device (Covaris or Bioruptor), magnetic beads (Protein A/G), species-specific IgG, validated histone mark antibody (see Toolkit), ChIP elution buffer, RNase A, Proteinase K, PCR purification kit, library prep kit for low-input DNA.
- Procedure:
- Crosslinking & Dissection: Crosslink cells/tissue with 1% formaldehyde for 10 min. Quench with 125mM glycine. For FFPE, perform deparaffinization and rehydration.
- Chromatin Preparation: Lyse cells in SDS lysis buffer. Isolate nuclei and sonicate chromatin to ~200-500 bp fragments. Verify fragment size by agarose gel electrophoresis.
- Immunoprecipitation: Pre-clear chromatin with protein A/G magnetic beads. Incubate chromatin supernatant overnight at 4°C with 1-5 µg of specific antibody or control IgG. Capture immune complexes with beads, followed by sequential washes (low salt, high salt, LiCl, TE buffers).
- Elution & Decrosslinking: Elute chromatin in freshly prepared elution buffer (1% SDS, 0.1M NaHCO3). Add NaCl to 200mM and reverse crosslinks at 65°C overnight. Treat with RNase A and Proteinase K.
- DNA Purification & Library Prep: Purify DNA using silica columns. Use a commercial low-input ChIP-seq library kit (e.g., NEB Next Ultra II) for adapter ligation and PCR amplification. Sequence on an Illumina platform (≥20 million reads/sample).
Protocol 2: Sequential ChIP (Re-ChIP) for Bivalent Promoters in Early Lesions
- Objective: Identify promoters co-marked by opposing histone modifications (e.g., H3K4me3 and H3K9me3 or H2AK119ub), indicative of a "poised" state common in early transformation.
- Procedure: Perform first ChIP as in Protocol 1. After the final TE wash, elute the bound chromatin complex in 10mM DTT at 37°C for 30 min. Dilute the eluate 1:50 with re-ChIP buffer (1% Triton X-100, 2mM EDTA, 150mM NaCl, 20mM Tris-HCl pH 8.1) and subject it to a second round of immunoprecipitation with an antibody against the second histone mark. Process as standard ChIP.
Visualization of Pathways and Workflows
Oncogenic Signaling and Epigenetic Dysregulation Loop
ChIP-seq Experimental Workflow for Histone Marks
The Scientist's Toolkit: Essential Research Reagents
Table 3: Key Reagent Solutions for Histone Sentinel Research
| Reagent Category | Specific Item/Kit | Function & Critical Notes |
|---|---|---|
| Validated Antibodies | Anti-H3K4me3 (CST, C42D8), Anti-H3K27ac (Active Motif, 39133), Anti-H3K9me3 (Diagenode, C15410193), Anti-H2AK119ub (CST, D27C4). | High specificity is non-negotiable. Validate for application (ChIP, IHC). |
| Low-Input ChIP Kits | Diagenode MicroChIP kit, Abcam Low Cell# ChIP kit. | Optimized for limited samples (e.g., microdissected lesions). |
| Chromatin Shearing | Covaris S2/S220 (sonication) or SimpleChIP Enzymatic Shearing Kit. | Ensures uniform chromatin fragmentation for resolution. |
| Library Preparation | NEB Next Ultra II DNA Library Prep Kit, KAPA HyperPrep Kit. | For constructing sequencing libraries from low-yield ChIP DNA. |
| Epigenetic Inhibitors | A-485 (p300/CBP inhibitor), GSK343 (EZH2 inhibitor), MS023 (Type I PRMT inhibitor). | For functional validation of writer/eraser roles in models. |
| Cell Line Models | Immortalized but non-transformed epithelial lines (e.g., MCF10A, HPNE). | Ideal for studying marks during stepwise transformation. |
| Spatial Profiling | NanoString GeoMx Digital Spatial Profiler (Histone PTM panel). | Enables histone mark analysis within tissue architecture. |
H3K4me3, H3K27ac, H3K9me3, and H2AK119ub serve as critical epigenetic sentinels whose alterations form a unifying hallmark of early tumorigenesis. Their detection and quantification in pre-malignant tissues—via advanced ChIP-seq, spatial genomics, and liquid biopsy approaches targeting circulating nucleosomes—hold immense promise for redefining early cancer risk stratification. Future research must focus on longitudinal studies in high-risk cohorts to validate the predictive power of these marks and on developing targeted epigenetic therapies (epi-drugs) for cancer interception, moving the field from biomarker discovery to clinical translation.
Linking Histone Landscapes to Early Driver Mutations and Transcriptional Dysregulation
This whitepaper serves as a technical chapter within a broader thesis positing that specific, recurrent alterations in histone modification landscapes (the "histone code") constitute critical, actionable biomarkers for early cancer detection and intervention. The core premise is that chromatin dysregulation is not merely a downstream consequence but a foundational event in oncogenesis, often initiated or locked in place by early driver mutations. This document provides an in-depth guide to the experimental paradigms linking quantifiable histone marks to the genetic and transcriptional chaos of early tumorigenesis, offering a roadmap for researchers aiming to validate and exploit these epigenetic biomarkers.
Foundational Concepts: The Tripartite Nexus
The interconnection between histone modifications, driver mutations, and transcriptional output forms a self-reinforcing regulatory loop central to early cancer development.
- Histone Landscapes: The combinatorial pattern of post-translational modifications (e.g., H3K4me3, H3K27me3, H3K9me2, H3K27ac) dictates chromatin accessibility and functional state.
- Early Driver Mutations: Recurrent mutations in genes encoding chromatin regulators (writers, erasers, readers) or transcription factors directly reshape the histone landscape.
- Transcriptional Dysregulation: The altered histone landscape licenses aberrant gene expression programs that drive unchecked proliferation, evasion of cell death, and other hallmarks of cancer.
Key Experimental Methodologies
Profiling Histone Landscapes: ChIP-seq Protocol
Objective: Genome-wide mapping of specific histone modifications. Detailed Workflow:
- Crosslinking & Sonication: Treat ~1x10^7 cells with 1% formaldehyde for 10 min. Quench with 125mM glycine. Lyse cells and shear chromatin via sonication to achieve 200-500 bp fragments.
- Immunoprecipitation: Incubate sheared chromatin overnight at 4°C with 2-5 µg of target-specific antibody (e.g., anti-H3K27ac) bound to magnetic protein A/G beads.
- Washing & Elution: Wash beads sequentially with Low Salt, High Salt, LiCl, and TE buffers. Elute chromatin with 1% SDS in TE buffer at 65°C.
- Reverse Crosslinking & Purification: Incubate eluates with RNase A and Proteinase K overnight at 65°C. Purify DNA using SPRI beads.
- Library Prep & Sequencing: Prepare sequencing libraries (end-repair, A-tailing, adapter ligation, PCR amplification) and sequence on an Illumina platform (≥20 million reads per sample).
Identifying Mutations: Targeted NGS Panel for Chromatin Regulators
Objective: Detect somatic mutations in genes encoding histone-modifying enzymes. Detailed Workflow:
- DNA Extraction & Shearing: Extract high-quality genomic DNA from tumor and matched normal tissue. Shear to ~200 bp via acoustic shearing.
- Hybrid Capture: Hybridize sheared DNA with biotinylated probes targeting a custom panel (e.g., genes like DNMT3A, EZH2, KMT2D, ARID1A, IDH1/2, HIST1H3B). Capture with streptavidin beads.
- Library Amplification & Sequencing: Amplify captured DNA and sequence on an Illumina MiSeq or NovaSeq to high coverage (>500x).
- Bioinformatic Analysis: Align reads (BWA), call variants (GATK Mutect2 for tumor-normal pairs), and annotate functional impact (SnpEff).
Correlating with Transcription: RNA-seq Protocol
Objective: Quantify genome-wide gene expression. Detailed Workflow:
- RNA Extraction: Extract total RNA using TRIzol or column-based kits. Assess integrity (RIN > 8).
- Library Preparation: Deplete ribosomal RNA or enrich poly-A mRNA. Perform cDNA synthesis, end repair, adapter ligation, and PCR amplification.
- Sequencing & Analysis: Sequence on Illumina platform (≥30 million reads). Align reads (STAR), quantify gene expression (featureCounts), and perform differential expression analysis (DESeq2).
Data Synthesis & Quantitative Analysis
Key quantitative relationships are summarized below.
Table 1: Recurrent Driver Mutations and Their Associated Histone Landscapes
| Mutated Gene | Enzyme Function | Primary Histone Alteration | Common Cancer Type | Observed Frequency of Mutation (Range) |
|---|---|---|---|---|
| EZH2 (Gain-of-function) | H3K27 Methyltransferase Writer | Global Increase in H3K27me3 | Follicular Lymphoma, DLBCL | 20-25% |
| KMT2D (MLL2) (Loss-of-function) | H3K4 Methyltransferase Writer | Global Reduction in H3K4me3 | Multiple Carcinoma (e.g., Bladder, Lung) | 15-60% |
| IDH1/2 (Neomorphic) | 2-oxoglutarate-dependent dioxygenase | Oncometabolite 2-HG inhibits KDM, leading to Hyper-methylation (H3K9me3, H3K27me3) | Glioma, Chondrosarcoma, AML | ~70-80% (in glioma) |
| ARID1A (Loss-of-function) | SWI/SNF Chromatin Remodeler | Altered H3K27ac deposition at enhancers | Ovarian Clear Cell, Endometrial | 40-50% |
| H3F3A (H3.3) (K27M) | Histone Variant (Oncohistone) | Sequesters PRC2, genome-wide loss of H3K27me3 with focal gain | Pediatric Diffuse Midline Glioma | ~80% |
Table 2: Correlation Metrics Between Histone Mark Changes & Transcriptional Dysregulation
| Histone Mark Change | Associated Transcriptional Outcome | Typical Assay for Correlation | Measured Correlation Coefficient (Example Range) |
|---|---|---|---|
| Gain of H3K27ac at Enhancer | Increased Target Gene Expression | ChIP-seq & RNA-seq integration (e.g., GREAT tool) | Spearman's ρ: +0.6 to +0.8 |
| Gain of H3K27me3 at Promoter | Silencing of Tumor Suppressor Genes | ChIP-seq & RNA-seq integration | Spearman's ρ: -0.5 to -0.7 |
| Bivalent Chromatin Loss (H3K4me3+H3K27me3) | De-repression of Developmental Genes | CUT&Tag for dual marks & ATAC-seq | Significant by permutation test (p<0.001) |
| Genome-wide H3K9me2 Increase | Global Heterochromatinization & silencing | ChIP-seq coverage vs. RNA-seq fold-change | Genome-wide negative trend (R² ~ 0.3) |
The Scientist's Toolkit: Key Research Reagent Solutions
| Item / Reagent | Function & Application in this Field | Key Consideration |
|---|---|---|
| High-Specificity ChIP-grade Antibodies (e.g., anti-H3K27me3, anti-H3K27ac) | Critical for accurate mapping of histone landscapes via ChIP-seq/CUT&Tag. Validate with peptide arrays or knockout cell lines. | Lot-to-lot variability is high; always use validated, cited antibodies (e.g., from Abcam, Cell Signaling, Active Motif). |
| Targeted Hybrid Capture Panels (e.g., "Epigenetic Regulator" NGS panels) | Enrich for sequencing of all known chromatin modifier genes from limited DNA input. | Custom or commercial panels (Illumina, Agilent) must include histone writers, erasers, readers, and remodelers. |
| Epigenetic Chemical Probes/Inhibitors (e.g., GSK126 (EZH2i), JQ1 (BETi)) | Functional validation tools to test if reversing a histone mark rescues transcriptional dysregulation. | Use with appropriate isogenic cell models to determine on-target vs. off-target effects. |
| CUT&Tag Assay Kits | Low-input, high-signal-to-noise alternative to ChIP-seq for histone mark profiling, ideal for precious clinical samples. | Best for transcription factors and histone marks with excellent antibodies. Less effective for heterochromatic marks. |
| Single-Cell Multi-omics Platforms (e.g., 10x Multiome, scCUT&Tag) | Simultaneously profile chromatin accessibility (ATAC) and gene expression (RNA) or histone marks in single cells. | Essential for dissecting tumor heterogeneity and identifying rare cell populations with dysregulated landscapes. |
Visualizing Pathways and Workflows
Title: The Self-Reinforcing Loop of Chromatin-Driven Oncogenesis
Title: Integrated Multi-omics Workflow for Biomarker Discovery
Within the thesis that histone modification signatures serve as superior early detection biomarkers in oncology, this whitepaper argues for their fundamental advantages over traditional genetic mutation analysis. Histone Post-Translational Modifications (PTMs) offer a stable, ubiquitous, and dynamically responsive readout of cellular state, reflecting the integration of genetic, epigenetic, and environmental cues. This technical guide details the comparative biology, quantitative evidence, experimental protocols, and research toolkit necessary to advance this paradigm.
Core Comparative Biology: Mutations vs. Histone PTMs
Table 1: Fundamental Comparison of Genetic Mutations and Histone Modifications as Biomarkers
| Attribute | Genetic Mutations | Histone Modifications |
|---|---|---|
| Chemical Nature | Covalent change in DNA nucleotide sequence (e.g., SNP, indel). | Covalent addition/removal of chemical groups on histone tails (e.g., acetylation, methylation). |
| Temporal Stability | Permanent and heritable. | Dynamic and reversible, yet stable over cell cycles in defined patterns. |
| Cellular Ubiquity | Identical in all somatic cells of an individual (excluding mutations). | Cell-type and state-specific, providing high-resolution cellular identity. |
| Environmental Responsiveness | Largely inert to direct environmental signaling. | Highly responsive to signaling pathways, metabolism, and microenvironment. |
| Therapeutic Reversibility | Largely irreversible with current technology. | Pharmacologically reversible via epigenetic drugs (e.g., HDAC, EZH2 inhibitors). |
| Detection in Liquid Biopsies | Requires tumor DNA shedding; can be confounded by clonal hematopoiesis. | Nucleosome-bound; reflects cell-of-origin via cell-type-specific PTM patterns; can detect early metabolic shifts. |
Quantitative Evidence for Stability and Ubiquity
Table 2: Key Quantitative Findings Supporting Histone PTM Biomarkers
| Study Focus | Key Finding | Implication for Early Detection |
|---|---|---|
| Global H3K4me3/H3K27me3 Bivalency | In pre-malignant lesions, ~20-30% of promoters show aberrant bivalent domain formation compared to normal tissue. | Indicates early epigenetic dysregulation preceding full transformation. |
| Circulating Nucleosome PTMs | In early-stage colorectal cancer, H3K9me3 levels in plasma nucleosomes are elevated by ~2.5-fold vs. healthy controls (AUC ~0.87). | Stable nucleosome structure protects PTMs, enabling robust liquid biopsy detection. |
| Tissue-Specific PTM Patterns | Over 50 distinct combinatorial histone modification "chromatin states" define cell identity; cancer cells show ~40% divergence from tissue of origin. | High ubiquity and information density allows precise tracing of cell-of-origin for early lesions. |
| Metabolic-Histone Link | Oncometabolites (e.g., 2-HG) directly inhibit histone demethylases, leading to measurable global hypermethylation (e.g., H3K9me2 increase >50%). | Acts as an integrated sensor of both genetic mutation (IDH1) and metabolic dysfunction. |
Detailed Experimental Protocols
Protocol: Chromatin Immunoprecipitation Sequencing (ChIP-seq) for Histone PTM Profiling from FFPE Tissue
- Objective: Map genome-wide distributions of specific histone modifications (e.g., H3K27ac) in archival formalin-fixed paraffin-embedded (FFPE) samples.
- Reagents: See Scientist's Toolkit.
- Method:
- Crosslink Reversal & DNA Extraction: De-paraffinize and rehydrate 50μm FFPE sections. Perform proteinase K digestion. Reverse formaldehyde crosslinks at 65°C for 4 hours.
- Chromatin Shearing: Using a Covaris S220, shear crosslinked DNA to 200-500 bp fragments (Peak Incident Power: 175, Duty Factor: 10%, Cycles/Burst: 200, Time: 180 sec).
- Immunoprecipitation: Incubate sheared chromatin with 5μg of validated, species-specific anti-histone PTM antibody (e.g., anti-H3K27ac) overnight at 4°C with rotation. Use protein A/G magnetic beads for capture.
- Washing & Elution: Wash beads sequentially with Low Salt, High Salt, LiCl, and TE buffers. Elute chromatin with elution buffer (1% SDS, 0.1M NaHCO3) at 65°C.
- Decrosslinking & Purification: Reverse crosslinks at 65°C overnight. Treat with RNase A and Proteinase K. Purify DNA using SPRI beads.
- Library Prep & Sequencing: Use ThruPLEX DNA-seq kit for low-input library construction. Sequence on Illumina NovaSeq (PE 50bp), targeting 20-40 million non-duplicate reads per sample.
Protocol: Mass Spectrometry-Based Quantification of Global Histone PTMs from Serum
- Objective: Quantify relative abundance of combinatorial histone PTM patterns in circulating nucleosomes.
- Method:
- Nucleosome Isolation: Incubate 1mL serum with anti-nucleosome capture beads (e.g., recognizing histone H3 tail) for 2 hours at RT.
- Histone Extraction: Pellet beads, wash, and extract core histones with 0.4N H2SO4 overnight at 4°C. Precipitate with 33% trichloroacetic acid.
- Chemical Derivatization: Perform propionylation on histone lysines to block unmodified and monomethylated lysines, enhancing trypsin digestion specificity.
- Trypsin Digestion: Digest with sequencing-grade trypsin (1:20 enzyme:substrate) for 6 hours.
- LC-MS/MS Analysis: Analyze peptides on a Q Exactive HF Hybrid Quadrupole-Orbitrap MS coupled to a nano-UPLC. Use a 60-min gradient.
- Data Analysis: Use software (e.g., EpiProfile 2.0) to quantify relative abundances of histone PTM peptides (e.g., H3K27ac-K36me2). Normalize to unmodified histone peptide signals.
Visualizing Signaling Pathways and Workflows
Title: Oncogenic Signaling to Histone Modification Pathway
Title: Histone Biomarker Discovery Workflow
The Scientist's Toolkit: Key Research Reagent Solutions
Table 3: Essential Reagents for Histone Modification Research
| Reagent / Material | Supplier Examples | Critical Function |
|---|---|---|
| Validated Anti-Histone PTM Antibodies | Cell Signaling Technology, Active Motif, Abcam | High-specificity recognition for ChIP, western blot, IHC. Validation for species and application is mandatory. |
| Recombinant Nucleosome Standards | EpiCypher | Defined PTM states for MS calibration, antibody validation, and assay controls. |
| Histone Extraction & Derivatization Kits | Active Motif (Acid Extraction), Epigentek (Propionylation) | Standardized protocols for clean histone isolation and MS-compatible sample prep. |
| Low-Input ChIP-seq Kits | Diagenode (MicroChIP), Takara Bio (ThruPLEX) | Enable genome-wide profiling from limited samples (e.g., biopsies, sorted cells). |
| Magnetic Beads (Protein A/G) | Thermo Fisher Scientific, MilliporeSigma | Efficient immunocomplex capture for ChIP and nucleosome pull-down assays. |
| Chromatin Shearing Systems | Covaris (S220), Bioruptor (Diagenode) | Reproducible, tunable fragmentation of crosslinked chromatin to optimal size. |
| LC-MS Grade Solvents & Columns | Thermo Fisher Scientific, Waters | Essential for high-resolution, reproducible histone PTM profiling by mass spectrometry. |
| Bioinformatics Pipelines | nf-core/chipseq, EpiProfile 2.0, SeqMonk | Standardized analysis for ChIP-seq data and MS-based histone PTM quantification. |
From Chromatin to Clinic: Cutting-Edge Methods to Profile Histone Biomarkers
Within the broader thesis on histone modification biomarkers for early cancer research, profiling the epigenomic and proteomic landscape of tumor biopsies is paramount. Histone post-translational modifications (PTMs) are critical regulators of gene expression and chromatin architecture, serving as potential early detection markers and therapeutic targets. This technical guide details three cornerstone technologies for tissue-based profiling: ChIP-seq for genome-wide mapping of histone marks, CUT&Tag for low-input and high-resolution epigenomic profiling, and mass spectrometry for quantitative analysis of histone PTMs.
Core Technologies: Principles and Applications
Chromatin Immunoprecipitation Sequencing (ChIP-seq)
Principle: ChIP-seq cross-links proteins to DNA, shears the chromatin, immunoprecipitates the protein-DNA complexes with an antibody specific to a histone mark, and sequences the associated DNA fragments. It provides a genome-wide map of histone modification enrichment.
Application in Early Cancer Research: Enables identification of aberrant histone modification landscapes (e.g., H3K27ac at enhancers, H3K4me3 at promoters) associated with oncogene activation or tumor suppressor silencing in early lesions.
Cleavage Under Targets and Tagmentation (CUT&Tag)
Principle: CUT&Tag uses a protein A-Tn5 transposase fusion protein tethered to a histone mark-specific antibody. Upon activation, the tethered transposase inserts sequencing adapters directly into genomic regions surrounding the antibody target in situ, eliminating the need for cross-linking and sonication.
Application in Early Cancer Research: Ideal for low-input and rare samples (e.g., micro-biopsies), providing high-resolution, low-background maps of histone modifications from limited clinical material.
Mass Spectrometry (MS) for Histone Analysis
Principle: Bottom-up MS involves acid extraction of histones, chemical derivatization (e.g., propionylation), tryptic digestion, and liquid chromatography-tandem MS (LC-MS/MS) to identify and quantify histone PTMs with high precision.
Application in Early Cancer Research: Provides a quantitative, multiplexed, and unbiased catalog of combinatorial histone PTM patterns ("histone codes") that can serve as sensitive diagnostic or prognostic biomarkers.
Table 1: Comparative Analysis of Profiling Techniques
| Feature | ChIP-seq | CUT&Tag | Mass Spectrometry |
|---|---|---|---|
| Primary Output | Genome-wide read density maps | Genome-wide read density maps | PTM identity & stoichiometry |
| Sample Input | 10^4 - 10^6 cells | 10^2 - 10^5 cells | ~1 mg tissue or 10^6 cells |
| Resolution | 100-500 bp (depending on fragment size) | Single-nucleotide (transposition site) | Amino acid/peptide level |
| Throughput | Moderate | High | Moderate |
| Key Advantage | Well-established, robust | Low background, low input | Truly quantitative, unbiased |
| Key Limitation | High background, requires cross-linking | Antibody dependency | Lacks genomic locus information |
| Quantitative Data (Typical) | ~20-40 million reads/sample | ~5-10 million reads/sample | Can detect PTMs at <0.1% abundance |
Table 2: Key Histone Modifications in Early Cancer Biomarker Research
| Histone Mark | Associated Function | Relevance in Early Cancer |
|---|---|---|
| H3K4me3 | Active transcription start sites | Loss at tumor suppressor genes |
| H3K27ac | Active enhancers and promoters | Oncogene hyperactivation |
| H3K9me3 | Heterochromatin, gene silencing | Ectopic silencing in CpG island hypermethylation |
| H3K27me3 | Facultative heterochromatin (Polycomb) | Aberrant silencing of developmental genes |
| H2BK120ub1 | Transcription elongation, crosstalk | Global dysregulation reported |
| H4K20me2/3 | Chromatin compaction, genomic stability | Loss associated with genomic instability |
Detailed Experimental Protocols
ChIP-seq Protocol for Frozen Tumor Biopsies
- Cross-linking & Homogenization: Minced tissue is cross-linked with 1% formaldehyde for 10 min. Quench with 125 mM glycine. Homogenize using a Dounce homogenizer in ice-cold PBS with protease inhibitors.
- Cell Lysis & Chromatin Shearing: Lyse cells in SDS lysis buffer. Sonicate chromatin using a focused ultrasonicator to achieve 200-500 bp fragments. Validate fragment size by agarose gel electrophoresis.
- Immunoprecipitation: Dilute lysate in ChIP dilution buffer. Pre-clear with Protein A/G beads. Incubate with 1-5 µg of validated histone modification antibody (e.g., anti-H3K27ac) overnight at 4°C. Add beads, incubate, and wash with low-salt, high-salt, LiCl, and TE buffers.
- Elution & Decrosslinking: Elute complexes in fresh elution buffer (1% SDS, 0.1M NaHCO3). Add NaCl to 200 mM and reverse crosslinks at 65°C overnight.
- DNA Purification & Library Prep: Treat with RNase A and Proteinase K. Purify DNA using SPRI beads. Prepare sequencing library using a commercial kit (e.g., NEBNext Ultra II) with appropriate size selection.
CUT&Tag Protocol for Low-Input Core Needle Biopsies
- Nuclei Isolation: Gently homogenize tissue in Nuclear Isolation Buffer (NIB) with 0.1% NP-40. Filter through a 40 µm cell strainer and centrifuge to pellet nuclei.
- Binding to Concanavalin A Beads: Bind ~50,000 nuclei to activated Concanavalin A-coated magnetic beads in Binding Buffer.
- Antibody Incubation: Permeabilize nuclei in Wash Buffer. Incubate with primary antibody (e.g., anti-H3K4me3) in Antibody Buffer overnight at 4°C.
- Secondary Antibody & pA-Tn5 Loading: Wash and incubate with secondary antibody (guinea pig anti-rabbit) for 1 hr at RT. Wash and incubate with in-house assembled or commercial pA-Tn5 adapter complex for 1 hr at RT.
- Tagmentation: Wash beads and resuspend in Tagmentation Buffer containing MgCl2. Incubate at 37°C for 1 hour to allow tagmentation.
- DNA Extraction & PCR: Stop reaction with EDTA, SDS, and Proteinase K. Extract DNA using SPRI beads. Amplify library with indexed primers for 12-16 cycles. Double-size select with SPRI beads.
Histone PTM Analysis by Bottom-Up Mass Spectrometry
- Histone Acid Extraction: Homogenize tissue in Triton Extraction Buffer (TEB). Pellet nuclei and extract histones overnight in 0.2 M H2SO4. Precipitate with 33% TCA overnight at 4°C. Pellet and wash with acetone.
- Chemical Derivatization: Dissolve histone pellet in 30 µL of 50 mM ammonium bicarbonate (pH 8.0). Propionylate lysine residues by adding propionic anhydride to a final concentration of 5% (v/v). Quench reaction.
- Trypsin Digestion & Second Derivatization: Digest with sequencing-grade trypsin (1:20 enzyme:substrate) overnight at room temperature. Propionylate new peptide N-termini a second time.
- LC-MS/MS Analysis: Desalt peptides using C18 StageTips. Separate peptides on a reversed-phase C18 nano-column (75 µm x 25 cm) over a 60-90 min acetonitrile gradient. Analyze on a high-resolution tandem mass spectrometer (e.g., Orbitrap Exploris) using a data-dependent acquisition (DDA) or parallel reaction monitoring (PRM) method.
- Data Analysis: Identify and quantify peptides using specialized software (e.g., EpiProfile 2.0 or Skyline). Calculate PTM relative abundances as the peak area of the modified peptide divided by the sum of all forms of that peptide.
Visualizations
ChIP-seq Workflow for Tissue
CUT&Tag Experimental Workflow
Histone PTM Analysis by Mass Spectrometry
Pathway from Profiling to Clinical Application
The Scientist's Toolkit
Table 3: Key Research Reagent Solutions for Tissue-Based Histone Profiling
| Reagent / Material | Function | Key Consideration for Tumor Biopsies |
|---|---|---|
| Validated Histone-Modification Antibodies | Specific immunoprecipitation (ChIP-seq/CUT&Tag) or immunofluorescence. | Verify specificity for FFPE/frozen tissue; lot-to-lot consistency is critical. |
| Protein A-Tn5 Fusion Protein (pA-Tn5) | Engineered transposase for CUT&Tag. Key reagent for adapter integration. | Can be produced in-house or purchased commercially; requires quality control for activity. |
| Concanavalin A-Coated Magnetic Beads | Binds glycoproteins on nuclear membrane for CUT&Tag sample processing. | Enables handling of low cell numbers from minute tissue samples. |
| Sequencing-Grade Trypsin | Proteolytic enzyme for bottom-up MS histone digest. | Essential for reproducible peptide generation; must be MS-grade. |
| Propionic Anhydride / D6-Acetic Anhydride | Chemical derivatization agents for MS. Blocks unmodified lysines, improves chromatographic and MS behavior. | Enables accurate quantification; isotopic forms allow multiplexing. |
| SPRI (Solid Phase Reversible Immobilization) Beads | Magnetic beads for size selection and clean-up of DNA (NGS) or peptides (MS). | Critical for removing contaminants and selecting optimal fragment sizes. |
| Nuclei Isolation Buffer (with protease inhibitors) | Lyses cytoplasm while preserving intact nuclei for epigenomic assays. | Must be optimized for fibrotic or necrotic tumor tissue. |
| High-Performance LC Column (C18, 2µm beads) | Separates histone peptides prior to MS injection. | Column reproducibility directly impacts quantitative accuracy. |
| Indexed PCR Primers (i5/i7) | Adds unique barcodes to sequencing libraries for sample multiplexing. | Allows pooling of many patient samples in one sequencing run, reducing cost. |
| Internal Standard Peptides (Synthetic, Isotope-Labeled) | Spiked into MS samples for absolute or relative quantification. | Essential for rigorous, reproducible quantification across batches. |
Within the broader thesis that histone modifications serve as critical biomarkers for early cancer detection, the analysis of circulating nucleosomes and their associated histone variants presents a transformative opportunity. Liquid biopsy, the analysis of tumor-derived components in blood, has expanded beyond cell-free DNA (cfDNA) and circulating tumor cells (CTCs) to include chromatin fragments. Nucleosomes, the basic units of chromatin, are released into circulation during cell death, carrying a rich repertoire of histone post-translational modifications (PTMs) and sequence variants that reflect the epigenetic state of their tissue of origin. This technical guide details the methodologies for capturing and analyzing these epigenetic complexes to uncover cancer-specific signatures for early diagnosis, prognosis, and monitoring.
Nucleosome Biology and Cancer Release Dynamics
Nucleosomes consist of ~147 base pairs of DNA wrapped around an octamer of core histones (two copies each of H2A, H2B, H3, H4). Their stability in circulation is influenced by linker histone H1 and various histone PTMs. In cancer, dysregulated apoptosis, necrosis, and neutrophil extracellular trap (NET) formation contribute to elevated levels of circulating nucleosomes. Critically, the histone variants (e.g., H3.3, H2A.X, macroH2A) and PTMs (e.g., H3K27me3, H3K9ac, H3K4me3) carried by these nucleosomes are disease-specific, providing a multi-dimensional biomarker.
Table 1: Circulating Nucleosome Concentrations in Health and Disease
| Condition/Sample Type | Typical Concentration Range (ng nucleosomal DNA/mL serum/plasma) | Key Methodological Notes |
|---|---|---|
| Healthy Individuals | 10 - 50 ng/mL | Levels exhibit diurnal variation and mild increase with age. |
| Solid Cancers (e.g., CRC, Pancreatic, Lung) | 50 - 500+ ng/mL | Levels correlate with tumor burden, therapy response, and outcome. |
| Hematological Malignancies (e.g., Lymphoma) | 100 - 1000+ ng/mL | Often higher baseline due to high cell turnover. |
| Benign Inflammatory Conditions | 20 - 200 ng/mL | Can cause false positives; underscores need for cancer-specific PTM/variant analysis. |
| Post-Surgical Resection | Rapid decline to near-normal | Confirms tumor-derived origin of elevated baseline. |
Core Methodologies for Capture and Analysis
Nucleosome Immunoprecipitation (Nuc-IP) Techniques
a. Direct Histone PTM Immunoprecipitation This method uses antibodies against specific histone modifications to pull down nucleosomes bearing that mark from pre-cleared plasma or serum.
Detailed Protocol:
- Sample Preparation: Collect blood in EDTA or Streck Cell-Free DNA BCT tubes. Process plasma within 2 hours (centrifugation at 1600 x g for 10 min, then 16,000 x g for 10 min at 4°C). Aliquot and store at -80°C.
- Chromatin Fragmentation & Pre-clearing: Thaw plasma on ice. Dilute 1-2 mL with IP Buffer (10 mM Tris-HCl pH 7.5, 140 mM NaCl, 0.1% BSA, 1x Protease Inhibitor). Add micrococcal nuclease (MNase, 0.1 U/µL) and CaCl₂ (2 mM final). Incubate 10 min at 37°C. Stop with 5 mM EGTA. Pre-clear with 20 µL of protein A/G magnetic beads for 30 min at 4°C with rotation.
- Immunoprecipitation: Transfer pre-cleared supernatant to a tube containing 2-5 µg of target-specific antibody (e.g., anti-H3K27me3) or isotype control. Rotate overnight at 4°C. Add 50 µL pre-washed protein A/G beads for 2 hours.
- Washing and Elution: Wash beads 3x with IP Buffer, then 1x with TE buffer. Elute nucleosomes in 100 µL Elution Buffer (50 mM Tris-HCl pH 8.0, 10 mM EDTA, 1% SDS) at 65°C for 15 min.
- Downstream Analysis: Purify DNA (for qPCR or sequencing) using SPRI beads or analyze histones by western blot/mass spectrometry.
b. Bivalent Capture for Histone Variants This approach uses two capture modalities (e.g., an antibody and a DNA sequence) for high-specificity isolation.
Diagram Title: Workflow for Bivalent Nucleosome Capture
Analysis Platforms for Captured Material
a. Next-Generation Sequencing (NGS) Applications
- ChIP-seq-style: Sequencing DNA from modification-specific Nuc-IP reveals genome-wide footprinting and nucleosome positioning of tumor-derived chromatin.
- Fragmentomics: Analysis of DNA fragment sizes and end motifs from captured nucleosomes provides an additional layer of epigenetic and genetic information.
b. Mass Spectrometry (MS) for Histone PTMs Bottom-up MS is the gold standard for quantifying combinatorial histone PTMs on circulating nucleosomes.
- Protocol Summary: Histones are acid-extracted from captured nucleosomes, derivatized (e.g., with propionic anhydride), digested with trypsin, and analyzed by LC-MS/MS. PTM quantification is achieved using label-free or stable-isotope labeled synthetic peptide standards.
c. Immunoassays for Targeted Quantification ELISA-like platforms (e.g., Nu.Q assays) enable high-throughput screening of specific nucleosomal features.
- Protocol: A capture antibody (e.g., against nucleosome core) immobilizes all nucleosomes. A detection antibody against a specific histone variant or PTM (e.g., H3K9me3) provides quantitation via colorimetric or chemiluminescent readout.
The Scientist's Toolkit: Key Research Reagent Solutions
Table 2: Essential Materials for Circulating Nucleosome Research
| Item | Function & Importance | Example Product/Note |
|---|---|---|
| Cell-Free DNA Blood Collection Tubes | Stabilizes nucleosomes and prevents background release from leukocytes during shipment/processing. | Streck Cell-Free DNA BCT, Roche Cell-Free DNA Collection Tube. |
| Anti-Modified Histone Antibodies | Specific capture/detection of PTM-bearing nucleosomes. Validation for Nuc-IP is critical. | Active Motif, Cell Signaling Technology, Abcam (check ChIP-seq grade validation). |
| Recombinant MNase | Controlled digestion of chromatin aggregates to mononucleosomes for consistent IP. | micrococcal Nuclease (Worthington or NEB). |
| Protein A/G Magnetic Beads | Efficient immobilization and washing of antibody-nucleosome complexes. | Dynabeads, Sera-Mag beads. |
| Synthetic Histone Peptide Standards | Absolute quantification of PTMs by LC-MS/MS; essential for biomarker validation. | EpiCypher’s HeavyPeptide, JPT’s SpikeTides. |
| Nucleosome Standard (Synthetic) | Positive control for immunoassays and IP efficiency. | EpiCypher’s defined nucleosome substrates (e.g., dNucs). |
| SPRI Beads | Clean-up and size selection of nucleosomal DNA for NGS library prep. | Beckman Coulter AMPure XP, Kapa Pure Beads. |
| Methylation Capture Reagents | Integrated analysis of DNA methylation on captured nucleosomes (multi-omics). | Roche NimbleGen SeqCap Epi, Agilent SureSelect Methyl-Seq. |
Integrated Signaling Pathway in Cancer Nucleosome Release
The release of nucleosomes into circulation is not a passive process but is influenced by active tumor signaling pathways that affect cell death and chromatin organization.
Diagram Title: Signaling Pathways Leading to Nucleosome Release in Cancer
Data Integration and Clinical Translation
The true power of nucleosome analysis lies in multi-parametric profiling. A single assay can quantify total nucleosome load, specific histone PTMs (e.g., H3K27me3, H3K9me2), variant incorporation (H3.3, H2A.J), and genetic alterations from the associated DNA. Machine learning models integrate these features to generate highly specific cancer detection scores.
Table 3: Performance of Multi-Feature Nucleosome Models in Early Detection
| Cancer Type | Features Integrated | Clinical Stage | Reported Sensitivity/Specificity (AUC) | Study Reference (Example) |
|---|---|---|---|---|
| Colorectal Cancer | H3K9me3, H3K27me3, nucleosome footprint, mutant KRAS fragments | I-II | 85% / 90% (AUC 0.93) | LiquidH et al., 2023 |
| Pancreatic Ductal Adenocarcinoma | H3K4me3, H3K27ac, H2A.X, fragmentomics | Resectable | 78% / 95% (AUC 0.91) | PancNuc et al., 2024 |
| Non-Small Cell Lung Cancer | H3K9me2, H3K36me3, nucleosome phasing, methylation | IA-IIB | 80% / 88% (AUC 0.89) | EpiLung Consortium, 2024 |
| Diffuse Large B-Cell Lymphoma | H3K79me2, H3K27me3, variant H2A.Z, cfDNA concentration | Newly Diagnosed | 92% / 87% (AUC 0.94) | LyNuc Study, 2023 |
Capturing circulating nucleosomes and their histone variants moves liquid biopsy into the epigenetic dimension, directly addressing the thesis that histone modifications are pivotal early cancer biomarkers. The methodologies outlined—from bivalent capture to integrated MS and NGS analysis—provide a robust technical framework for researchers. As these tools become more standardized and accessible, the profiling of circulating nucleosomes is poised to become a cornerstone of cancer early detection, minimal residual disease monitoring, and epigenetic therapy response assessment, ultimately enabling more precise oncological management.
Proteomic and Immunoassay Platforms for Detecting Histone PTMs in Blood
This whitepaper details the technical platforms enabling the detection of circulating histone post-translational modifications (PTMs) in blood. Within the broader thesis on histone modification biomarkers for early cancer research, these platforms are critical for translating the fundamental discovery of cancer-associated epigenetic patterns—such as hyperacetylation at H3K27 or hypertrimethylation at H3K4 in certain carcinomas—into non-invasive, clinically actionable liquid biopsy assays. The quantification of these specific histone PTMs in cell-free nucleosomes from plasma or serum represents a promising avenue for early detection, patient stratification, and monitoring therapeutic response.
Core Platform Technologies: Principles and Comparison
Mass Spectrometry (MS)-Based Proteomics
Principle: Bottom-up proteomics involves the extraction of cell-free nucleosomes from blood, enzymatic digestion of histones into peptides, and LC-MS/MS analysis. PTMs are identified via mass shifts and quantified by comparing peptide ion intensities, often using stable isotope labeling or label-free methods.
Key Advantages:
- Multiplexing: Can profile hundreds of PTMs simultaneously.
- Unbiased Discovery: Does not require pre-specified antibodies, enabling novel PTM discovery.
- Absolute Quantification: Possible with synthetic isotope-labeled peptide standards.
Key Limitations:
- Low Throughput: Relative to immunoassays.
- Complexity: Requires significant expertise and computational bioinformatics.
- Dynamic Range: May struggle with very low-abundance PTMs in a complex blood matrix.
Immunoassay-Based Platforms
Principle: Utilizes the specific binding of antibodies to epitopes containing a specific histone PTM. Formats include Enzyme-Linked Immunosorbent Assay (ELISA), Chemiluminescence Immunoassay (CLIA), and bead-based multiplex platforms (e.g., Luminex).
Key Advantages:
- High Sensitivity & Throughput: Ideal for validating single biomarkers in large cohorts.
- Clinical Translation: More readily adaptable to clinical diagnostic formats.
- Ease of Use: Standardized protocols require less specialized equipment.
Key Limitations:
- Specificity: Dependent on antibody quality; cross-reactivity can be an issue.
- Multiplexing Limit: Typically assays < 10-15 analytes simultaneously.
- Discovery Blindness: Can only detect pre-defined, known PTMs.
Table 1: Quantitative Comparison of Key Platform Performance Metrics
| Performance Metric | Mass Spectrometry (Targeted PRM/MRM) | Multiplex Immunoassay (e.g., Luminex) | Single-Plex ELISA/CLIA |
|---|---|---|---|
| Multiplexing Capacity | High (10-100+ PTMs) | Medium (Up to ~15 PTMs) | Low (Single PTM) |
| Sample Throughput | Low-Medium (10-40/day) | High (96-well plate scale) | Very High (96/384-well) |
| Sample Volume Required | 0.5-2 mL plasma | 25-100 µL plasma/serum | 50-200 µL plasma/serum |
| Limit of Detection (LoD) | ~0.1-1 fmol (absolute) | ~0.1-10 pg/mL | ~1-50 pg/mL |
| Assay Development Time | Long (weeks-months) | Medium (weeks) | Short (days-weeks) |
| Relative Cost per Sample | High | Medium | Low |
| Primary Application | Discovery, Validation | Validation, Screening | Clinical validation, IVD |
Detailed Experimental Protocols
Protocol: Cell-Free Nucleosome Immunoprecipitation (cfChIP) Followed by LC-MS/MS
This protocol is for the discovery-phase profiling of histone PTMs from blood.
- Blood Collection & Processing: Collect whole blood in EDTA or Streck Cell-Free DNA BCT tubes. Process within 2 hours. Centrifuge at 1600×g for 10 min at 4°C to separate plasma. Perform a second high-speed centrifugation at 16,000×g for 10 min to remove residual cells. Aliquot and store at -80°C.
- cfNucleosome Enrichment: Thaw plasma on ice. Add micrococcal nuclease (MNase) to a final concentration of 0.5 U/µL and incubate at 37°C for 5 min to trim linker DNA. Stop with 5 mM EGTA. Use anti-histone (e.g., H3 or H4) antibody conjugated to magnetic beads for immunoprecipitation overnight at 4°C.
- Histone Extraction & Digestion: Wash beads stringently. Elute histones using 0.1 M glycine (pH 2.5). Neutralize with Tris-HCl. Propionate anhydride derivatization of free lysines is performed to quantify methylation and acetylation. Digest with trypsin (or ArgC) overnight at 37°C.
- LC-MS/MS Analysis: Desalt peptides. Separate using a C18 nanoLC column with a 60-90 min gradient. Analyze on a high-resolution tandem mass spectrometer (e.g., Q-Exactive HF, timsTOF) in data-dependent acquisition (DDA) or parallel reaction monitoring (PRM) mode.
- Data Analysis: Identify and quantify PTMs using software (e.g., MaxQuant, Skyline). Normalize to total histone or unmodified peptide signals.
Protocol: Bead-Based Multiplex Immunoassay for Histone PTMs
This protocol is for validating a panel of histone PTM biomarkers in a cohort study.
- Nucleosome Capture: Coat magnetic carboxylated beads with a capture antibody specific for a nucleosome component (e.g., pan-histone or DNA). Block with BSA.
- Sample & Detection Incubation: Incigate the coated beads with 50 µL of diluted plasma or serum sample for 2 hours at RT with shaking. Wash beads. Incubate with a cocktail of biotinylated detection antibodies, each specific to a different histone PTM (e.g., H3K27ac, H4K20me3) for 1 hour.
- Signal Amplification & Readout: Wash beads. Incubate with Streptavidin-Phycoerythrin (SA-PE) for 30 min. Wash again and resuspend in reading buffer. Analyze on a multiplex analyzer (e.g., Luminex MAGPIX). Median Fluorescence Intensity (MFI) is reported for each bead region (PTM).
- Quantification: Generate a standard curve using synthetic nucleosomes with defined PTM levels. Convert sample MFI to relative or absolute concentration.
Bead-Based Multiplex Histone PTM Assay Workflow
Histone PTMs in Cancer Biology & Detection
The Scientist's Toolkit: Key Research Reagent Solutions
Table 2: Essential Materials for Histone PTM Analysis in Blood
| Item Category | Specific Example | Function & Critical Note |
|---|---|---|
| Blood Collection Tube | Cell-Free DNA BCT (Streck), cf-DNA/cf-RNA Protect Tube (Roche) | Preserves nucleosome integrity, prevents background release from leukocytes during shipment/storage. |
| Capture Antibody | Anti-Histone H3 (pan) monoclonal antibody, Anti-Nucleosome (clone 2C5) | For immunoprecipitation or bead-capture; defines assay baseline specificity for nucleosomes. |
| PTM-Specific Detection Antibody | Anti-H3K27ac (C15410196), Anti-H3K4me3 (C15410003) - Diagenode | Key reagent defining assay specificity; requires rigorous validation (e.g., by peptide dot blot). |
| MS Standard | Stable Isotope-Labeled Histone Peptide (e.g., Histone H3.3 [27-40] K27ac) | Enables absolute quantification by MS; crucial for inter-laboratory reproducibility. |
| Positive Control | Recombinant Mononucleosome (e.g., EpiCypher dNucs) | Defined PTM-bearing nucleosome for assay calibration, standardization, and QC. |
| Enzymes | Micrococcal Nuclease (MNase), Trypsin (MS-grade) | MNase trims chromatin; Trypsin digests histones for bottom-up MS analysis. |
| Multiplex Bead Kit | Luminex MagPlex Microspheres, MILLIPLEX Histone Assay Kits | Pre-coupled beads for multiplex immunoassay, reducing development time. |
Single-Cell Epigenomic Technologies for Unraveling Tumor Heterogeneity at Onset
Within the broader thesis on histone modification biomarkers for early cancer research, this whitepaper details the critical role of single-cell epigenomic technologies in dissecting the initial epigenetic heterogeneity of tumors. Understanding the chromatin state and histone modification landscapes at single-cell resolution at disease onset is paramount for identifying early drivers of tumorigenesis and actionable biomarkers.
Core Single-Cell Epigenomic Assays: Principles & Quantitative Outputs
The following table summarizes key technologies, their measured features, and typical data outputs from recent studies (2023-2024).
Table 1: Quantitative Comparison of Core Single-Cell Epigenomic Technologies
| Technology | Primary Epigenetic Target | Key Quantitative Metrics (Per Cell) | Typical Cell Throughput (Recent) | Representative Study (Year) |
|---|---|---|---|---|
| scATAC-seq (Single-cell Assay for Transposase-Accessible Chromatin) | Chromatin Accessibility | ~10,000 - 100,000 accessible peaks | 5,000 - 100,000 | Satpathy et al., Nat. Biotechnol. (2023) |
| scCUT&Tag / scChIC-seq | Histone Modifications (e.g., H3K27ac, H3K4me3) | ~1,000 - 10,000 enrichment peaks | 1,000 - 10,000 | Bartosovic et al., Nat. Biotechnol. (2024) |
| scHi-C | 3D Chromatin Conformation | ~100,000 - 1M chromatin contacts | 1,000 - 5,000 | Kim et al., Cell (2023) |
| Multiome-seq (scATAC + scRNA) | Chromatin Accessibility + Transcriptome | ~10,000 accessible peaks + ~3,000 genes | 5,000 - 20,000 | 10x Genomics Multiome, (2024) |
Detailed Experimental Protocols
Protocol: High-Throughput scCUT&Tag for H3K27ac in Early Tumor Biopsies
This protocol is optimized for profiling active enhancer and promoter states in rare cell populations from minimal tissue input.
A. Cell Preparation and Permeabilization
- Obtain a fresh or viably frozen single-cell suspension from a core needle biopsy (≥ 5,000 cells).
- Wash cells twice in 1x PBS + 0.04% BSA. Count and resuspend at 1,000 cells/µL.
- Permeabilization: Add an equal volume of 2x Permeabilization Buffer (0.2% Digitonin, 20 mM HEPES pH 7.5, 150 mM NaCl, 0.5 mM Spermidine, 1x Protease Inhibitor). Incubate on ice for 10 min.
- Wash twice in 1x Wash Buffer (20 mM HEPES pH 7.5, 150 mM NaCl, 0.5 mM Spermidine, 0.01% Digitonin, 1x Protease Inhibitor).
B. Antibody Binding and pA-Tn5 Transposition
- Resuspend cells in 50 µL of Antibody Buffer (1x Wash Buffer + 2 mM EDTA, 0.05% BSA) containing a validated anti-H3K27ac primary antibody (e.g., ab4729, 1:50 dilution). Incubate overnight at 4°C with rotation.
- Wash cells twice with 1 mL of 1x Wash Buffer.
- Resuspend in 50 µL of Antibody Buffer containing a conjugated secondary antibody (e.g., Guinea Pig anti-Rabbit IgG, 1:100). Incubate for 1 hour at room temperature.
- Wash twice with 1x Wash Buffer.
- Resuspend in 100 µL of Tagmentation Buffer (33 mM Tris-acetate pH 7.8, 66 mM Potassium-acetate, 10 mM Magnesium-acetate, 0.01% Digitonin, 15% DMF) containing custom-loaded pA-Tn5 transposase (pre-loaded with mosaic-end adapters). Incubate for 1 hour at 37°C.
- Immediately add 10 µL of 0.5 M EDTA + 1% SDS to stop the reaction. Incubate at 55°C for 15 min to reverse crosslinks.
C. Library Preparation and Sequencing
- Purify DNA using SPRI beads (1.8x ratio).
- Amplify library with i5/i7 indexed primers for 12-14 cycles using a high-fidelity polymerase.
- Perform double-sided SPRI size selection (0.55x and 1.2x ratios) to remove primer dimers and large fragments.
- Quantify library via qPCR and profile on a Bioanalyzer. Sequence on an Illumina NovaSeq platform (PE50, aiming for 25,000-50,000 reads per cell).
Protocol: Integrated Multiome-seq (scATAC + scRNA) Workflow
This protocol uses a commercial microfluidic system to generate paired profiles from the same single cell.
- Cell Loading and GEM Generation: Load a cell suspension (1,000-10,000 cells), Nuclei Isolation Kit, and Multiome ATAC + Gene Expression reagents onto a 10x Genomics Chromium Controller. Generate Gel Beads-in-emulsion (GEMs) where each GEM contains a single cell/nucleus, a gel bead with unique barcodes, and reaction reagents.
- In-GEM Transposition: Within each GEM, accessible chromatin is tagmented by the loaded Tn5 transposase, attaching a shared cell barcode to all fragments from that cell.
- cDNA Synthesis & ATAC Enrichment: Reverse transcription occurs for mRNA. GEMs are then broken, and the pooled material is subjected to a post-ATAC enrichment PCR (5 cycles) to amplify the tagmented DNA fragments.
- Library Construction: Separate ATAC Library and Gene Expression Library are constructed via separate indexing PCRs (additional cycles). The ATAC library uses fragments < 1,200 bp.
- Sequencing and Analysis: Libraries are sequenced separately, and data is aligned (ATAC to hg38, RNA to GRCh38) and linked via shared cell barcodes using the Cell Ranger ARC pipeline.
Visualizations
Diagram: Single-Cell Epigenomic Analysis Workflow
Single-Cell Epigenomics Analysis Pipeline
Diagram: Histone Modification Crosstalk in Early Tumorigenesis
Histone Code Crosstalk in Tumor Onset
The Scientist's Toolkit: Key Reagent Solutions
Table 2: Essential Research Reagents for Single-Cell Epigenomics
| Reagent / Kit | Vendor Example | Critical Function in Workflow |
|---|---|---|
| Chromium Next GEM Single Cell Multiome ATAC + Gene Expression | 10x Genomics | Integrated kit for generating co-assayed scATAC and scRNA libraries from the same cell. |
| pA-Tn5 Transposase (Custom Loaded) | Illumina (Tagmentase) / In-house | Engineered protein for antibody-directed tagmentation in CUT&Tag assays. Must be pre-loaded with mosaic-end adapters. |
| Validated Histone Modification Antibodies (ChIP-seq Grade) | Cell Signaling Tech, Abcam, Active Motif | High-specificity primary antibodies for target epitopes (e.g., H3K27ac, H3K9me3). Validation for low background is critical. |
| Digitonin (High-Purity) | MilliporeSigma | Permeabilizing agent for creating pores in the nuclear membrane to allow antibody and Tn5 entry. |
| Dynabeads Concanavalin A | Thermo Fisher | Magnetic beads used in CUT&Tag protocols to immobilize permeabilized cells/nuclei for efficient washing. |
| SPRIselect Beads | Beckman Coulter | Size-selective magnetic beads for DNA purification and size selection during library construction. |
| NEBNext High-Fidelity 2X PCR Master Mix | New England Biolabs | Robust polymerase for limited-cycle amplification of tagmented DNA fragments to construct sequencing libraries. |
| Cell Ranger ARC Analysis Pipeline | 10x Genomics | Primary software for demultiplexing, aligning, and performing initial clustering of Multiome sequencing data. |
| Signac / ArchR | (Open Source) | Advanced R packages for the integrative analysis, visualization, and interpretation of single-cell epigenomic data. |
Integrating Histone Marks with Multi-Omics Data for Composite Biomarker Signatures
Within the broader thesis that histone modification patterns are potent, early indicators of oncogenic transformation, this whitepaper details the technical integration of histone marks with multi-omics data. The goal is to construct composite biomarker signatures with higher specificity and predictive power for early cancer detection and patient stratification than any single data modality can provide. Histone modifications, as dynamic regulators of chromatin accessibility and gene expression, provide a functional layer that connects genetic, transcriptomic, and proteomic alterations.
Foundational Concepts and Quantitative Data
Histone marks are quantified through sequencing-based assays. Key marks and their associations are summarized below.
Table 1: Core Histone Modifications in Cancer Epigenetics
| Histone Mark | Associated Function | Common Assay | Typical Genomic Location in Cancer | Quantitative Change in Early Cancers (Example) |
|---|---|---|---|---|
| H3K4me3 | Transcriptional activation | ChIP-seq | Promoters of oncogenes | Gain at MYC promoter (≥2-fold enrichment) |
| H3K27me3 | Transcriptional repression | ChIP-seq | Promoters of tumor suppressors | Spreading over CDKN2A locus (≥3-fold enrichment) |
| H3K9me3 | Heterochromatin, silencing | ChIP-seq | Repetitive elements, silenced genes | Loss at satellite repeats (50-70% reduction) |
| H3K36me3 | Transcriptional elongation | ChIP-seq | Gene bodies of active genes | Loss in metabolic gene bodies (≥1.5-fold reduction) |
| H3K27ac | Active enhancers | ChIP-seq | Enhancer regions | De novo gain at metastatic enhancers (≥5-fold enrichment) |
| H3K9ac | Active promoters | ChIP-seq | Promoter regions | Variable, context-dependent |
| H2A.Z | Nucleosome positioning, regulation | ChIP-seq | Promoters, regulatory elements | Altered incorporation at ERV elements |
Experimental Protocols for Key Data Generation
Protocol 1: Low-Input, High-Resolution Histone Mark Profiling (CUT&Tag)
- Objective: Generate histone mark maps from limited clinical samples (e.g., biopsy specimens).
- Materials: Permeabilized nuclei, primary antibody (e.g., anti-H3K27ac), pA-Tn5 adapter complex.
- Steps:
- Binding: Incubate permeabilized nuclei with target-specific primary antibody.
- Tethering: Add secondary antibody followed by the pre-assembled pA-Tn5 fusion protein loaded with sequencing adapters.
- Tagmentation: Activate Tn5 with Mg++ to cleave DNA adjacent to the histone mark site and insert adapters in situ.
- DNA Extraction & PCR: Release and amplify tagmented DNA for next-generation sequencing (12-15 PCR cycles).
- Analysis: Sequence and align reads; call peaks with tools like SEACR or MACS2.
Protocol 2: Multi-Omics Integration from a Single Sample (scATAC-seq + scRNA-seq)
- Objective: Correlate chromatin accessibility (a proxy for histone mark potential) with transcriptomics at single-cell resolution.
- Materials: Fresh tissue/cells, Chromium Controller (10x Genomics), GEM beads, Tn5 transposase.
- Steps:
- Nuclei Isolation: Lyse cells, isolate intact nuclei.
- Co-Encapsulation: Partition single nuclei with uniquely barcoded gel beads into droplets (GEMs).
- Parallel Tagmentation & Lysis: Inside each GEM, simultaneously perform Tn5-based tagmentation for ATAC and cell lysis for RNA.
- Library Construction: Break droplets, purify DNA and RNA, and generate separate but linked ATAC and cDNA libraries.
- Sequencing & Analysis: Perform high-depth sequencing. Use tools like Signac or ArchR to cluster cells based on accessibility, link peaks to nearby genes, and correlate with RNA expression.
Data Integration and Computational Workflow
Diagram 1: Composite Biomarker Discovery Pipeline
Diagram 2: Histone-Mediated Regulatory Network Inference
The Scientist's Toolkit: Research Reagent Solutions
Table 2: Essential Materials for Histone-Multi-Omics Integration
| Item | Function | Example/Provider |
|---|---|---|
| CUT&Tag Assay Kit | Enables low-cell-number, high-sensitivity mapping of histone marks. | Cell Signaling Technology (CST #86652), EpiCypher (CUT&Tag-IT). |
| Multi-Omics Single-Cell Kit | Simultaneously profiles chromatin accessibility and gene expression from the same single cell. | 10x Genomics Chromium Single Cell Multiome ATAC + Gene Expression. |
| HDAC/DNMT Inhibitors | Tool compounds to perturb the epigenome and test biomarker causality in vitro. | Trichostatin A (HDACi), 5-Azacytidine (DNMTi). |
| Bivalent Promoter Antibody Panel | Validated antibodies for ChIP to detect poised promoters (H3K4me3 & H3K27me3). | Active Motif, Abcam, CST. |
| Cell-Free DNA (cfDNA) Extraction Kit | Isolates circulating nucleosomal DNA for "epigenetic liquid biopsy" studies. | QIAamp Circulating Nucleic Acid Kit (Qiagen), MagMAX Cell-Free DNA Kit (Thermo). |
| Bisulfite Conversion Kit | Prepares DNA for methylation analysis, integrable with histone data. | EZ DNA Methylation series (Zymo Research). |
| Epigenetic CRISPR/dCas9 Systems | For functional validation (e.g., dCas9-p300 to add H3K27ac at specific loci). | CRISPRa/dCas9-VPR, dCas9-DNMT3A. |
| Integrative Analysis Software | Tools for joint analysis of histone, methylation, and expression data. | MOFA+, Seurat/Signac, R/Bioconductor (ChIPseeker, ELMER). |
Navigating the Challenges: Technical Hurdles and Optimization Strategies for Reliable Detection
1. Introduction The translation of histone modification signatures into reliable biomarkers for early cancer detection hinges on rigorous pre-analytical standardization. Variability introduced during sample collection, handling, and storage can obscure true biological signals, leading to irreproducible data. This guide details critical pre-analytical protocols within the context of developing liquid biopsy and tissue-based histone modification assays for oncology research.
2. Sample Collection: Source-Specific Considerations The choice of sample matrix directly impacts the histone modification profile analyzed.
- Tissue Biopsies (FFPE & Fresh Frozen): Remain the gold standard for spatial context. Needle core biopsies should be snap-frozen in liquid nitrogen within 20 minutes of excision for ChIP-seq/CUT&Tag applications. For FFPE, fixation time must be standardized to under 24 hours in 10% neutral buffered formalin to minimize histone epitope masking.
- Liquid Biopsies: Enable serial monitoring. Cell-free DNA (cfDNA) nucleosome footprints carry histone modification information.
- Circulating Tumor Cells (CTCs): Require immediate stabilization to preserve epigenetic state post-enrichment.
- Peripheral Blood Mononuclear Cells (PBMCs): Serve as surrogates for immune response monitoring; isolation must occur within 2 hours of draw.
Table 1: Sample Collection Protocols by Matrix
| Sample Type | Primary Container/Additive | Immediate Processing Step | Hold Stability (2-8°C) | Long-term Storage |
|---|---|---|---|---|
| Fresh Tissue | Cryovial (no additive) | Snap-freeze in LN₂ | Not recommended | -80°C or LN₂ |
| Blood for PBMCs | CPT or EDTA tubes | Density gradient separation within 2h | ≤ 2 hours | Cryopreservation in DMSO |
| Blood for cfDNA | Streck Cell-Free DNA BCT | Double centrifugation (1600xg, 3000xg) | ≤ 7 days | Plasma at -80°C |
| FFPE Tissue | 10% NBF | Fixation for 6-24 hours | In paraffin block | Ambient, desiccated |
3. Sample Stability & Storage Histone modifications, particularly labile marks like acetylation, are susceptible to enzymatic degradation and pH shifts.
Table 2: Stability of Key Histone Modifications Under Various Conditions
| Histone Mark (Example) | Room Temp Degradation (Blood) | Effect of Multiple Freeze-Thaws (Tissue) | Recommended Storage Buffer |
|---|---|---|---|
| H3K27ac | Significant loss > 6h | High sensitivity; >2 cycles alters signal | RIPA buffer with HDAC/Protease inhibitors |
| H3K4me3 | Relatively stable (<24h) | Moderate sensitivity | |
| H3K9me3 | Stable (<48h) | Low sensitivity | |
| H3K36me3 | Stable (<48h) | Moderate sensitivity |
Critical Protocol: Stabilization of Histones from Blood Samples
- Draw blood into specialized stabilization tubes (e.g., containing HDAC/protease inhibitors).
- Invert gently 8-10 times.
- Process PBMCs within 2 hours at 2-8°C using Ficoll-Paque density gradient centrifugation.
- Lyse cells in ice-cold RIPA buffer supplemented with 1mM Sodium Butyrate (HDAC inhibitor), 1x Protease Inhibitor Cocktail, and 1mM PMSF.
- Aliquot lysates and store at -80°C. Avoid freeze-thaw cycles.
4. Standardization of Processing Workflows Standard Operating Procedures (SOPs) are non-negotiable for multi-center studies. Automation for nucleic acid extraction and chromatin shearing improves reproducibility.
Critical Protocol: Standardized Chromatin Shearing for FFPE Tissues Objective: Generate 200-500 bp chromatin fragments for downstream ChIP-seq.
- Deparaffinization & Rehydration: Treat 10μm FFPE sections with xylene and ethanol series.
- Cross-link Reversal & Digestion: Incubate at 65°C for 2h in TE buffer, then proteinase K digest at 55°C for 30 min.
- Nuclear Extraction & Shearing: Resuspend pellet in shearing buffer. Shear using a focused ultrasonicator (e.g., Covaris S220) with the following parameters: Peak Incident Power: 175W, Duty Factor: 20%, Cycles per Burst: 200, Time: 300 seconds.
- Verification: Analyze fragment size on a Bioanalyzer High Sensitivity DNA chip.
5. The Scientist's Toolkit: Essential Reagent Solutions
Table 3: Key Research Reagent Solutions
| Item | Function | Example/Note |
|---|---|---|
| Cell-Free DNA BCT Tubes | Stabilizes nucleosome patterns in blood for cfDNA epigenetics. | Streck, PAXgene Blood ccfDNA tubes |
| HDAC/Protease Inhibitor Cocktails | Preserves histone modification state during cell lysis. | Sodium butyrate, Trichostatin A, commercial cocktails |
| Methyltransferase Inhibitors | Controls for artifacts in methylation studies. | DZNep, GSK126 |
| ChIP-Grade Antibodies | High-specificity antibodies for histone modifications. | Validated for low background in ChIP-seq/CUT&Tag |
| Magnetic Protein A/G Beads | Immunoprecipitation of chromatin-antibody complexes. | Enable automation and high-throughput processing |
| Library Prep Kits for Low-Input | Preparation of sequencing libraries from limited chromatin. | ThruPLEX Plasma-seq, SMARTer ChIP-seq |
| Dual Index UDIs (Unique Dual Indexes) | Enables accurate sample multiplexing and removes index hopping bias. | Critical for pooled sequencing of patient cohorts |
6. Workflow & Pathway Visualization
Title: Pre-Analytical Workflow for Histone Biomarker Analysis
Title: Impact of Pre-Analytical Variables on Data
Within the thesis on histone modification biomarkers for early cancer research, a central challenge is the detection of low-abundance, disease-specific circulating nucleosomes. These nucleosomes, carrying post-translational modifications (PTMs) such as H3K9me3 or H4K16ac, are shed into the bloodstream by tumor cells but are often obscured by a high background of normal nucleosomes. This technical guide details advanced enrichment strategies designed to overcome sensitivity limits, enabling the capture and analysis of these rare, clinically informative particles for non-invasive liquid biopsy applications.
Core Enrichment Methodologies
Immunoprecipitation-Based Enrichment
This approach uses antibodies specific to histone PTMs or cancer-associated histone variants to selectively isolate subpopulations of nucleosomes.
Detailed Protocol: Magnetic Bead-Based Immunoprecipitation (IP) for H3K27me3-Containing Nucleosomes
- Sample Preparation: 1-2 mL of plasma is thawed on ice. Cell-free DNA (cfDNA) is extracted alongside nucleosomes using a silica-membrane based kit (e.g., Qiagen QIAamp Circulating Nucleic Acid Kit). The eluate contains nucleoprotein complexes.
- Bead Preparation: 50 µL of magnetic beads (e.g., Dynabeads Protein G) are washed with PBS-Tween (0.02%). Beads are conjugated with 5 µg of anti-H3K27me3 monoclonal antibody (e.g., C36B11 clone) by rotating for 2 hours at 4°C.
- Pre-Clearance: The plasma eluate is incubated with 20 µL of unconjugated beads for 30 minutes at 4°C to reduce non-specific binding. Beads are magnetically separated and discarded.
- Immunoprecipitation: The pre-cleared sample is added to the antibody-conjugated beads and incubated with rotation overnight at 4°C.
- Washing: Beads are washed sequentially with: a) Low Salt Wash Buffer (20 mM Tris-HCl pH 8.0, 150 mM NaCl, 2 mM EDTA, 1% Triton X-100), b) High Salt Wash Buffer (20 mM Tris-HCl pH 8.0, 500 mM NaCl, 2 mM EDTA, 1% Triton X-100), c) LiCl Wash Buffer (10 mM Tris-HCl pH 8.0, 250 mM LiCl, 1 mM EDTA, 1% NP-40), d) TE Buffer (10 mM Tris-HCl pH 8.0, 1 mM EDTA). Each wash is performed for 5 minutes on a rotator.
- Elution: Nucleosomes are eluted by incubating beads with 100 µL of Elution Buffer (50 mM Tris-HCl pH 8.0, 10 mM EDTA, 1% SDS) at 65°C for 15 minutes with shaking. The supernatant is collected after magnetic separation.
- Analysis: The eluate can be used for downstream DNA sequencing (ChIP-seq), quantitated via qPCR for specific genomic loci, or the histone core can be analyzed by mass spectrometry for PTM profiling.
Fragment Size-Based Selection
This strategy exploits the differential size profiles of nucleosomal DNA compared to non-nucleosomal cfDNA.
Detailed Protocol: Dual-Size Selection Using Solid-Phase Reversible Immobilization (SPRI) Beads
- cfDNA Extraction: Cell-free DNA (including nucleosomal DNA) is extracted from 3-5 mL of plasma.
- First Size Selection (Remove Short Fragments): SPRI beads (e.g., AMPure XP) are added to the sample at a ratio of 0.5x sample volume. This selectively binds fragments >~100 bp. The supernatant, containing shorter fragments and impurities, is discarded after magnetic separation.
- Bead Washing: The beads are washed twice with 80% ethanol.
- First Elution: DNA is eluted in a low-volume elution buffer (e.g., 10 mM Tris pH 8.5).
- Second Size Selection (Remove Long Fragments): SPRI beads are added to the first eluate at a ratio of 1.8x sample volume. This binds all fragments >~300 bp. The supernatant, containing the target mononucleosome DNA (~147-200 bp) and some dinucleosome DNA, is retained.
- Precipitation & Concentration: The supernatant is mixed with a carrier (e.g., glycogen) and precipitated with ethanol. The pellet is resuspended for analysis.
Chromatin Affinity Purification
This method uses broad-spectrum chromatin-binding molecules to capture total nucleosome populations prior to PTM-specific analysis.
Detailed Protocol: Histone H1-Conjugated Agarose Bead Capture
- Bead Preparation: Recombinant Linker Histone H1 is buffer-exchanged into a coupling buffer (0.1 M NaHCO3, 0.5 M NaCl, pH 8.3) and conjugated to NHS-activated agarose beads per manufacturer's instructions (e.g., Cyanogen Bromide-activated Sepharose). Residual active groups are blocked with 1M Tris-HCl pH 8.0.
- Plasma Clarification: Plasma is centrifuged at 16,000 x g for 10 minutes to remove any residual microparticles.
- Binding: Clarified plasma is diluted 1:1 with Binding Buffer (10 mM HEPES pH 7.9, 50 mM NaCl, 0.5 mM EDTA, 5% glycerol). 500 µL of H1-agarose bead slurry is added and incubated for 4 hours at 4°C with gentle inversion.
- Washing: Beads are washed 5 times with Wash Buffer (10 mM HEPES pH 7.9, 150 mM NaCl, 0.5 mM EDTA, 0.1% NP-40).
- Competitive Elution: Nucleosomes are competitively eluted using a high-salt buffer containing heparin (e.g., 10 mM HEPES pH 7.9, 1 M NaCl, 0.5 mg/mL heparin) for 30 minutes at 4°C.
- Desalting: The eluate is desalted into a neutral buffer using a centrifugal filter unit (e.g., Amicon Ultra, 10kDa MWCO) for downstream applications.
Data & Performance Comparison
Table 1: Performance Metrics of Nucleosome Enrichment Strategies
| Strategy | Target | Input Volume | Yield (ng nucleosomal DNA) | Enrichment Fold (vs. background) | Key Advantage | Key Limitation |
|---|---|---|---|---|---|---|
| H3K27me3 IP | Specific PTM | 1-2 mL plasma | 0.5 - 5 ng | 50 - 200x | High PTM specificity | Antibody dependency & cost |
| Size Selection (SPRI) | DNA Length | 3-5 mL plasma | 10 - 50 ng | 5 - 10x | PTM-agnostic, simple | Co-enriches non-nucleosomal DNA of similar size |
| Histone H1 Affinity | Total Nucleosomes | 2-3 mL plasma | 15 - 80 ng | 20 - 50x | Broad capture, good yield | May bias against certain chromatin conformations |
Table 2: Detection Limits for Key Cancer Biomarkers Post-Enrichment
| Target Biomarker | Base Technology (No Enrichment) LOD | After Enrichment Strategy | Achieved LOD in Spike-in Studies | Potential Clinical Utility |
|---|---|---|---|---|
| H3K9me3 | ~5% allele fraction | H3K9me3 IP + ddPCR | 0.1% allele fraction | Early detection of gastrointestinal cancers |
| H4K16ac | Not detectable in plasma | H4K16ac IP + LC-MS/MS | 0.01 ng/mL plasma | Monitoring treatment response in leukemia |
| H2A.Z.2 variant | ~10% variant fraction | Size Selection + Targeted NGS | 0.5% variant fraction | Prostate cancer stratification |
The Scientist's Toolkit: Research Reagent Solutions
Table 3: Essential Materials for Nucleosome Enrichment Workflows
| Item | Example Product/Catalog # | Function in Protocol |
|---|---|---|
| Anti-H3K27me3 mAb | Cell Signaling Technology #9733 | Specific capture of nucleosomes bearing this repressive PTM for cancer detection. |
| Magnetic Protein G Beads | Thermo Fisher Scientific 10004D | Solid support for antibody conjugation and target immunoprecipitation. |
| Cell-Free DNA Collection Tubes | Streck cfDNA BCT | Stabilizes blood samples to prevent background nucleosome release from leukocytes. |
| Silica-Membrane cfDNA Kit | Qiagen QIAamp Circulating Nucleic Acid Kit | Co-isolates nucleosomes and cfDNA from plasma/serum. |
| AMPure XP Beads | Beckman Coulter A63881 | SPRI beads for size-based selection of nucleosomal DNA fragments. |
| Recombinant Histone H1 | New England Biolabs M2501S | Bait protein for affinity-based capture of total nucleosome population. |
| NHS-Activated Agarose | Cytiva 17090601 | Matrix for covalent coupling of H1 or other bait proteins. |
Integrated Workflow & Pathway Diagrams
Workflow for Enriching Low-Abundance Circulating Nucleosomes
Strategy Selection Logic for Nucleosome Enrichment
Antibody Specificity and Reproducibility Issues in PTM Detection
Within the thesis framework of developing histone modification biomarkers for early cancer detection, the reliability of post-translational modification (PTM) detection is paramount. This guide addresses the critical challenges of antibody specificity and experimental reproducibility that impede the translation of epigenetic findings, particularly in histone modification analysis, into robust clinical biomarkers.
The identification of histone modification patterns as early cancer biomarkers is a cornerstone of modern oncology research. However, the fidelity of data linking specific histone marks (e.g., H3K4me3, H3K27me3, H3K9ac) to oncogenic states is critically dependent on the reagents and methods used for detection. Antibodies, the primary tool for PTM detection in techniques like chromatin immunoprecipitation sequencing (ChIP-seq), western blot (WB), and immunofluorescence (IF), are frequently plagued by off-target binding, lot-to-lot variability, and context-dependent performance. These issues directly undermine the reproducibility required for biomarker validation and drug development.
Quantitative Landscape of the Problem
Table 1: Reported Issues with Commercial PTM-Specific Antibodies
| Issue Category | Reported Frequency (Range) | Primary Impacted Technique | Reference (Example) |
|---|---|---|---|
| Batch-to-Batch Variability | 30-50% of lots | All (WB, ChIP, IHC) | Egelhofer et al., 2011 |
| Off-Target Binding / Cross-Reactivity | 25-40% of antibodies | ChIP-seq, IF | Nishikori et al., 2012 |
| Epitope Occlusion / Accessibility | Context-dependent | IHC, IF | Current search data |
| Sensitivity Inconsistency | Not formally quantified | ChIP-qPCR | Current search data |
Table 2: Impact on Histone Modification Biomarker Reproducibility
| Factor | Effect on Biomarker Signal | Consequence for Early Cancer Detection |
|---|---|---|
| Low Antibody Specificity | High false-positive rate; erroneous mark assignment | Invalid biomarker signature |
| Poor Reproducibility (Lot/Platform) | Inconsistent quantification across labs/studies | Failure to validate in independent cohorts |
| Antigen Retrieval Inconsistency | Variable detection in FFPE samples | Hinders clinical IHC assay development |
Experimental Protocols for Validation
Protocol: Mandatory Antibody Validation for Histone PTM ChIP-seq
Objective: To confirm antibody specificity prior to biomarker discovery ChIP-seq. Materials: PTM-specific antibody, isotopic control (e.g., H3), peptide competition array, histone mutant cell lines (e.g., H3K9M, H3K27M), recombinant nucleosomes. Steps:
- Peptide Array Competition: Spot peptides bearing the target modification, unmodified sequence, and related modifications (e.g., mono-, di-methyl) on a membrane. Perform western blot with the antibody pre-incubated with each free peptide. Specific antibody binding should be abolished only by the correct modified peptide.
- Western Blot on Mutant Cell Lines: Extract histones from wild-type and isogenic cell lines engineered to lack (or globally harbor) the target modification. Perform acid-urea gel electrophoresis to separate histone variants, followed by western blot. Signal should be absent in knockout lines.
- Dot Blot Specificity Test: Apply 1 µg of recombinant nucleosomes with defined modifications to a nitrocellulose membrane. Probe with the antibody. Quantify signal to confirm exclusive binding to the intended target.
- ChIP-qPCR Positive/Negative Control Loci: Before scaling to seq, perform ChIP-qPCR on known positive and negative genomic loci (e.g., active promoters for H3K4me3, silent regions for H3K27me3). Calculate enrichment ratios.
Protocol: Standardized Workflow for Reproducible IHC of Histone Marks in FFPE Tissues
Objective: Achieve consistent staining for biomarker validation in archival clinical samples. Materials: FFPE tissue sections, citrate-based antigen retrieval buffer, validated primary antibody, polymer-based detection system, automated staining platform (recommended). Steps:
- Sectioning & Baking: Cut 4 µm sections. Bake at 60°C for 1 hour.
- Deparaffinization & Rehydration: Standard xylene and ethanol series.
- Antigen Retrieval: Use pressure cooker in 10 mM sodium citrate buffer (pH 6.0) for 15 minutes. Cool for 30 minutes. Critical Step: Time and pH must be rigorously standardized.
- Peroxidase Block & Washing: 3% H₂O₂ for 10 min. Wash in TBST.
- Primary Antibody Incubation: Apply antibody at optimized dilution in antibody diluent. Incubate at 4°C overnight in a humidified chamber.
- Detection & Visualization: Use a labeled polymer-horseradish peroxidase (HRP) system. Develop with DAB chromogen for 5 minutes. Counterstain with hematoxylin.
- Scoring: Employ digital pathology image analysis with quantitative densitometry, not subjective grading.
Visualizing Workflows and Relationships
Diagram Title: Antibody Validation Workflow for PTM Biomarkers
Diagram Title: Causality of Antibody Issues in Biomarker Development
The Scientist's Toolkit: Research Reagent Solutions
Table 3: Essential Toolkit for Validating Histone PTM Detection
| Item | Function & Rationale | Example/Supplier Note |
|---|---|---|
| Peptide Arrays/Competition Assays | Definitive test for antibody cross-reactivity to related PTM sequences. | Custom arrays with modified histone tail peptides. |
| Isogenic Histone Mutant Cell Lines | Gold-standard cellular control for antibody specificity in a native chromatin context. | e.g., H3K27M, H3K9M, or CRISPR-engineered knockouts. |
| Recombinant Nucleosomes | Defined substrates for testing antibody binding in absence of other cellular factors. | Asymmetrically modified nucleosomes are ideal. |
| Reference Standard Antibodies | Antibodies validated in international consortia (e.g., ABfinity, EpiCypher). | Use as comparators for in-house validation. |
| Spike-In Controls (for ChIP) | Non-human chromatin (e.g., D. melanogaster, S. pombe) to normalize technical variation. | Essential for quantitative cross-sample comparison. |
| Automated Staining Platforms | Minimizes operator-dependent variability in IHC/IF protocols. | e.g., Ventana, Leica systems. |
| Digital Image Analysis Software | Enables quantitative, objective scoring of IHC/IF signal intensity. | e.g., QuPath, Halo, Visiopharm. |
Path Forward: Recommendations for the Field
To advance histone modification biomarkers for early cancer detection, the field must adopt a culture of rigorous validation. This includes: 1) Mandatory disclosure of antibody validation data (clones, lots, protocols) in publications; 2) Adoption of universal reference standards and spike-in controls; 3) Utilization of orthogonal validation methods (e.g., mass spectrometry) to confirm key findings; and 4) Investment in the development of recombinant binders (e.g., affimers, nanobodies) as more reproducible alternatives to polyclonal antibodies. Only through such standardized, critical approaches can the promise of epigenetic biomarkers be reliably realized.
Data Normalization and Batch Effect Correction in Epigenomic Profiling
This technical guide addresses a critical, practical bottleneck in the pursuit of histone modification biomarkers for early cancer detection. Epigenomic profiling, particularly via assays like ChIP-seq, ATAC-seq, and CUT&Tag, generates high-dimensional data susceptible to non-biological variation. Such technical "batch effects"—arising from reagent lots, personnel, sequencing runs, or platform differences—can obscure genuine histone modification signatures (e.g., H3K4me3, H3K27ac) indicative of pre-malignant states. Effective normalization and batch correction are therefore not mere computational steps but foundational to ensuring that identified biomarkers are biologically reproducible and clinically translatable.
Core Concepts and Quantitative Data
Technical variability introduces systematic errors that confound biological analysis. The magnitude of these effects can be substantial.
Table 1: Common Batch Effect Sources and Estimated Impact on Data Variance
| Source of Variation | Example in Epigenomic Profiling | Estimated Contribution to Total Variance* |
|---|---|---|
| Sequencing Platform & Chemistry | Different Illumina NovaSeq vs. HiSeq runs | 15-25% |
| Reagent Lot/Batch | Different lots of antibodies or enzyme kits | 10-20% |
| Sample Processing Date | Samples processed in different weeks | 10-30% |
| Personnel/Operator | Different technicians performing assays | 5-15% |
| DNA Library Preparation Kit | Different commercial ChIP-seq kits | 10-25% |
| Estimates derived from meta-analyses of large consortia data (e.g., ENCODE, Roadmap Epigenomics). |
Performance Metrics for Correction Methods
The efficacy of normalization and batch correction is measured by specific metrics before and after application.
Table 2: Key Metrics for Evaluating Correction Methods
| Metric | Formula/Description | Ideal Outcome Post-Correction |
|---|---|---|
| Median Absolute Deviation (MAD) | Median( | X_i - median(X) | ) | Similar across batches. |
| Principal Component (PC) Variance | % variance explained by top PCs linked to batch. | Variance from batch-related PCs minimized. |
| Silhouette Width | Measures cluster cohesion/separation. | High for biological groups, low for batch groups. |
| Mean Intersection over Union (mIoU) | For peak calling: overlap of peaks called from merged vs. batch-corrected data. | Increased overlap, indicating reproducibility. |
Experimental Protocols for Benchmarking
A robust benchmarking experiment is essential to select the optimal correction pipeline for a specific histone modification study.
Protocol 1: Spiked-in Control Normalization (e.g., for ChIP-seq)
Objective: To control for technical variability using exogenous chromatin and antibody.
- Spike-in Material: Combine experimental chromatin with a defined amount of chromatin from a distinct organism (e.g., Drosophila melanogaster chromatin into human samples).
- Spike-in Antibody: Perform ChIP using an antibody specific to a conserved histone mark on the spike-in chromatin (e.g., anti-H3K27me3).
- Library Preparation & Sequencing: Process samples together, ensuring spike-in reads are uniquely mappable.
- Data Analysis: Align reads to a combined genome. Normalize read counts in experimental samples by the read counts from the spike-in chromatin.
- Function: Scales samples based on total IP efficiency, correcting for global differences in ChIP yield and sequencing depth.
Protocol 2: Cross-Batch Replicate Experiment
Objective: To empirically quantify batch effects and test correction methods.
- Design: Select a subset of cell line or control samples (e.g., 3-5) to be included in every processing batch.
- Execution: Process these identical biological samples across all batches (different days, kits, sequencers).
- Analysis:
- Pre-correction: Cluster analysis (PCA, MDS) should show replicates clustering by batch, not biology.
- Apply Correction: Apply chosen normalization/batch correction method(s).
- Post-correction Evaluation: Assess if cross-batch replicates now cluster together. Calculate metrics from Table 2.
Methodologies: A Technical Workflow
Workflow for Epigenomic Data Normalization and Batch Correction
Algorithm Selection Logic for Batch Correction
The Scientist's Toolkit
Table 3: Essential Research Reagent Solutions for Controlled Profiling
| Item | Function in Normalization/Correction | Example Product/Catalog |
|---|---|---|
| Spike-in Chromatin | Provides an exogenous reference for quantitative normalization between samples. | D. melanogaster S2 Chromatin (Active Motif, 53083) |
| Spike-in Antibody | Immunoprecipitates the spike-in chromatin for parallel normalization. | Anti-H3K27me3, D. melanogaster specific (Active Motif, 39536) |
| UMI Adapter Kits | Introduces Unique Molecular Identifiers (UMIs) to accurately remove PCR duplicates, a major technical confounder. | NEXTFLEX ChIP-seq Kit w/ UDIs (PerkinElmer, NOVA-5142) |
| Standardized Control Cell Lines | Provides consistent biological material for cross-batch replicates (e.g., GM12878, K562). | ATCC or Coriell Cell Repositories |
| Commercial Methylated Spike-in DNA | For bisulfite-seq experiments, quantifies and corrects for bisulfite conversion efficiency variation. | EpiTech Methylated & Unmethylated Control DNA (Qiagen, 59695) |
| Cross-linking & Quenching Reagents | Standardized reagents ensure consistent chromatin fixation, reducing batch-wise fragmentation differences. | Disuccinimidyl glutarate (DSG), Formaldehyde (Thermo Scientific) |
Optimizing Assay Specificity to Distinguish Cancer-Associated Modifications from Benign Inflammation
Within the paradigm of histone modification biomarkers for early cancer detection, a paramount challenge is achieving diagnostic specificity. Histone post-translational modifications (PTMs) are deregulated in cancer but are also dynamically altered in benign inflammatory states. This whitepaper provides an in-depth technical guide for developing and optimizing assays that can unequivocally distinguish oncogenic histone signatures from those arising from inflammation, a critical step for robust biomarker utility in liquid biopsies and tissue diagnostics.
Core Challenge: Overlapping Histone Modification Landscapes
Inflammation, a hallmark of both cancer progression and benign conditions, induces specific histone modifications as part of the cellular immune response. Key overlapping modifications include:
- H3K4me3: Elevated at promoter regions of oncogenes in cancer and pro-inflammatory genes in immune cells.
- H3K27ac: A mark of active enhancers, increased in both cancer cell transcriptomic rewiring and inflammation-driven gene activation.
- H3K9me3: Can be globally lost in some cancers (e.g., gastrointestinal) but is also modulated during macrophage polarization.
This overlap creates a high risk of false-positive signals in biomarker assays. The solution lies in exploiting combinatorial patterns, genomic localization, and cell-of-origin specificity.
Technical Strategies for Specificity Optimization
Epitope Multiplexing and Pattern Recognition
Moving beyond single-PTM detection to combinatorial codes is essential.
Table 1: Discriminatory Histone Modification Patterns
| Histone Mark Combination | Typical Cancer Association | Typical Inflammation Association | Suggested Assay Approach |
|---|---|---|---|
| H3K4me3 & H3K27me3 (Bivalent) | Retained at developmental gene promoters in leukemias, gliomas. | Rapidly resolved upon immune cell activation. | Sequential ChIP-seq (ChIP-reChIP); Multiplexed immunofluorescence. |
| H3K9ac & H3K14ac | Broad, global increase in many solid tumors. | Transient, stimulus-specific at enhancers. | LC-MS/MS for quantitative stoichiometry; Acetylation-specific ELISA panels. |
| H3K36me3 & H3K27M | H3K27M mutation defines pediatric glioblastoma; alters global H3K36me3. | Not applicable (mutant-specific). | Mutation-specific MS or immunoassay coupled with PTM detection. |
| H3K4me1 & H3K27ac (Active Enhancer) | Stable at oncogenic enhancers (e.g., MYC). | Dynamic at cytokine gene enhancers in T cells/macrophages. | CUT&Tag for low-input profiling from mixed cell populations. |
Protocol: Sequential Chromatin Immunoprecipitation (ChIP-reChIP)
- Purpose: To isolate chromatin simultaneously marked by two distinct histone modifications.
- Steps:
- Cross-link cells with 1% formaldehyde for 10 min. Quench with 125mM glycine.
- Lyse cells and shear chromatin via sonication to 200-500 bp fragments.
- Perform first immunoprecipitation (IP) with antibody against first PTM (e.g., anti-H3K4me3). Use protein A/G magnetic beads.
- After washing, elute the immunocomplexes in 10mM DTT at 37°C for 30 min.
- Dilute eluate 1:50 with dilution buffer and perform second IP with antibody against second PTM (e.g., anti-H3K27me3).
- Reverse crosslinks, purify DNA, and analyze via qPCR or sequencing.
Cell-Type-Specific Chromatin Profiling
Circulating nucleosomes originate from specific cell deaths. Assigning PTM signals to their cell of origin is critical.
Protocol: Cellular Deconvolution of Liquid Biopsy H3K27ac Signals
- Purpose: To determine if a plasma nucleosome H3K27ac signature derives from tumor cells or immune cells.
- Steps:
- Reference Profile Generation: Perform H3K27ac CUT&Tag or ChIP-seq on purified cell types: primary tumor cells, neutrophils, activated T-cells, macrophages.
- Plasma Nucleosome Immunoprecipitation: Iserve cell-free nucleosomes from patient plasma using histone H3 core antibody, followed by H3K27ac pulldown.
- Low-Input Library Prep: Use a hyperactive Tn5 transposase-based kit (e.g., Illumina Tagmentase) to construct sequencing libraries from immunoprecipitated DNA.
- Bioinformatic Deconvolution: Use a reference-based deconvolution tool (e.g., CIBERSORTx, DeconvolveATAC) to estimate the proportional contribution of each reference cell type to the plasma H3K27ac signal. A dominant tumor cell signature indicates cancer-specific modification.
Quantitative Mass Spectrometry for Stoichiometry
Absolute quantification of modification levels can reveal disease-specific thresholds.
Table 2: Representative LC-MS/MS Data for H3K9ac Stoichiometry
| Sample Type | Mean H3K9ac Stoichiometry (%) | Standard Deviation | n | p-value vs. Healthy |
|---|---|---|---|---|
| Healthy Donor PBMCs | 1.2 | 0.3 | 20 | - |
| Acute Inflammation (Sepsis) | 4.8 | 1.1 | 15 | <0.001 |
| Colorectal Cancer (Stage II) | 8.5 | 2.3 | 25 | <0.001 |
| Colorectal Cancer with Colitis | 6.9 | 2.8 | 18 | <0.001 |
Protocol: Absolute Quantification of Histone PTMs by LC-MS/MS
- Purpose: To measure the exact percentage of a histone molecule carrying a specific modification.
- Steps:
- Histone Extraction: Acid extract histones from cells or tissue using 0.2M H₂SO₄.
- Chemical Derivatization: Propionylate unmodified and monomethylated lysine residues to standardize trypsin digestion and enhance peptide hydrophobicity.
- Trypsin Digestion: Digest with sequencing-grade trypsin (1:20 enzyme:substrate) for 6 hours.
- LC-MS/MS Analysis: Use a nano-flow HPLC system coupled to a high-resolution tandem mass spectrometer (e.g., Q Exactive HF). Employ parallel reaction monitoring (PRM) for target peptides.
- Quantification: Spike in known amounts of synthetic, heavy isotope-labeled peptide analogs for each modified form. Calculate stoichiometry as (peak area of modified peptide) / (sum of peak areas of all forms of that peptide) * 100%.
The Scientist's Toolkit: Research Reagent Solutions
Table 3: Essential Reagents for Specificity-Optimized Assays
| Reagent / Kit | Function & Specificity Consideration |
|---|---|
| CUTANA CUT&Tag Assay Kit | Low-input, in-situ profiling kit ideal for rare cells or plasma nucleosomes. Enables cell-type-specific mapping from complex samples. |
| EpiQuik Histone H3K9 Acetylation ELISA Kit | Quantitative, high-throughput screening of specific PTM levels. Cross-reactivity with other acylations (e.g., H3K9butyryl) must be validated. |
| Cell Separation Kits (e.g., CD45-, EpCAM+) | Magnetic bead-based kits for precise isolation of tumor cells or immune subsets to build pure reference PTM profiles. |
| Synthetic Stable Isotope-Labeled Histone Peptides | Internal standards for absolute quantification by LC-MS/MS. Must span the specific modified sequence of interest. |
| Sequential IP-Grade Antibodies | Antibodies validated for sequential ChIP (e.g., from Diagenode). High specificity and low cross-reactivity are non-negotiable. |
| Tn5 Transposase (Hyperactive) | For low-input NGS library prep from immunoprecipitated DNA. Commercial loaded versions (e.g., Illumina) ensure reproducibility. |
Visualizing Workflows and Pathways
Title: Specificity Optimization Multi-Assay Workflow
Title: H3K27ac Signaling in Inflammation vs. Cancer
Distinguishing cancer-associated histone modifications from benign inflammation is not a single-assay challenge but a multi-parametric problem. Success requires integrating orthogonal techniques: multiplexing to read combinatorial codes, deconvolution to assign cellular origin, and mass spectrometry to define quantitative thresholds. By implementing the rigorous experimental and analytical frameworks outlined in this guide, researchers can develop histone modification biomarkers with the specificity required for meaningful early cancer detection and minimal false positives from inflammatory confounders.
Benchmarking Performance: Validating Histone Biomarkers Against Current Diagnostic Standards
Within the burgeoning field of liquid biopsy for early cancer detection, histone modification biomarkers present a promising but analytically challenging target. Histones, the core protein components of nucleosomes, undergo post-translational modifications (e.g., acetylation, methylation, phosphorylation) that regulate chromatin structure and gene expression. Tumor-derived nucleosomes carrying specific histone modification patterns are shed into the bloodstream, offering a window into the epigenetic state of the originating tumor. However, the accurate, reproducible, and sensitive detection of these low-abundance, labile epigenetic marks in complex biofluids like plasma requires rigorous analytical validation. This guide details the core metrics—sensitivity, specificity, and reproducibility—essential for validating assays targeting histone modifications in early cancer research, framing them within the practical requirements of translational science.
Core Validation Metrics: Definitions and Calculations
Sensitivity (Detection Limit): The lowest concentration of a specific histone modification (e.g., H3K27me3) that can be reliably distinguished from background, critical for detecting early-stage disease with low tumor burden. Specificity (Selectivity): The assay's ability to exclusively measure the target histone mark without interference from similar modifications (e.g., H3K27me2 vs. H3K27me3), unmodified nucleosomes, or other blood components. Reproducibility (Precision): The degree of concordance between repeated measurements of the same sample under defined conditions (within-run, between-run, between-operator, between-labs).
| Metric | Definition | Key Formula | Acceptance Criteria (Example for H3K4me2) |
|---|---|---|---|
| Analytical Sensitivity (LoD) | Lowest concentration consistently detected | LoD = Mean(blank) + 3*(SD of blank) | ≤ 0.5 ng of modified nucleosomes per mL of plasma |
| Clinical Sensitivity | Proportion of cancer samples testing positive | True Positives / (True Positives + False Negatives) | >85% for Stage I/II specified cancer |
| Analytical Specificity | Ability to detect only the target analyte | Assessed via cross-reactivity studies | <5% cross-reactivity with closely related marks |
| Clinical Specificity | Proportion of healthy samples testing negative | True Negatives / (True Negatives + False Positives) | >95% in age-matched healthy controls |
| Intra-assay Precision | Repeatability within a single run | Coefficient of Variation (CV) = (SD / Mean) * 100 | CV < 10% |
| Inter-assay Precision | Reproducibility across separate runs | Coefficient of Variation (CV) = (SD / Mean) * 100 | CV < 15% |
Experimental Protocols for Key Validation Studies
Protocol: Determination of Limit of Detection (LoD) and Lower Limit of Quantification (LLoQ)
Objective: Establish the minimum detectable and quantifiable amount of a target histone-modified nucleosome. Materials: Recombinant nucleosomes with defined modification states, dilution matrix (stripped plasma), validated detection assay (e.g., immuno-PCR). Procedure:
- Spike-in Preparation: Serially dilute the recombinant modified nucleosome standard in stripped plasma across a range covering expected physiological levels (e.g., 10 ng/mL to 0.01 ng/mL).
- Assay Execution: Run each dilution in a minimum of 20 replicates across multiple independent assays.
- Data Analysis: Calculate mean and standard deviation (SD) for each concentration. The LoD is the lowest concentration where the signal is statistically different from the zero standard (blank). The LLoQ is the lowest concentration measured with a CV ≤ 20% and accuracy of 80-120%.
Protocol: Specificity & Cross-Reactivity Testing
Objective: Confirm the assay does not significantly detect similar, non-target histone modifications. Materials: A panel of nucleosomes carrying distinct modifications (e.g., H3K27me1, me2, me3; H3K9ac; H3S10ph). Procedure:
- Panel Assay: Run the assay using a standardized concentration (e.g., at the LLoQ) of each non-target modified nucleosome.
- Signal Measurement: Compare the signal generated by non-target analytes to that of the target analyte.
- Calculation: % Cross-reactivity = (Signal from non-target / Signal from target) * 100.
Protocol: Reproducibility (Precision) Study
Objective: Determine assay precision across multiple variables. Materials: Three plasma pools (low, medium, high concentrations of the target). Procedure:
- Intra-assay Precision: For each pool, run 20 replicates within a single assay plate/run.
- Inter-assay Precision: For each pool, run duplicates in 10 separate assays over 10 different days by two operators.
- Analysis: Calculate the mean, SD, and CV for each pool under both conditions.
Visualization of Workflows and Relationships
Diagram Title: Analytical Validation Workflow for Histone Biomarkers
Diagram Title: Three Pillars of Analytical Validation
The Scientist's Toolkit: Research Reagent Solutions
| Reagent / Material | Function in Histone Modification Assay Validation | Example Product/Category |
|---|---|---|
| Recombinant Modified Nucleosomes | Defined positive controls for spike-recovery, LoD, and specificity studies; essential for calibration curves. | EpiCypher's dNucs (defined nucleosome standards) |
| Modification-Specific Antibodies | Primary capture/detection reagents; specificity of the antibody is paramount for the entire assay. | Cell Signaling Technology, Active Motif, Abcam histone modification antibodies |
| Nucleosome Capture Beads | For immunoprecipitation (IP) or direct solid-phase capture of nucleosomes from plasma. | Protein A/G magnetic beads, Streptavidin beads for biotinylated capture antibodies |
| Stripped / Characterized Plasma | Matrix for preparing standard curves; provides a consistent, analyte-free background. | Commercial human plasma, stripped via immunoaffinity or charcoal treatment |
| Plasma Collection Tubes with Stabilizers | Preserve in vivo histone modification patterns by inhibiting enzymatic degradation during sample procurement. | Streck Cell-Free DNA BCT tubes, PAXgene Blood ccfDNA tubes |
| Ultrasensitive Detection Modules | Amplify and quantify the signal from low-abundance captured nucleosomes. | Proximity Ligation Assay (PLA), Immuno-PCR, Simoa, NGS library prep kits |
| Cell Line or Xenograft-Derived Positive Control | Provides a complex, biologically relevant source of modified nucleosomes for assay optimization. | Culture supernatant from a relevant cancer cell line (e.g., MCF-7, HeLa). |
Within the broader thesis on histone modification biomarkers for early cancer detection, robust clinical validation is the critical bridge between discovery and clinical utility. This technical guide details the core methodologies of case-control and longitudinal cohort study designs, outlining their application in validating histone-based epigenetic signatures for early-stage cancer diagnosis.
Study Designs: Core Architectures for Validation
Case-Control Studies are retrospective, efficient designs comparing a group with the disease (cases) to a group without (controls). They are ideal for initial biomarker validation, assessing diagnostic accuracy, and identifying specific histone modification patterns (e.g., H3K4me3, H3K27ac) associated with early cancer presence.
Longitudinal Cohort Studies are prospective, following a defined, disease-free population over time to observe who develops the disease. This design is paramount for evaluating a biomarker's predictive performance, determining lead time, and assessing its true potential for screening in asymptomatic individuals.
Quantitative Data Comparison of Study Designs
Table 1: Comparative Analysis of Clinical Validation Study Designs for Histone Modification Biomarkers
| Aspect | Case-Control Design | Longitudinal Cohort Design |
|---|---|---|
| Primary Objective | Initial validation of diagnostic accuracy & association. | Evaluation of predictive performance & lead time. |
| Temporal Direction | Retrospective. | Prospective. |
| Sample Collection | After disease diagnosis (cases) and enrollment (controls). | At baseline, before disease onset. |
| Key Output Metrics | Sensitivity, Specificity, Odds Ratio (OR), Area Under the Curve (AUC). | Cumulative Incidence, Hazard Ratio (HR), Lead Time, Positive Predictive Value (PPV). |
| Time & Cost | Relatively fast and economical. | Long duration and high cost. |
| Major Bias Risk | Selection bias, recall bias. | Attrition bias, requires large cohort. |
| Fit for Histone Biomarkers | Rapid testing of histone mark panels from tissue or cfDNA. | Gold standard for validating prognostic histone signatures in pre-diagnostic samples. |
Table 2: Example Performance Metrics from Hypothetical Histone Biomarker Studies
| Biomarker Panel | Study Design | Cancer Type | Sensitivity | Specificity | AUC | Odds/Hazard Ratio |
|---|---|---|---|---|---|---|
| cfDNA H3K9me3 & H3K27me3 | Case-Control | Early-Stage Lung | 85% | 92% | 0.94 | OR: 48.2 |
| Plasma Nucleosome H3K4me2 | Longitudinal Cohort | Pancreatic | 78% | 90% | 0.89 | HR: 22.5 |
Detailed Experimental Protocols
Protocol 1: Histone Modification Analysis from Circulating Cell-Free DNA (cfDNA) in a Case-Control Study Objective: Quantify specific histone marks on nucleosomes in cfDNA from cancer cases vs. healthy controls. Workflow:
- Sample Collection: Draw peripheral blood from pre-diagnosed cases and matched controls. Process within 2 hours.
- Plasma & cfDNA Isolation: Double-centrifuge blood to obtain platelet-poor plasma. Use silica-membrane columns to extract cfDNA, quantifying yield via fluorometry.
- Immunoprecipitation (IP): Use antibodies specific for histone modifications (e.g., anti-H3K27ac, anti-H3K9me3) in a chromatin immunoprecipitation protocol adapted for cfDNA (cfChIP-seq). Incubate antibody with magnetic protein G beads, then add cfDNA sample.
- Library Prep & Sequencing: Build sequencing libraries directly from immunoprecipitated DNA. Use low-input protocols. Sequence on a Next-Generation Sequencing (NGS) platform (e.g., Illumina NovaSeq).
- Bioinformatics Analysis: Align sequences to reference genome. Call peaks for histone marks. Perform differential enrichment analysis between case and control groups.
Protocol 2: Prospective Validation in a Longitudinal Cohort Objective: Determine if baseline levels of H3K4me3 on PRC2 gene promoters in peripheral blood mononuclear cells (PBMCs) predict future cancer diagnosis. Workflow:
- Cohort Enrollment & Baseline Collection: Enroll asymptomatic, high-risk individuals (e.g., with genetic predisposition). Collect PBMCs via density gradient centrifugation and bank plasma at baseline.
- Follow-up: Follow participants per protocol (e.g., annual clinical exam, imaging). Document incident cancer cases.
- Nested Case-Control Analysis: Upon sufficient case accrual, select all incident cases and matched controls from the cohort.
- Sample Analysis: Retrieve baseline PBMC samples. Perform ChIP-qPCR for H3K4me3 at pre-specified gene targets.
- Statistical Modeling: Use Cox proportional hazards models to calculate hazard ratios (HR) for the association between baseline histone mark level and time-to-cancer diagnosis.
Visualizations
Clinical Validation Pathway for Histone Biomarkers
Histone Modifications in Early Cancer and Biomarker Release
The Scientist's Toolkit: Key Research Reagent Solutions
Table 3: Essential Reagents for Histone Modification Biomarker Studies
| Reagent / Material | Function | Example Application |
|---|---|---|
| High-Affinity Histone Modification Antibodies | Specific immunoprecipitation or detection of histone PTMs (e.g., H3K4me3, H3K27me3). | Chromatin Immunoprecipitation (ChIP), cfChIP-seq, immunoassay development. |
| cfDNA Extraction Kits (Magnetic Bead-based) | Isolation of high-integrity, ultrashort cfDNA fragments from plasma/serum. | Preparing input material for downstream epigenetic analysis from liquid biopsies. |
| Ultra-Low Input Library Prep Kits | Construction of sequencing libraries from minute amounts of DNA (<10 ng). | NGS library prep from immunoprecipitated cfDNA or limited clinical samples. |
| Synthetic Nucleosome Standards | Spike-in controls with defined histone modifications for assay calibration and normalization. | Quantifying technical variation and improving reproducibility in cfChIP assays. |
| PBMC Isolation Tubes | Density gradient media for consistent isolation of peripheral blood mononuclear cells. | Procuring viable leukocytes for epigenomic analysis from whole blood in cohort studies. |
| Multiplex Immunoassay Platforms | Simultaneous measurement of multiple protein analytes (e.g., modified histones) from a single sample. | High-throughput screening of histone marker panels in large clinical cohorts. |
1. Introduction Within the thesis framework of advancing histone modification biomarkers for early cancer detection, this whitepaper provides a technical comparison against two established biomarker classes: circulating tumor DNA (ctDNA) methylation and soluble protein biomarkers. We evaluate their molecular basis, detection methodologies, performance characteristics, and integration potential.
2. Molecular Basis & Technical Detection
Table 1: Core Characteristics of Biomarker Classes
| Feature | Histone Marks (Nucleosomes) | ctDNA Methylation | Protein Biomarkers (e.g., PSA, CA-125) |
|---|---|---|---|
| Molecular Entity | Post-translational modifications (PTMs) on histone tails (H3K4me3, H3K27ac, etc.) on circulating nucleosomes. | Covalent addition of a methyl group to cytosine in CpG dinucleotides in cell-free DNA. | Proteins secreted or shed by tumors into circulation. |
| Biological Signal | Epigenetic regulation of gene expression; reflects cellular state and identity. | Epigenetic silencing of tumor suppressor genes or genome instability. | Tumor burden, tissue leakage, or specific secretory activity. |
| Primary Source | Chromatin from apoptotic/necrotic tumor cells. | DNA from apoptotic/necrotic tumor cells. | Secretion/leakage from living or dying tumor cells. |
| Detection Matrix | Plasma/Serum (cell-free nucleosomes). | Plasma/Serum (cell-free DNA). | Plasma/Serum. |
| Key Assay Technologies | Immunoprecipitation-based (ChIP-seq-like from liquid biopsy), ELISA-like PTM-specific assays. | Bisulfite conversion followed by PCR (qMSP) or sequencing (WGBS, targeted). | Immunoassays (ELISA, ECLIA), Mass Spectrometry. |
| Primary Challenge | Low abundance, fragility of epitopes, requires high-affinity/specific binders. | Low fractional abundance, bisulfite-induced DNA damage, sequencing cost. | Lack of cancer-specificity, high background in benign conditions. |
3. Experimental Protocols
3.1. Protocol for ctDNA Methylation Analysis via Targeted Bisulfite Sequencing
- Cell-Free DNA Extraction: Isolate cfDNA from 3-10 mL plasma using silica-membrane or magnetic bead-based kits (e.g., QIAamp Circulating Nucleic Acid Kit). Elute in 20-50 µL.
- Bisulfite Conversion: Treat 5-50 ng cfDNA with sodium bisulfite (e.g., using EZ DNA Methylation-Lightning Kit). This converts unmethylated cytosines to uracil, while methylated cytosines remain as cytosine.
- Library Preparation & Target Enrichment: Amplify converted DNA with primers designed for bisulfite-converted sequences. Use multiplex PCR for targeted panels or hybrid capture with bisulfite-converted baits.
- High-Throughput Sequencing: Sequence on platforms like Illumina NovaSeq. Read depths of 10,000-50,000x per locus are often required for low-abundance ctDNA.
- Bioinformatics Analysis: Align reads to a bisulfite-converted reference genome. Calculate methylation percentage at each CpG site. Compare against healthy control profiles and known cancer methylation signatures.
3.2. Protocol for Histone Mark Analysis on Circulating Nucleosomes (NU-IPTM)
- Nucleosome Capture: Incubate 500 µL - 1 mL of plasma with magnetic beads coated with an antibody against a universal nucleosome epitope (e.g., histone H3 or H4 tail, without PTM).
- Washing: Wash beads with a low-salt buffer to remove non-specifically bound proteins and nucleic acids.
- Elution & Denaturation: Elute captured nucleosomes under mild acidic conditions or with a competing peptide. Denature to expose histone PTM epitopes.
- PTM-Specific Detection: Transfer eluate to a plate coated with a capture antibody for a specific histone PTM (e.g., H3K27me3). Use a detector antibody against another histone core protein (e.g., H2B) for quantification via chemiluminescence. Alternatively, use mass spectrometry for multiplexed PTM profiling.
- Data Normalization: Signal is normalized to total captured nucleosome content.
4. Pathway & Workflow Visualizations
Title: Biomarker Origin & Path to Detection
Title: Comparative Technical Workflows
5. Performance Data Summary
Table 2: Comparative Performance Metrics (Representative Data)
| Metric | Histone Marks (Research Phase) | ctDNA Methylation | Protein Biomarkers (e.g., PSA) |
|---|---|---|---|
| Early-Stage Sensitivity | 50-75% (Pan-cancer panels in validation) | 40-90% (Highly cancer-type and panel dependent) | Low (e.g., PSA: <20% for localized PCa) |
| Specificity | >95% (in initial studies for specific PTM combos) | >95% (with optimized panels) | Moderate-Poor (e.g., PSA: ~60% specificity at 4 ng/mL) |
| Tissue of Origin Prediction | High potential (histone marks are cell-type specific) | High (methylation patterns are tissue-specific) | Limited (elevated PSA points to prostate only) |
| Dynamic Range | Under investigation; correlates with tumor burden. | 4-5 orders of magnitude (fraction down to ~0.01%). | 2-3 orders of magnitude. |
| Turnaround Time | ~1-2 days (post-capture assay). | 1-5 days (sequencing-based). | < 2 hours. |
| Cost (per sample) | Moderate-High (antibody/reagent cost). | High (sequencing cost dominates). | Low. |
6. The Scientist's Toolkit: Key Research Reagent Solutions
Table 3: Essential Materials for Featured Experiments
| Item | Function & Application | Example (Research Use) |
|---|---|---|
| cfDNA/cfNucleosome Preservation Tubes | Stabilizes blood cells to prevent genomic DNA contamination during plasma processing. | Streck Cell-Free DNA BCT, PAXgene Blood ccfDNA Tube. |
| Magnetic Beads (Protein G/A) | Solid support for immunocapture of nucleosomes or proteins. | Dynabeads Protein G, Sera-Mag Magnetic Beads. |
| Pan-Nucleosome Capture Antibody | Captures all nucleosomes irrespective of PTM status for downstream PTM analysis. | Anti-Histone H3 (core) mAb, Anti-H2A/H2B/DNA complex mAb. |
| PTM-Specific Histone Antibodies | Detects specific histone modifications (e.g., H3K9me3, H3K27ac) via immunoassay or chromatin immunoprecipitation (ChIP). | Validated antibodies from Abcam, Cell Signaling Technology, Active Motif. |
| Bisulfite Conversion Kit | Chemically modifies DNA for discrimination of methylated vs. unmethylated cytosines. | Zymo Research EZ DNA Methylation Kit, Qiagen EpiTect Fast DNA Bisulfite Kit. |
| Methylation-Specific PCR Primers | Amplifies bisulfite-converted DNA to detect methylation at specific loci. | Custom-designed primers for targets like SEPTIN9 (colorectal cancer). |
| Multiplex Immunoassay Platform | Quantifies multiple protein biomarkers or PTM signatures simultaneously from limited sample. | Luminex xMAP, Meso Scale Discovery (MSD) U-PLEX. |
| NGS Library Prep Kit for Bisulfite DNA | Prepares sequencing libraries from bisulfite-converted, fragmented DNA. | Swift Biosciences Accel-NGS Methyl-Seq, Illumina DNA Prep with Enrichment. |
7. Conclusion and Integration Perspective While protein biomarkers offer clinical speed and ctDNA methylation provides high-specificity DNA-level information, histone marks on circulating nucleosomes represent a nascent class reflecting the epigenetic effector layer. The thesis posits that a multi-analyte approach, integrating fragmentomics, histone PTMs, and methylation, will be crucial for developing highly sensitive and specific liquid biopsies for early cancer detection. Histone marks may provide complementary data on the active regulatory state of the tumor genome, potentially informing both detection and therapeutic vulnerability.
Cost-Benefit and Feasibility Analysis for Widespread Clinical Implementation
Thesis Context: This analysis is framed within a broader thesis positing that histone modification signatures serve as highly sensitive and specific biomarkers for the early detection and stratification of cancer. Their clinical implementation could revolutionize oncology but requires rigorous economic and operational scrutiny.
The transition of histone modification biomarkers from research tools to routine clinical diagnostics presents a complex interplay of analytical validity, clinical utility, and economic viability. This guide provides a technical framework for evaluating this transition, focusing on cost structures, benefit quantification, and implementation feasibility for researchers and development professionals.
Current Cost Structures & Comparative Analysis
The financial landscape for implementing histone modification assays (e.g., ChIP-seq, CUT&Tag, mass spectrometry-based proteomics) is multi-faceted. The table below summarizes key cost components compared to established and emerging alternatives.
Table 1: Comparative Cost Analysis of Cancer Diagnostic Platforms
| Cost Component | Histone Modification Assays (e.g., CUT&Tag-seq) | Tissue-Based Genomic (e.g., Panel NGS) | Liquid Biopsy ctDNA | Standard Immunohistochemistry (IHC) |
|---|---|---|---|---|
| Reagent & Consumable Cost per Sample | $200 - $500 | $150 - $400 | $500 - $1,200 | $20 - $50 |
| Capital Equipment Cost | High ($100K - $500K) | High ($100K - $300K) | Very High ($500K+) | Low (<$50K) |
| Bioinformatics & Data Storage | Very High (Complex analysis, large data) | High | High | Negligible |
| Technical Labor (Hands-on Time) | Moderate-High (8-12 hrs) | Moderate (6-8 hrs) | Low-Moderate (4-6 hrs) | Low (2-3 hrs) |
| Turnaround Time | 3-5 days | 5-7 days | 5-10 days | 1-2 days |
| Throughput (Samples per Run) | Moderate (24-96) | High (up to hundreds) | High | High |
Quantifiable Benefit Analysis
The benefits of histone modification biomarkers extend beyond simple detection to mechanistic insight and therapeutic prediction.
Table 2: Quantified Benefit Framework for Histone Modification Biomarkers
| Benefit Category | Metric | Potential Impact & Evidence |
|---|---|---|
| Early Detection Sensitivity | AUC (Area Under Curve) | Pre-clinical models show AUC >0.95 for specific modifications (e.g., H3K4me3, H3K27ac) in early-stage lesions. |
| Therapeutic Guidance | Predictive Value for Therapy Response | H3K27me3 loss predicts sensitivity to EZH2 inhibitors in certain lymphomas; clinical trial data emerging. |
| Disease Monitoring | Dynamic Range of Signal | Quantifiable changes in H3K9me3 correlate with tumor burden and response in longitudinal studies. |
| Biological Insight | Pathway Dysfunction Identification | Maps oncogenic driver pathways (e.g., Wnt, NF-κB) more directly than mutation data alone. |
Detailed Experimental Protocol: CUT&Tag for Histone Mark Profiling
This protocol is a current, low-input method suitable for potential clinical assay development.
Objective: To generate genome-wide profiles of a specific histone modification (e.g., H3K4me3) from formalin-fixed paraffin-embedded (FFPE) or fresh tissue samples.
Materials & Workflow:
- Cell/Tissue Nuclei Isolation: Extract nuclei from ≤ 100,000 cells or a thin FFPE tissue section using a compatible extraction kit.
- Permeabilization & Antibody Binding: Permeabilize nuclei with digitonin. Incubate with primary antibody against target histone modification (e.g., anti-H3K4me3, Rabbit mAb).
- Secondary Antibody & pA-Tn5 Transposome Binding: Incubate with a secondary antibody (e.g., Guinea pig anti-Rabbit IgG). Subsequently, incubate with a pre-assembled pA-Tn5 Transposome (Protein A fused to hyperactive Tn5 transposase loaded with sequencing adapters). This complex tethers the DNA-cutting enzyme directly to the antibody target.
- Tagmentation: Activate Tn5 with Mg2+. The transposase simultaneously cuts DNA and inserts adapters only in the vicinity of the antibody-bound histone mark.
- DNA Extraction & Library Amplification: Release and purify DNA fragments. Perform a limited-cycle PCR (10-12 cycles) with barcoded primers to generate the final sequencing library.
- Sequencing & Analysis: Sequence on a high-throughput platform (e.g., Illumina NextSeq). Align reads, call peaks, and perform differential enrichment analysis.
Signaling Pathway & Therapeutic Relevance
Histone modifications are integral to epigenetic signaling cascades dysregulated in cancer.
Diagram 1: Histone Modification Signaling and Drug Targets
Clinical Implementation Workflow
The path from sample to clinical report involves multiple integrated steps.
Diagram 2: Clinical Epigenomic Testing Workflow
The Scientist's Toolkit: Key Research Reagent Solutions
Table 3: Essential Reagents for Histone Modification Analysis
| Reagent/Material | Function | Key Consideration for Clinical Transition |
|---|---|---|
| High-Specificity Primary Antibodies (e.g., anti-H3K27ac, anti-H3K9me3) | Binds specifically to the target histone modification. | Require rigorous validation for IVD use; lot-to-lot consistency is critical. |
| Protein A-Tn5 (pA-Tn5) Transposome | Enzyme conjugate that enables targeted tagmentation in CUT&Tag. | Manufacture under GMP conditions; stability and activity must be standardized. |
| Indexed Sequencing Adapters & PCR Mixes | Allows multiplexing and library amplification for NGS. | Must be part of a validated, contamination-controlled kit. |
| Synthetic Spike-in Nuclei/Chromatin (e.g., from D. melanogaster) | Internal control for normalization across runs. | Essential for quantitative accuracy and inter-lab reproducibility. |
| Bioinformatic Software & Reference Databases | Analyzes sequencing data and compares to normal/ disease maps. | Algorithms must be locked down and validated; databases require continuous, curated expansion. |
| Control Reference Samples (Positive, Negative, Process) | Monitors assay performance and diagnostic specificity/sensitivity. | Requires a biobank of well-characterized clinical samples with associated outcome data. |
Feasibility Assessment: Critical Barriers and Mitigations
Technical Feasibility: High. Core sequencing and assay technologies are mature. Primary Barrier: Standardization of wet-lab protocols and bioinformatic pipelines for clinical-grade reproducibility. Mitigation: Develop IVD/IVDR-certified kit versions of research assays (e.g., CUT&Tag) and FDA-cleared software.
Economic Feasibility: Moderate. Current costs are high but decreasing. Primary Barrier: Justifying premium cost over standard NGS or IHC based on improved clinical outcomes. Mitigation: Conduct robust health-economic studies demonstrating savings from earlier intervention and better therapy matching.
Regulatory & Operational Feasibility: Low-Moderate. Primary Barriers: Lack of predefined regulatory pathways for epigenetic diagnostics; integration into clinical workflows and physician education. Mitigation: Engage with regulatory agencies (FDA, EMA) early; develop integrated diagnostic reports and educational programs for oncologists.
The widespread clinical implementation of histone modification biomarkers is technologically attainable and holds immense promise for precision oncology. Its realization hinges on transforming robust research protocols into standardized, cost-effective, and regulated diagnostic tools. A concerted effort to address the economic, regulatory, and operational barriers outlined in this analysis is the necessary next step in translating epigenetic insight into patient benefit.
Regulatory Pathway Considerations for Epigenetic Biomarker Approval
The validation and regulatory approval of biomarkers present a formidable scientific and regulatory challenge. This complexity is magnified for epigenetic biomarkers, particularly those analyzing histone post-translational modifications (PTMs) such as acetylation, methylation, and phosphorylation. These modifications serve as dynamic regulators of chromatin structure and gene expression, and their dysregulation is a hallmark of early carcinogenesis. Consequently, histone PTMs hold immense promise as sensitive, early detection biomarkers for cancers. However, their path from laboratory discovery to clinically validated, regulatory-body-approved diagnostic tools is fraught with unique technical and regulatory hurdles. This guide provides an in-depth technical analysis of the regulatory pathway considerations specific to epigenetic biomarkers, with a focus on assays quantifying histone modifications for early cancer detection.
Regulatory Framework and Classification
The primary regulatory bodies governing biomarker approval are the U.S. Food and Drug Administration (FDA) and the European Medicines Agency (EMA). The classification of the biomarker test dictates the regulatory pathway.
Table 1: Regulatory Classification and Pathways for Biomarker Tests
| Classification | Definition | Regulatory Pathway (FDA) | Key Considerations for Epigenetic Biomarkers |
|---|---|---|---|
| Laboratory Developed Test (LDT) | Test designed, manufactured, and used within a single CLIA-certified laboratory. | Primarily under CLIA oversight; FDA enforcement discretion is evolving. | Common for early-stage, exploratory histone modification assays (e.g., ChIP-seq from biopsies). Lack of pre-market review poses challenges for widespread adoption. |
| In Vitro Diagnostic (IVD) | Kit or system intended for use in diagnosis, packaged and sold to multiple laboratories. | Premarket Notification [510(k)] or Premarket Approval (PMA). | Required for commercially distributed histone assay kits (e.g., ELISA for H3K9ac in plasma nucleosomes). Requires rigorous analytical and clinical validation. |
| Investigational Use Only (IUO) | For use in laboratory research; not for diagnostic procedures. | Exempt from FDA requirements, but must be labeled "IUO". | Used in early clinical studies to gather evidence for clinical validity of a histone biomarker. |
| Companion Diagnostic (CDx) | Test essential for the safe and effective use of a corresponding therapeutic product. | Co-developed and reviewed with the therapeutic drug under PMA. | Future potential for histone modification biomarkers predicting response to epigenetic therapies (e.g., HDAC or EZH2 inhibitors). |
Recent searches indicate a shifting landscape, with the FDA moving towards increased oversight of LDTs under the Medical Device Regulation, emphasizing the need for robust validation even for lab-specific epigenetic assays.
Analytical Validation: A Technical Deep Dive
Analytical validation establishes that the test accurately and reliably measures the histone modification of interest. This is particularly challenging for epigenetic marks due to their labile nature and complexity.
Core Experimental Protocols:
A. Chromatin Immunoprecipitation Sequencing (ChIP-seq) for Histone Modifications (Tissue-Based)
- Objective: To map the genome-wide distribution of a specific histone modification (e.g., H3K4me3) in tumor vs. normal tissue.
- Protocol Summary:
- Crosslinking & Cell Lysis: Tissue is crosslinked with formaldehyde (1% for 10 min) to preserve protein-DNA interactions, followed by lysis.
- Chromatin Shearing: Sonication to fragment chromatin to 200-500 bp fragments.
- Immunoprecipitation: Incubation with a highly specific, validated antibody against the target histone PTM. Antibody-chromatin complexes are captured using protein A/G beads.
- Washing & Elution: Beads are stringently washed. Crosslinks are reversed, and DNA is purified.
- Library Prep & Sequencing: DNA fragments are prepared for next-generation sequencing (NGS).
- Bioinformatic Analysis: Reads are aligned to a reference genome, peaks are called (using tools like MACS2), and differential enrichment regions are identified.
B. Liquid Biopsy Assay for Circulating Nucleosomal Epigenetics (ELISA-based)
- Objective: To quantify global levels of a histone modification (e.g., H3K9ac) in circulating nucleosomes from patient plasma.
- Protocol Summary:
- Plasma Isolation & Nucleosome Capture: Plasma is isolated from blood collected in EDTA tubes via double centrifugation. Circulating nucleosomes are captured onto a plate coated with an anti-histone antibody (pan-histone or anti-core histone).
- Detection of PTM: A detector antibody specific to the histone PTM (e.g., anti-H3K9ac) is applied.
- Signal Amplification & Readout: A horse-radish peroxidase (HRP)-conjugated secondary antibody and chemiluminescent substrate are used. Signal is proportional to the amount of target PTM in the sample.
- Quantification: Results are interpolated from a standard curve generated using synthetic nucleosomes with defined modification states.
Key Analytical Performance Metrics & Data:
Table 2: Analytical Validation Parameters for a Hypothetical H3K9ac Plasma ELISA
| Performance Parameter | Target Specification | Experimental Method for Validation |
|---|---|---|
| Precision (Repeatability) | CV < 15% | Run 20 replicates of low, mid, and high QC samples in one run. |
| Precision (Reproducibility) | CV < 20% | Run same QC samples across 5 days, 3 operators, 2 lots. |
| Accuracy (Recovery) | 85-115% recovery | Spike known amounts of modified nucleosome standard into plasma matrix. |
| Analytical Sensitivity (LoD) | < 0.5 ng/mL nucleosome equivalents | Measure 20 zero standard replicates, calculate mean + 2SD. |
| Reportable Range | 0.5 - 200 ng/mL | Demonstrate linearity via dilution of high-concentration sample. |
| Specificity/Interference | <10% bias from hemolysis, lipids, bilirubin | Spike analyte into samples with added interferents. |
| Antibody Specificity | No cross-reactivity with similar PTMs (e.g., H3K14ac) | Test via peptide competition ELISA or western blot. |
Analytical Validation Workflow for Epigenetic Biomarkers
Clinical Validation & Evidence Generation
Clinical validation establishes that the biomarker test accurately identifies or predicts the clinical condition of interest (e.g., early-stage cancer).
Study Design Essentials:
- Retrospective vs. Prospective: Initial validation often uses retrospective, banked samples from well-characterized cohorts (e.g., cancer patients vs. healthy controls). Pivotal studies must be prospective.
- Blinding: Testing must be performed blinded to the clinical diagnosis.
- Statistical Endpoints: For a diagnostic test, key metrics are:
- Clinical Sensitivity: Proportion of true cancer patients testing positive.
- Clinical Specificity: Proportion of true healthy individuals testing negative.
- Area Under the Curve (AUC) of the Receiver Operating Characteristic (ROC) curve.
Table 3: Example Clinical Validation Outcomes for a Histone Biomarker Panel
| Biomarker Panel | Cancer Type | Sample Type | Study Design | Key Result (AUC) | Reference (Example) |
|---|---|---|---|---|---|
| H3K9ac, H3K27me3 | Colorectal Cancer (Stage I/II) | Plasma | Case-Control (200 cases, 200 controls) | 0.89 (95% CI: 0.85-0.92) | Fictional et al., 2023 |
| H3K4me3 (Promoter of SEPT9) | Breast Cancer | Tissue Biopsy | Retrospective Cohort (n=500) | Sensitivity: 82%, Specificity: 88% | Fictional et al., 2022 |
| Multi-omics (H3K36me2 + Mutations) | Lung Adenocarcinoma | Plasma & Tissue | Prospective Observational (n=1000) | AUC: 0.93 for early detection | Fictional Consortium, 2024 |
Clinical Evidence Generation Pathway
The Scientist's Toolkit: Research Reagent Solutions
Table 4: Essential Reagents for Histone Modification Biomarker Research
| Reagent / Material | Function & Criticality | Key Selection Considerations |
|---|---|---|
| PTM-Specific Antibodies | Immunodetection (ChIP, ELISA, IHC). The cornerstone of specificity. | Validation for application (ChIP-grade, ELISA-specific). Check cross-reactivity data. Use publicly validated antibodies (e.g., from CST, Abcam). |
| Recombinant Modified Nucleosomes | Positive controls and standard curve generation for quantitative assays. | Defined modification state (e.g., tri-methylated at H3K4). Purity and source (e.g., EpiCypher). |
| Cell/Tissue Stabilization Buffers | Preserve the native epigenetic state by inhibiting enzyme activity (HDACs, HATs, KDMs). | Immediate inhibition of enzymatic activity is critical for accurate in vivo snapshot. |
| DNA Methylation Inhibitors (e.g., 5-Aza) | Used in functional studies to dissect interplay between DNA methylation and histone marks. | Cytotoxic; requires optimization of dose and duration. |
| Next-Generation Sequencing Kits | For genome-wide mapping (ChIP-seq, ATAC-seq). | Compatibility with low-input samples (critical for clinical biopsies). Paired-end sequencing recommended. |
| Bioinformatic Pipelines & Software | Analysis of NGS data, peak calling, differential analysis. | Use established, reproducible pipelines (e.g., nf-core/ChIPseq). Reference genomes must be version-controlled. |
| Liquid Biopsy Collection Tubes | Stabilize blood cells to prevent background release of genomic material. | Choice of preservative (e.g., Streck, PAXgene). Impacts nucleosome recovery and integrity. |
Navigating Submission to Regulatory Agencies
A successful submission integrates all previous sections into a cohesive dossier.
- FDA Submission (PMA): Includes Technical Data Section (analytical validation), Clinical Data Section (clinical validation), Manufacturing Information, and proposed labeling.
- Clinical Utility: Beyond validity, regulators increasingly require evidence of clinical utility—demonstration that using the test improves patient outcomes or guides effective management, a key challenge for early detection biomarkers.
- Standards and Guidelines: Follow relevant guidelines: FDA's Bioanalytical Method Validation, CLSI guidelines (e.g., EP05, EP06, EP07, EP17), and MIAME/ChIP-seq standards for reporting.
The regulatory pathway for epigenetic biomarkers is rigorous but navigable. Success hinges on early and strategic planning, starting with a robust analytical foundation, moving through well-designed clinical studies, and culminating in a comprehensive regulatory submission that clearly demonstrates the test's safety, validity, and utility for improving early cancer detection and patient care.
Conclusion
Histone modification biomarkers represent a powerful and underexplored frontier for early cancer detection, offering a stable, information-rich readout of early epigenetic dysregulation. While foundational research has identified promising specific marks, methodological advances in liquid biopsy and single-cell analysis are critical for translation. Overcoming technical challenges related to sensitivity and standardization is paramount. Rigorous validation against existing standards will determine their clinical utility and potential for integration into multi-modal diagnostic panels. Future directions must focus on large-scale prospective trials, the development of non-invasive pan-cancer screens, and leveraging these biomarkers for early interception therapies, ultimately paving the way for a new era of precision epigenetics in oncology.