From Raw Reads to Biomarkers: A Practical Guide to WGBS and RRBS Methylation Data Analysis for Clinical and Research Applications
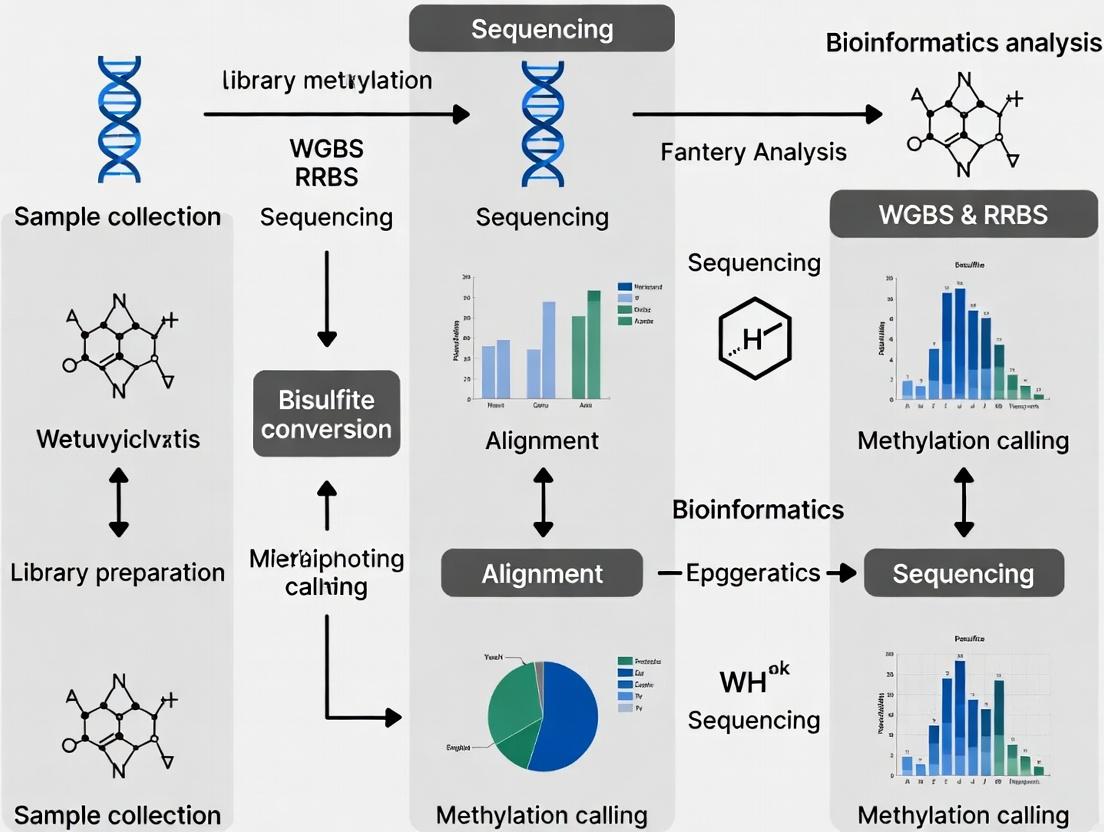
This article provides a comprehensive, step-by-step guide to analyzing DNA methylation data from Whole-Genome Bisulfite Sequencing (WGBS) and Reduced Representation Bisulfite Sequencing (RRBS).
From Raw Reads to Biomarkers: A Practical Guide to WGBS and RRBS Methylation Data Analysis for Clinical and Research Applications
Abstract
This article provides a comprehensive, step-by-step guide to analyzing DNA methylation data from Whole-Genome Bisulfite Sequencing (WGBS) and Reduced Representation Bisulfite Sequencing (RRBS). Aimed at researchers and drug development professionals, it covers the entire workflow from foundational biological principles and raw data processing to advanced statistical analysis, troubleshooting, and clinical validation. The guide incorporates the latest methodologies, including comparisons with emerging techniques like Enzymatic Methyl-seq (EM-seq), strategies for differential methylation analysis, and the integration of machine learning for biomarker discovery. The goal is to empower scientists to generate robust, biologically meaningful, and clinically relevant insights from their epigenomic studies.
Decoding the Epigenetic Blueprint: Core Principles and Technology Choices for WGBS and RRBS
The Biological Significance of DNA Methylation in Gene Regulation and Disease
1. Introduction DNA methylation, the addition of a methyl group to the 5-carbon of cytosine to form 5-methylcytosine (5mC), is a fundamental epigenetic mechanism. It predominantly occurs at CpG dinucleotides and plays a critical role in chromatin remodeling, genomic imprinting, X-chromosome inactivation, and the suppression of transposable elements. Aberrant DNA methylation patterns are a hallmark of various complex diseases, including cancer, neurological disorders, and autoimmune conditions. Within the framework of a DNA methylation data analysis workflow for Whole-Genome Bisulfite Sequencing (WGBS) and Reduced Representation Bisulfite Sequencing (RRBS) research, understanding the biological context of these modifications is paramount for accurate interpretation and hypothesis generation.
2. Core Biological Functions in Gene Regulation DNA methylation regulates gene expression primarily by influencing the local chromatin environment. Methylated CpGs in promoter regions are generally associated with transcriptional repression. This occurs through two main mechanisms: (1) direct inhibition of transcription factor binding, and (2) recruitment of Methyl-CpG-Binding Domain (MBD) proteins, which in turn recruit histone deacetylases and other chromatin remodelers to establish a compact, transcriptionally silent heterochromatin state. Conversely, gene body methylation in actively transcribed regions is often correlated with gene expression and may prevent spurious transcription initiation.
Table 1: Key Functions of DNA Methylation in Mammalian Systems
| Genomic Context | Typical Methylation State | Primary Biological Function | Consequence of Dysregulation |
|---|---|---|---|
| Promoter CpG Islands | Hypomethylated | Permissive for transcription | Ectopic hypermethylation leads to tumor suppressor gene silencing. |
| Gene Bodies | Hypermethylated | Transcriptional elongation, splicing regulation | Altered transcript isoform expression. |
| Repetitive Elements | Hypermethylated | Maintain genomic stability | Hypomethylation leads to genomic instability and transposon activation. |
| Imprinting Control Regions (ICRs) | Allele-specific | Monoallelic gene expression | Loss of imprinting (e.g., in Beckwith-Wiedemann syndrome). |
3. DNA Methylation in Human Disease Abnormal DNA methylation landscapes are extensively linked to disease pathogenesis. In cancer, global hypomethylation coincides with focal hypermethylation of tumor suppressor gene promoters. In neurological disorders like Alzheimer's disease, methylation shifts in genes related to neuroinflammation and amyloid processing have been documented. Recent studies highlight its role in autoimmune diseases by regulating key immune response genes.
Table 2: Examples of Disease-Associated DNA Methylation Alterations
| Disease Category | Example Gene/Region | Alteration | Potential Functional Impact |
|---|---|---|---|
| Colorectal Cancer | MLH1 promoter | Hypermethylation | Microsatellite instability. |
| Acute Myeloid Leukemia | Genome-wide | Hypermethylation of Polycomb target genes | Block in differentiation. |
| Alzheimer's Disease | ANKA1 | Hypomethylation | Increased neuroinflammation. |
| Rheumatoid Arthritis | CXCL12 | Hypomethylation | Enhanced leukocyte migration. |
4. Application Notes & Protocols for Integrative Analysis Application Note 4.1: Integrating WGBS/RRBS Data with Transcriptomic Profiles Objective: To identify candidate genes whose expression is likely directly regulated by promoter DNA methylation. Procedure:
- Data Preprocessing: Align WGBS/RRBS reads using
bismarkorBS-Seeker2. Perform methylation calling to generate.covfiles (containing % methylation per CpG). - Differential Methylation Analysis: Use
DSSormethylKitto identify Differentially Methylated Regions (DMRs). Define promoters as regions from -1500 bp to +500 bp relative to the Transcription Start Site (TSS). - Integration: For each gene, correlate the average promoter methylation level (from Step 2) with its normalized expression value (e.g., from RNA-seq) using a non-parametric test (Spearman's rank). A significant negative correlation (e.g., p-adjusted < 0.05, rho < -0.5) suggests direct regulatory potential.
- Validation Prioritization: Genes with hypermethylated promoters and low expression in disease samples are high-priority candidates for functional validation (e.g., via CRISPR-mediated demethylation).
Protocol 4.2: Targeted Validation of a Candidate DMR using Pyrosequencing Objective: To quantitatively validate methylation levels at a specific DMR identified from WGBS/RRBS analysis in an independent cohort of samples. Materials: Sodium bisulfite conversion kit (e.g., EZ DNA Methylation-Lightning Kit), PCR reagents, designed pyrosequencing assays. Methodology:
- Bisulfite Conversion: Treat 500 ng of genomic DNA with sodium bisulfite, converting unmethylated cytosines to uracil, while methylated cytosines remain as cytosine.
- PCR Amplification: Design PCR primers that flank the DMR and are bisulfite-converted specific. Amplify the target region from bisulfite-converted DNA.
- Pyrosequencing: Use a sequencing primer internal to the PCR product. Perform sequencing on a PyroMark system. The proportion of C versus T at each CpG site is quantitatively displayed as % methylation.
- Analysis: Compare the average % methylation across all CpGs within the DMR between case and control groups using a t-test.
The Scientist's Toolkit: Research Reagent Solutions Table 3: Essential Reagents for DNA Methylation Analysis
| Reagent/Material | Function | Example Product |
|---|---|---|
| Sodium Bisulfite Conversion Kit | Converts unmethylated C to U for downstream sequence discrimination. | EZ DNA Methylation-Lightning Kit (Zymo Research) |
| Methylation-Sensitive Restriction Enzymes | Enriches for methylated or unmethylated DNA fragments in RRBS library prep. | MspI (CpG methylation insensitive), HpaII (methylation sensitive) |
| 5-methylcytosine Antibody | For enrichment-based techniques like MeDIP (Methylated DNA Immunoprecipitation). | Anti-5-methylcytosine monoclonal antibody |
| DNA Methyltransferase Inhibitors | Tool compounds for in vitro or in vivo demethylation studies. | 5-Azacytidine (Decitabine) |
| Bisulfite PCR Primer Design Software | Critical for designing specific primers for bisulfite-converted DNA. | MethPrimer, PyroMark Assay Design SW |
5. Visualized Workflows and Pathways
DNA Methylation Mediated Transcriptional Repression Pathway
WGBS and RRBS Data Analysis Core Workflow
Within the workflow for DNA methylation data analysis, the choice of sequencing technique is foundational. Whole Genome Bisulfite Sequencing (WGBS) and Reduced Representation Bisulfite Sequencing (RRBS) are two cornerstone methods for profiling DNA methylation at single-nucleotide resolution. This application note provides a detailed comparison of their technical parameters, experimental protocols, and applications, empowering researchers and drug development professionals to select the optimal approach for their specific study within a broader epigenetic research thesis.
Quantitative Comparison: WGBS vs. RRBS
Table 1: Core Technical Specifications and Performance Metrics
| Feature | Whole Genome Bisulfite Sequencing (WGBS) | Reduced Representation Bisulfite Sequencing (RRBS) |
|---|---|---|
| Genomic Coverage | >90% of all CpGs in the genome. | ~2-5 million CpGs, focusing on CpG-rich regions (promoters, CpG islands, shores). |
| Required Sequencing Depth | High (20-30x per strand for mammalian genomes). | Lower (5-10x per strand for covered regions). |
| Input DNA | 50-200 ng (standard); down to 1-10 ng (ultra-low input protocols). | 5-100 ng (optimal); can work with as low as 1 ng. |
| Cost per Sample | High (comprehensive sequencing). | Moderate (targeted sequencing). |
| Key Strength | Unbiased, genome-wide discovery of methylation in any genomic context. | Cost-effective, high-coverage of functionally relevant regulatory regions. |
| Primary Limitation | High cost and data load; lower coverage of sparse CpGs. | Misses CpG-poor regions (e.g., gene bodies, deserts), intergenic areas. |
| Best Applications | De novo discovery, imprinting, transposable elements, non-CpG methylation (CHG, CHH). | Large cohort studies, cancer biomarker studies, focused differential methylation analysis. |
Table 2: Data Output and Analysis Considerations
| Aspect | WGBS | RRBS |
|---|---|---|
| Typical Data Yield per Sample | 800-1200 million paired-end reads (human). | 10-50 million single-end reads. |
| Bioinformatics Complexity | High (large data volume, alignment challenges). | Moderate (simpler alignment, but requires in silico digestion). |
| Suitability for Low-Methylated Regions | Excellent. | Poor for regions outside restriction enzyme targets. |
Experimental Protocols
Core Protocol: WGBS Library Preparation
This protocol is based on post-bisulfite adaptor tagging (PBAT) methods for low-input compatibility.
Key Reagents & Materials:
- Fragmented Genomic DNA: 1-50 ng in low TE buffer.
- Bisulfite Reagent: e.g., EZ DNA Methylation-Lightning Kit (Zymo Research).
- SPRI Beads: For clean-up and size selection.
- DNA Polymerase: Klenow Fragment (exo-).
- Methylated Adapters: Compatible with bisulfite-converted strands.
- PCR Primers & High-Fidelity Hot Start Polymerase.
- Qubit dsDNA HS Assay Kit & Bioanalyzer/TapeStation.
Detailed Steps:
- DNA Denaturation & Bisulfite Conversion: Denature DNA with NaOH. Treat with bisulfite reagent (typically: 98°C for 8-10 min, 54°C for 60 min, hold at 4°C). Convert unmethylated cytosines to uracils.
- Clean-up & Desulfonation: Purify converted DNA using provided columns or beads. Perform desulfonation reaction to complete conversion.
- First Strand Synthesis: Add a primer containing random hexamers and a defined adapter sequence (Adapter A). Use Klenow polymerase to synthesize the first strand.
- Second Strand Synthesis & Adapter Ligation: Use a primer containing random hexamers and a second adapter sequence (Adapter B) to synthesize the second strand, creating double-stranded libraries with full adapters.
- PCR Amplification: Amplify libraries for 10-15 cycles using primers complementary to Adapter A and B.
- Size Selection & Purification: Perform double-sided SPRI bead cleanup (e.g., 0.6x and 1.2x ratios) to select fragments ~200-500 bp.
- Quality Control & Quantification: Assess library concentration (Qubit) and size profile (Bioanalyzer). Quantify by qPCR for accurate sequencing loading.
- Sequencing: Perform paired-end sequencing on an Illumina platform (e.g., NovaSeq 6000).
Core Protocol: RRBS Library Preparation
This protocol uses MspI restriction enzyme digestion, which cuts at CCGG sites regardless of methylation.
Key Reagents & Materials:
- Genomic DNA: 5-100 ng.
- Restriction Enzyme: MspI (CpG methylation-insensitive).
- SPRI Beads.
- End Repair & A-Tailing Kit.
- Methylated Adapters (for Illumina).
- DNA Ligase.
- Bisulfite Reagent.
- Hot Start PCR Master Mix.
- Qubit dsDNA HS Assay Kit & Bioanalyzer/TapeStation.
Detailed Steps:
- Restriction Digestion: Digest DNA with MspI (37°C for 4-16 hours). This enriches for CpG-rich fragments.
- End Repair & A-Tailing: Repair fragment ends and add an 'A' overhang for adapter ligation.
- Adapter Ligation: Ligate methylated Illumina sequencing adapters to the fragments.
- Size Selection: Perform SPRI bead cleanup (typically 0.9x ratio) to select fragments in the desired range (e.g., 150-400 bp).
- Bisulfite Conversion: Treat size-selected libraries with bisulfite reagent (as per WGBS step 1).
- Clean-up & Desulfonation: Purify converted DNA.
- PCR Amplification: Amplify libraries for 12-18 cycles. Primers contain index sequences for multiplexing.
- Final Purification & QC: Perform final SPRI bead cleanup. Assess library concentration, size, and quality.
- Sequencing: Perform single-end or paired-end sequencing (50-150 bp reads).
Visualized Workflows and Relationships
Diagram 1: WGBS core experimental workflow (76 chars)
Diagram 2: RRBS core experimental workflow (76 chars)
Diagram 3: WGBS vs RRBS selection logic (78 chars)
The Scientist's Toolkit: Key Research Reagent Solutions
Table 3: Essential Materials for DNA Methylation Sequencing
| Item | Function in WGBS/RRBS | Example Product/Kit |
|---|---|---|
| Bisulfite Conversion Kit | Chemically converts unmethylated cytosine to uracil while leaving 5-methylcytosine intact. Critical for both methods. | EZ DNA Methylation-Lightning Kit (Zymo), MethylCode Kit (Thermo). |
| Methylated Adapters | Adapters compatible with bisulfite-treated DNA (contain methylated cytosines to prevent conversion). Essential for library prep post-conversion. | TruSeq DNA Methylation Adapters (Illumina), NEXTFLEX Bisulfite-Seq Barcodes (PerkinElmer). |
| Restriction Enzyme (MspI) | For RRBS only. Cuts at CCGG sites to fragment genome and enrich for CpG-rich regions. | MspI (NEB). |
| High-Fidelity Hot Start PCR Master Mix | For robust, low-bias amplification of bisulfite-converted, adapter-ligated libraries. | KAPA HiFi HotStart Uracil+ ReadyMix (Roche), Pfu Turbo Cx Hotstart (Agilent). |
| SPRI Magnetic Beads | For size selection, clean-up, and buffer exchange steps throughout library preparation. | AMPure XP Beads (Beckman Coulter). |
| Library QC Kits | Accurate quantification and sizing of final sequencing libraries. | Qubit dsDNA HS Assay (Thermo), Bioanalyzer High Sensitivity DNA Kit (Agilent). |
| Bisulfite Conversion Control DNA | Unmethylated and methylated control DNA to monitor conversion efficiency. | CpGenome Universal Methylated DNA (MilliporeSigma). |
Within the established workflow for DNA methylation data analysis—encompassing Whole-Genome Bisulfite Sequencing (WGBS) and Reduced Representation Bisulfite Sequencing (RRBS)—the limitations of bisulfite conversion are well-recognized. Bisulfite treatment degrades DNA significantly (90-99% loss), introduces sequence bias, and complicates library preparation. This Application Note introduces two advanced methodologies that circumvent these issues: Enzymatic Methyl-seq (EM-seq) and Third-Generation Sequencing (e.g., PacBio and Oxford Nanopore). These techniques enable more accurate, longer-read, and less destructive methylation profiling, which is critical for researchers and drug development professionals investigating epigenetics in complex disease models and therapeutic targeting.
Technology Comparison: Bisulfite-seq vs. EM-seq vs. Third-Gen Sequencing
Table 1: Quantitative Comparison of Methylation Profiling Methods
| Feature | Whole-Genome Bisulfite Sequencing (WGBS) | Enzymatic Methyl-seq (EM-seq) | PacBio SMRT Sequencing | Oxford Nanopore Sequencing |
|---|---|---|---|---|
| Conversion Method | Chemical (Sodium Bisulfite) | Enzymatic (TET2, APOBEC) | Direct Detection | Direct Detection |
| DNA Damage & Loss | High (90-99% fragmentation/loss) | Low (<50% loss) | Very Low | Very Low |
| Read Length | Short (PE 75-150bp) | Short (PE 75-150bp) | Very Long (10-25 kb) | Extremely Long (up to >2 Mb) |
| Single-Molecule Resolution | No (PCR amplified) | No (PCR amplified) | Yes | Yes |
| Basecall Modification Detection | Indirect (C to T conversion) | Indirect (C to T conversion) | Direct (Kinetics) | Direct (Current Signal) |
| Estimated CpG Coverage per Run | ~20-30 million (human) | ~20-30 million (human) | 500k - 2 million | 5 - 10 million+ |
| Typical Mapping Rate | ~60-80% | ~85-95% | 85-90% | 85-95% |
| GC Bias | High | Low | Low | Moderate |
| Primary Advantage | Established, gold standard | High DNA integrity, high mapping | Long reads, haplotype phasing | Ultra-long reads, real-time, portable |
Detailed Experimental Protocols
Enzymatic Methyl-seq (EM-seq) Library Preparation Protocol
Principle: EM-seq uses a two-step enzymatic reaction to differentiate between methylated and unmethylated cytosines without DNA strand degradation. TET2 oxidizes 5mC and 5hmC to 5-carboxylcytosine (5caC). APOBEC then deaminates unmodified cytosines to uracils, while 5caC remains unchanged. Subsequent PCR and sequencing treat uracil as thymine, analogous to bisulfite conversion.
Key Research Reagent Solutions:
- EM-seq Kit (NEB): Contains TET2, APOBEC, and all necessary buffers for enzymatic conversion.
- DNA Purification Beads (SPRI): For size selection and clean-up between enzymatic steps.
- Library Prep Kit (e.g., Illumina): For adapter ligation and PCR amplification post-conversion.
- High-Fidelity PCR Master Mix: For minimal-bias amplification of converted DNA.
- Qubit dsDNA HS Assay Kit: For accurate quantification of low-input, fragmented DNA.
Step-by-Step Workflow:
- Input DNA Fragmentation & End-Prep: Fragment 10-100ng genomic DNA via sonication or enzymatic shearing to desired size (e.g., 200-300bp). Repair ends and add a single 'A' overhang.
- Adapter Ligation: Ligate methylated or unique dual-indexed adapters compatible with your sequencing platform.
- Enzymatic Conversion: a. Oxidation: Incubate adapter-ligated DNA with TET2 enzyme in reaction buffer at 37°C for 1 hour. TET2 oxidizes 5mC/5hmC to 5caC. b. Purification: Clean up reaction using SPRI beads. c. Deamination: Incubate oxidized DNA with APOBEC enzyme in its reaction buffer at 37°C for 3 hours. APOBEC deaminates unmodified C to U, leaving 5caC intact. d. Purification: Clean up reaction using SPRI beads.
- PCR Amplification: Perform limited-cycle PCR (6-10 cycles) using a high-fidelity polymerase. The polymerase reads U as T and 5caC as C, completing the conversion.
- Library QC & Sequencing: Quantify library via qPCR, check size distribution on a Bioanalyzer, and sequence on an Illumina platform (PE 150bp recommended).
Third-Generation Sequencing for Direct Methylation Detection
Protocol A: PacBio SMRT Sequencing for 5mC Detection
Principle: PacBio's Single Molecule, Real-Time (SMRT) sequencing detects DNA polymerase kinetics. The incorporation of a nucleotide by a bound polymerase is monitored in real-time. Methylated bases (5mC) cause a characteristic inter-pulse duration (IPD) delay compared to unmethylated cytosines, allowing direct, single-molecule detection.
Workflow:
- High-Molecular-Weight DNA Extraction: Use gentle methods (e.g., magnetic bead-based or column-based kits for long DNA) to obtain >20kb genomic DNA.
- SMRTbell Library Preparation: Fragment DNA to target size (e.g., 15-20kb). Repair ends, ligate hairpin adapters to create circular SMRTbell templates.
- Size Selection: Use BluePippin or SPRI for precise size selection to enrich for long fragments.
- Primer Annealing & Polymerase Binding: Anneal sequencing primers to the SMRTbell template and bind a proprietary DNA polymerase.
- Sequencing on SMRT Cell: Load complexes into zero-mode waveguides (ZMWs). Sequence with continuous long-read (CLR) or high-fidelity (HiFi) mode. Software records polymerase kinetics.
- Basecalling & Modification Detection: Use the SMRT Link software with the Modification and Motif Analysis application. The kinetic model compares observed IPDs to a canonical model to call 5mC at base resolution.
Protocol B: Oxford Nanopore Sequencing for 5mC Detection
Principle: As DNA passes through a protein nanopore, changes in the ionic current are measured. Modified bases, like 5mC, alter the current signature in a recognizable way relative to canonical bases.
Workflow:
- Ultra-Long DNA Extraction: Use specialized protocols (e.g., Nanobind or Blood & Tissue kits) to obtain multi-hundred kb DNA.
- Library Preparation (Ligation Sequencing Kit): Repair/dephosphorylate DNA ends. Ligate a sequencing adapter containing a motor protein to one end and a tether adapter to the other.
- Priming the Flow Cell: Load the library onto a MinION, GridION, or PromethION flow cell containing thousands of nanopores.
- Real-Time Sequencing: Apply voltage; the motor protein ratchets DNA through the pore. Raw current signals (squiggles) are recorded.
- Basecalling & Methylation Calling: Use basecaller software (e.g., Dorado) in "modified base" mode with a 5mC-aware model (e.g.,
dna_r10.4.1_e8.2_400bps_modbases_5mc_cg_sup). The model translates squiggles to a sequence (FASTQ) and simultaneously outputs modification probabilities (FAST5 or BAM).
Visualization of Workflows and Relationships
Diagram 1: Methylation Profiling Technology Workflow Comparison (76 chars)
Diagram 2: DNA Methylation Data Analysis Pipeline (64 chars)
The Scientist's Toolkit: Essential Research Reagent Solutions
Table 2: Key Reagents for Advanced Methylation Profiling
| Category | Item / Kit Name | Primary Function in Protocol |
|---|---|---|
| DNA Input & QC | Qubit dsDNA HS / BR Assay Kits | Accurate quantification of intact genomic DNA pre-library prep. |
| Agilent Genomic DNA TapeStation / Femto Pulse | Assess DNA integrity and size distribution, critical for long-read methods. | |
| EM-seq | NEBNext Enzymatic Methyl-seq Kit (NEB E7120/7125) | All-in-one kit for enzymatic oxidation and deamination steps. |
| KAPA HiFi HotStart Uracil+ ReadyMix (Roche) | PCR mix optimized for amplifying uracil-containing (EM-converted) templates. | |
| PacBio | SMRTbell Prep Kit 3.0 | Construct SMRTbell libraries from fragmented DNA for CLR or HiFi sequencing. |
| Sequel II/IIe Binding Kit 3.2 | Contains polymerase and buffers for binding to SMRTbell templates. | |
| Nanopore | Ligation Sequencing Kit (SQK-LSK114) | Standard kit for preparing DNA libraries for nanopore sequencing. |
| DNA CS (DCS114) / 5mC Control | Positive control DNA containing known 5mC sites for model training/QC. | |
| Target Enrichment | Roche SeqCap Epi CpGiant or Twist NGS Methylation Panel | Hybridization-based capture to focus sequencing on relevant CpG-rich regions. |
| Data Analysis | Dorado Basecaller (Oxford Nanopore) | Software for basecalling and simultaneous 5mC detection from raw signals. |
| SMRT Link Modification & Motif Analysis (PacBio) | Integrated software suite for kinetic-based modification detection. | |
| MethylDackel / Bismark | Tools for extracting methylation metrics from aligned EM-seq/Bisulfite-seq data. |
Within the thesis on DNA methylation analysis workflows (WGBS, RRBS), defining the analytical goal is paramount. This progression moves from unbiased, genome-wide discovery in exploratory phases to focused, high-throughput validation of specific biomarkers. The choice of assay, statistical approach, and validation strategy is entirely dependent on this goal definition.
Table 1: Comparison of Discovery vs. Validation Phases in Methylation Analysis
| Aspect | Exploratory Discovery Phase | Targeted Validation Phase |
|---|---|---|
| Primary Goal | Generate hypotheses; identify differentially methylated regions (DMRs/CpGs) | Confirm biomarker performance in independent cohorts |
| Typical Assay | Whole-Genome Bisulfite Sequencing (WGBS), Reduced Representation Bisulfite Sequencing (RRBS) | Targeted Bisulfite Sequencing, Pyrosequencing, Methylation-Specific PCR (MSP) |
| Coverage | Genome-wide (WGBS) or CpG-rich regions (RRBS) | Specific CpG sites or regions (e.g., 5-50 amplicons) |
| Sample Size | Moderate (n=3-12 per group) for discovery | Large (n=50-500+) for statistical power |
| Statistical Focus | Multiple testing correction (FDR), DMR detection | Sensitivity/Specificity, AUC-ROC, Predictive Modeling |
| Output | List of candidate biomarkers with p-values & effect size | Clinically actionable biomarker panel with validated cut-offs |
Detailed Experimental Protocols
Objective: To identify differential methylation between case/control samples in CpG islands and promoters.
- DNA Quality Control: Assess DNA integrity (Agilent Bioanalyzer). Use 10-100ng of high-quality genomic DNA.
- Restriction Digestion: Digest DNA with MspI (CpG methylation-insensitive) at 37°C for 4 hours.
- End-Repair & A-Tailing: Prepare fragments for adapter ligation.
- Adapter Ligation: Ligate methylated sequencing adapters to size-selected fragments (40-220 bp).
- Bisulfite Conversion: Treat ligated DNA with sodium bisulfite (EpiTect Fast, Qiagen) to convert unmethylated cytosines to uracil.
- PCR Amplification: Amplify libraries using hot-start polymerase. Index samples for multiplexing.
- Library QC & Sequencing: Validate library size distribution (Bioanalyzer) and quantify. Sequence on Illumina platform (≥10M reads/sample).
- Bioinformatics: Align reads (e.g., Bismark, BSMAP) to bisulfite-converted reference genome. Extract methylation calls. Perform differential analysis (e.g., methylKit, DSS).
Objective: To quantitatively validate methylation levels at specific CpG sites in an expanded cohort.
- Primer Design: Design PCR primers (one biotinylated) flanking the target CpG site(s) identified from discovery. Verify specificity.
- Bisulfite Conversion: Convert 500ng sample DNA (EZ DNA Methylation-Gold Kit, Zymo Research).
- PCR Amplification: Perform PCR using bisulfite-converted DNA as template.
- Pyrosequencing Preparation: Bind biotinylated PCR product to Streptavidin Sepharose beads. Denature and wash to isolate single-stranded template.
- Sequencing: Anneal sequencing primer to template. Load onto Pyrosequencer (Qiagen). Dispense nucleotides (dNTPs) sequentially; measure light emission (PPi release) upon incorporation.
- Quantitative Analysis: Software (PyroMark Q24) generates methylation percentage per CpG site from the integration peak heights (C vs. T).
Visualizations
Title: DNA Methylation Analysis Workflow: Discovery to Validation
Title: Key Steps in RRBS Discovery and Pyrosequencing Validation
The Scientist's Toolkit: Research Reagent Solutions
Table 2: Essential Reagents & Kits for Methylation Workflows
| Item Name | Supplier Examples | Function in Workflow |
|---|---|---|
| NEBNext RRBS Kit | New England Biolabs | All-in-one solution for RRBS library prep, including digestion, adapters, and size selection buffers. |
| EpiTect Fast DNA Bisulfite Kit | Qiagen | Rapid conversion of unmethylated cytosine to uracil for NGS-based discovery assays. |
| EZ DNA Methylation-Gold Kit | Zymo Research | Robust bisulfite conversion optimized for challenging samples (e.g., FFPE) and targeted assays. |
| PyroMark PCR Kit | Qiagen | Includes optimized reagents for PCR amplification of bisulfite-converted DNA prior to pyrosequencing. |
| PyroMark Q24 Advanced CpG Reagents | Qiagen | Contains enzymes, substrate, and nucleotides specifically formulated for quantitative CpG methylation analysis. |
| Methylated & Unmethylated Control DNA | Zymo Research, MilliporeSigma | Essential positive controls for bisulfite conversion efficiency and assay specificity in both phases. |
| Bismark Bisulfite Read Mapper | Open Source (Bioinformatics) | Aligns WGBS/RRBS reads to a reference genome and performs methylation extraction. |
| MethylSuite or SeSAMe Software | Commercial/Open Source | Integrated platforms for statistical analysis and visualization of differential methylation in discovery. |
Essential Computational Resources and Infrastructure for Methylation Analysis
Within a comprehensive DNA methylation data analysis workflow for Whole-Genome Bisulfite Sequencing (WGBS) and Reduced Representation Bisulfite Sequencing (RRBS), robust computational infrastructure is not an auxiliary component but a foundational requirement. The volume and complexity of bisulfite-converted sequencing data demand specialized resources for storage, processing, and analysis. This application note details the essential hardware, software, and data management components required to establish an efficient pipeline for methylation research and drug development applications.
Core Computational Infrastructure Requirements
The following table summarizes the quantitative hardware specifications recommended for a mid-scale research group analyzing multiple WGBS/RRBS projects concurrently.
Table 1: Recommended Hardware Specifications for Methylation Analysis
| Component | Minimum Specification (Pilot Studies) | Recommended Specification (Production Scale) | Justification |
|---|---|---|---|
| CPU Cores | 16-32 cores | 64+ cores (High-frequency preferred) | Alignment and methylation calling are highly parallelizable tasks. |
| RAM | 64-128 GB | 512 GB - 1 TB+ | WGBS alignment of mammalian genomes requires significant memory (e.g., ~30-40GB for bismark genome index). Multiple simultaneous jobs increase demand. |
| Storage (Active) | 20-50 TB (fast SSD/NVMe) | 100-500 TB (High-speed network storage) | Raw FASTQ files are large (~50-100 GB per WGBS sample). Intermediate BAM files are 2-3x larger. Fast I/O reduces processing time. |
| Storage (Archive) | 100 TB (Cold/object storage) | 1 PB+ | Long-term archiving of raw and processed data for reproducibility and future meta-analysis. |
| Network | 1 GbE | 10 GbE or InfiniBand | Essential for efficient data transfer between compute nodes and storage servers. |
Essential Software Stack & Data Management
A standardized software environment ensures reproducibility. Containerization (Docker/Singularity) is highly recommended.
Table 2: Core Software Tools for WGBS/RRBS Analysis
| Category | Tool Name(s) | Primary Function | Key Protocol Consideration |
|---|---|---|---|
| Alignment & Calling | Bismark, BS-Seeker2, BWA-meth | Maps bisulfite-converted reads and extracts methylation calls. | Standard Protocol: 1. Genome preparation (bismark_genome_preparation). 2. Read alignment with alignment score thresholds. 3. Deduplication. 4. Methylation extraction with bismark_methylation_extractor (reporting --CX_context). |
| Quality Control | FastQC, MultiQC, qualimap, MethyQA | Assesses raw and aligned read quality, coverage distribution, and bisulfite conversion efficiency. | Run FastQC on raw FASTQs. Use bismark2report for alignment metrics. Aggregate all QC results with MultiQC for cohort-level assessment. |
| Differential Analysis | MethylKit, DSS, R/Bioconductor (limma), SeSAMe | Identifies differentially methylated regions (DMRs) or CpGs (DMCs). | Protocol: Filter loci by coverage (e.g., >=10x). Normalize coverage. Perform statistical testing (e.g., logistic regression in MethylKit) with false discovery rate (FDR) correction. Annotate DMRs to genomic features. |
| Visualization | IGV, deepTools, Gviz, ComMet | Visualizes methylation tracks, coverage, and DMRs in genomic context. | Generate bigWig files for methylation percentage (using bismark2bedGraph and bedGraphToBigWig) for browser loading. |
| Workflow Management | Nextflow, Snakemake, CWL | Orchestrates complex, multi-step pipelines, ensuring portability and reproducibility. | Encapsulate each tool in a container. Define workflow from FASTQ to DMRs, allowing for easy restart and scaling. |
The Scientist's Toolkit: Research Reagent Solutions
Table 3: Essential Materials for Methylation Sequencing & Analysis
| Item | Function in Workflow |
|---|---|
| Bisulfite Conversion Kit (e.g., EZ DNA Methylation kits) | Chemically converts unmethylated cytosines to uracils while leaving 5-methylcytosines intact, forming the basis of the sequencing signal. |
| High-Fidelity DNA Polymerase (e.g., PfuTurbo Cx Hotstart) | PCR amplification post-bisulfite conversion requires polymerases insensitive to uracil residues to avoid bias. |
| Methylated & Non-Methylated Control DNA | Spike-in controls to empirically measure and validate bisulfite conversion efficiency (>99%). |
| Library Preparation Kit for Bisulfite-Seq | Optimized reagents for end-repair, adapter ligation, and size selection of bisulfite-converted DNA. |
| UMI (Unique Molecular Identifier) Adapters | Allows for precise PCR duplicate removal during bioinformatics analysis, critical for accurate quantification. |
| Reference Genome & Annotation Files | Includes bisulfite-converted reference genomes (C->T and G->A converted) and files (GTF/BED) for annotating CpG sites/regions. |
Detailed Experimental & Computational Protocol
Protocol: Differential Methylation Analysis from Raw WGBS/RRBS Data
A. Pre-processing & Alignment (Command-line protocol):
- Quality Control:
fastqc sample.fastq.gz -o ./qc_report/ - Adapter Trimming: Use
trim_galore --paired --rrbs sample_1.fastq sample_2.fastq(automates adapter trim and quality cut for RRBS). - Bismark Genome Preparation:
bismark_genome_preparation --path_to_bowtie2 /path/ --verbose /path/to/genome/folder/ - Bismark Alignment:
bismark --genome /path/to/genome -1 sample_1_val_1.fq -2 sample_2_val_2.fq --parallel 8 -o ./alignment/ - Deduplication:
deduplicate_bismark -p --bam sample_1_val_1_bismark_bt2_pe.bam - Methylation Extraction:
bismark_methylation_extractor -p --gzip --bedGraph --CX_context --parallel 8 sample_1_val_1_bismark_bt2_pe.deduplicated.bam
B. Differential Analysis (R Protocol using MethylKit):
Visualized Workflows
WGBS/RRBS Analysis Pipeline
Methylation Thesis Workflow Context
The Step-by-Step Bioinformatics Pipeline: From FASTQ Files to Differential Methylation Calls
Initial Quality Control and Adapter Trimming of Bisulfite-Sequenced Reads
Within the comprehensive workflow for Whole-Genome Bisulfite Sequencing (WGBS) and Reduced Representation Bisulfite Sequencing (RRBS) data analysis, the initial processing of raw sequencing reads is a critical determinant of downstream accuracy. This step ensures data integrity before alignment and methylation calling, directly impacting the reliability of epigenetic insights relevant to disease research and drug development.
Application Notes: Purpose and Impact
The bisulfite conversion process, which deaminates unmethylated cytosines to uracils (read as thymines), introduces specific challenges for read quality and adapter content:
- Sequence Complexity Reduction: The conversion of most cytosines to thymines reduces sequence complexity, complicating quality assessment and adapter detection using standard DNA-seq tools.
- Adapter Dimer Enrichment: The efficient conversion and amplification of short, adapter-ligated fragments can lead to a higher proportion of adapter-dimers in the final library.
- Quality Score Interpretation: Standard base quality scores may not accurately reflect errors introduced during bisulfite conversion or PCR amplification post-conversion.
Failure to perform stringent initial QC and adapter trimming results in poor alignment rates, increased analytical noise, and potential biases in methylation quantification.
Detailed Experimental Protocols
Protocol: Initial Quality Assessment of Raw Bisulfite-Sequenced Reads
Objective: To evaluate the per-base sequence quality, adapter contamination, and nucleotide composition of raw FASTQ files.
Materials: Raw paired-end or single-end FASTQ files from WGBS/RRBS.
Software: FastQC (v0.12.1) is recommended for initial assessment.
Method:
- Run FastQC: Execute FastQC on all raw FASTQ files.
- Interpret Reports: Critically examine key modules:
- Per Base Sequence Quality: Ensure median Phred scores are >30 across all cycles. A drop at read ends is common.
- Adapter Content: Check for the presence of standard Illumina adapter sequences (e.g., TruSeq).
- Per Base N Content: Confirm N calls are <5% at any position.
- Sequence Duplication Levels: Note the level but expect high duplication in RRBS due to genomic reduction.
- Per Base Sequence Content: Expect a strong shift from roughly equal GC distribution to very low C and high T content post-bisulfite conversion.
Protocol: Adapter and Quality Trimming for Bisulfite-Sequenced Reads
Objective: To remove adapter sequences, low-quality bases, and poor-quality reads while accounting for bisulfite-converted sequences.
Materials: Raw FASTQ files, adapter sequence files.
Software: Trim Galore! (v0.6.10), which wraps Cutadapt and FastQC, is specifically designed for bisulfite-seq data.
Method:
- Run Trim Galore! Execute with parameters suitable for your library type.
- For Standard WGBS (paired-end):
- For Standard WGBS (paired-end):
- Post-trimming QC: Review the new FastQC reports generated by Trim Galore! in the output directory to confirm improved adapter content and per-base quality.
Data Presentation
Table 1: Key Quality Metrics Pre- and Post-Trimming (Representative WGBS Data)
| Metric | Raw Data (Pre-Trim) | Trimmed Data (Post-Trim) | Acceptable Threshold |
|---|---|---|---|
| Total Read Pairs | 50,000,000 | 45,200,000 | N/A |
| % Reads with Adapters | 8.5% | 0.2% | < 1% |
| Mean Per-Base Quality (Phred) | 33 | 35 | ≥ 30 |
| % Bases with N | 0.05% | 0.01% | < 2% |
| Mean Read Length (bp) | 150 | 135 (after clipping) | ≥ 30 |
| % Reads Retained | 100% | 90.4% | > 70% |
Table 2: Comparison of Trimming Tools for Bisulfite-Seq Data
| Feature / Tool | Trim Galore! | Cutadapt (direct) | Trimmomatic |
|---|---|---|---|
| Bisulfite-Seq Mode | Yes (automatic C->T/G->A adjustment) | No (requires user specification) | No |
| RRBS-Specific Trimming | Yes (--rrbs flag) |
No | No |
| Dual Function | Trimming + Post-trim QC | Trimming only | Trimming only |
| Ease of Use | High | Medium | Medium |
| Typical Use Case | Default for WGBS/RRBS | Custom adapter removal | General-purpose trimming |
Visualization
Diagram 1: QC and trimming workflow for bisulfite-seq reads.
Diagram 2: Bisulfite conversion chemistry and adapter challenge.
The Scientist's Toolkit
Table 3: Essential Research Reagent Solutions for WGBS/RRBS Library QC & Trimming
| Item | Function & Relevance | Example Product/Kit |
|---|---|---|
| High-Sensitivity DNA Assay Kit | Accurate quantification of low-input, adapter-ligated bisulfite-converted libraries prior to sequencing. Critical for pooling. | Agilent Bioanalyzer HS DNA Kit, Qubit dsDNA HS Assay |
| Methylation-Non-Bias PCR Enzymes | Amplification of bisulfite-converted DNA without introducing sequence-specific bias or affecting uracil templates. | KAPA HiFi Uracil+ (Roche), Pfu Turbo Cx (Agilent) |
| Dual-Indexed Adapter Kits | Allows multiplexing of samples. Trimming tools require knowledge of adapter sequences for precise removal. | IDT for Illumina - DNA/RNA UD Indexes, TruSeq DNA UD Indexes |
| Bisulfite Conversion Control DNA | Unmethylated and methylated spike-in controls to monitor the efficiency of the bisulfite conversion process wet-lab step. | Zymo Research EZ DNA Methylation-Lightning Spike-in |
| Size Selection Beads | Critical for RRBS to isolate the desired fragment range (e.g., 40-220 bp post-MspI digest) and for final library clean-up. | SPRISelect / AMPure XP Beads (Beckman Coulter) |
| Qubit Assay Tubes | Low-binding tubes recommended for accurate quantification of precious, low-concentration bisulfite libraries. | Qubit Assay Tubes (Invitrogen) |
In whole-genome bisulfite sequencing (WGBS) and reduced representation bisulfite sequencing (RRBS) workflows, accurate alignment of bisulfite-converted reads is a critical computational challenge. Bisulfite treatment converts unmethylated cytosines (C) to uracil (and subsequently to thymine (T) during PCR), while methylated cytosines remain as cytosines. This creates three possible alignments for each read: to the original top strand, to the original bottom strand, and to their bisulfite-converted counterparts. Aligners employ two principal strategies to address this:
- Three-Letter Alignment: The aligner reduces the genomic sequence and reads to a three-letter alphabet (C's are converted to T's for the forward strand, and G's are converted to A's for the reverse strand). This allows standard alignment algorithms to be used but requires four parallel alignments (top/bottom strand, original/converted).
- Wild-Card Alignment: The aligner treats the C-to-T conversion as a wild-card during the mapping process, typically by allowing a C in the read to align to either a C or a T in the reference genome at specific positions (CpG contexts). This is often more computationally efficient.
The choice of aligner and strategy significantly impacts mapping efficiency, speed, and accuracy, influencing downstream methylation calling.
Comparative Analysis of Aligners
The following table summarizes the key quantitative and qualitative characteristics of three widely used bisulfite read aligners, as per current benchmarks and documentation.
Table 1: Comparison of Bisulfite-Sequence Aligners
| Feature | Bismark | BS-Seeker2 | BSMAP |
|---|---|---|---|
| Core Algorithm | Bowtie 2 or HISAT2 | Bowtie 2 | SOAPaligner / GMAP |
| Alignment Strategy | Three-Letter | Three-Letter & Wild-Card (optional) | Wild-Card |
| Typical Mapping Efficiency | 65-80% | 70-75% | 70-85% |
| Speed | Moderate | Moderate to Fast (with wild-card) | Fast |
| Memory Usage | Moderate | Moderate | Low-Moderate |
| Key Strength | High accuracy, comprehensive output, extensive QC reports, active development. | Flexibility in strategy, good for large genomes, supports single-end and paired-end. | Very fast, high sensitivity, handles variable read lengths well. |
| Potential Limitation | Can be slower for large datasets. | Setup and index building can be complex. | May have slightly higher false alignment rate in repetitive regions. |
| Primary Citation | Krueger & Andrews, 2011 | Guo et al., 2013 | Xi & Li, 2009 |
| Recommended Use Case | Standard WGBS/RRBS where accuracy and detailed reporting are paramount. | Large-scale projects or when comparing alignment strategies. | Rapid screening, very large datasets, or resource-limited environments. |
Detailed Experimental Protocols
Protocol 3.1: Standard Bisulfite Read Alignment Workflow Using Bismark
Objective: To align bisulfite-converted sequencing reads (WGBS/RRBS) to a reference genome and perform initial methylation extraction.
Materials:
- Computing server (Unix/Linux) with ≥ 16GB RAM and multiple cores.
- Raw FASTQ files (gzip-compressed).
- Reference genome (FASTA format).
- Bismark software suite (v0.24.0+) installed.
- Bowtie 2 or HISAT2 installed.
Procedure:
- Genome Preparation: Prepare a bisulfite-converted version of the reference genome.
Read Alignment: Align the reads. Use
--non_directionalfor non-directional RRBS/WGBS libraries.Key parameters:
-p(threads),--bowtie2(use Bowtie2 engine),--non_directional(for standard protocols).Deduplication: Remove PCR duplicates. This step is optional but recommended for WGBS.
Methylation Extraction: Generate the context-specific (CpG, CHG, CHH) methylation reports.
Generate HTML Report: Bismark generates a summary HTML report (
sample_R1_bismark_bt2_PE_report.html) with alignment statistics and methylation bias plots.
Protocol 3.2: Alignment with BSMAP for Rapid Processing
Objective: To achieve fast alignment of bisulfite-converted reads using the wild-card method.
Materials:
- Computing server with BSMAP installed (v2.90+).
- Reference genome indexed for BSMAP (
python bsmap.py -d genome.fa -w genome.fa.bsmap).
Procedure:
- Alignment: Map the reads with BSMAP. The
-wflag specifies wild-card alignment.
- Methylation Call (Using
methratio.py): Extract methylation ratios from the BAM file.
Visualized Workflows and Relationships
Title: Decision Workflow for Choosing a Bisulfite Aligner
Title: Technical Comparison of Bisulfite Alignment Strategies
Table 2: Key Reagents and Computational Tools for Bisulfite-Seq Alignment
| Item | Category | Function in Workflow |
|---|---|---|
| Sodium Bisulfite | Wet-Lab Reagent | Chemical agent that converts unmethylated cytosines to uracil, forming the basis of the sequencing signal. |
| Methylated & Unmethylated Control DNA | Wet-Lab QC | Spike-in controls to assess the efficiency and bias of the bisulfite conversion process during library prep. |
| High-Fidelity DNA Polymerase | Wet-Lab Reagent | Used in post-bisulfite PCR amplification to minimize artificial sequence changes and maintain base representation. |
| Bismark Software Suite | Computational Tool | Integrates alignment (via Bowtie2/HISAT2), deduplication, methylation extraction, and comprehensive reporting. |
| BSMAP Aligner | Computational Tool | A fast, memory-efficient aligner using a wild-card algorithm, suitable for large genomes and datasets. |
| BS-Seeker2 Aligner | Computational Tool | A flexible aligner supporting both three-letter and wild-card strategies, built on Bowtie2. |
| MethylKit or DSS | Computational Tool | Downstream R/Bioconductor packages for differential methylation analysis from aligner output. |
| SAMtools/BEDTools | Computational Tool | Essential utilities for processing, filtering, indexing, and manipulating alignment (BAM) files. |
| Genome Reference Files | Data Resource | FASTA files and pre-built bisulfite-converted indices for the target organism (e.g., GRCh38, mm10). |
| High-Performance Computing (HPC) Cluster | Infrastructure | Provides the necessary CPU cores, RAM, and storage for processing large WGBS datasets efficiently. |
Within a comprehensive DNA methylation analysis workflow for Whole-Genome Bisulfite Sequencing (WGBS) and Reduced Representation Bisulfite Sequencing (RRBS) research, the steps of methylation extraction and calling are fundamental. This phase translates raw sequencing alignments (typically in BAM/SAM format) into quantifiable methylation metrics. The outputs, Beta values and CGmap files, serve as the primary data layers for downstream differential analysis, epigenome-wide association studies (EWAS), and biomarker discovery in drug development.
Core Concepts and Data Outputs
Beta (β) Value
The Beta value is the standard quantitative measure for methylation level at a single cytosine. It is calculated as:
β = M / (M + U + ε) where M is the number of reads supporting methylation (C for CpG context), U is the number of reads supporting unmethylation (T), and ε is a small constant (often 100) to stabilize low-coverage sites. Beta values range from 0 (completely unmethylated) to 1 (fully methylated).
CGmap File Format
The CGmap file is a standardized, genome-wide, base-resolution text file format that consolidates methylation information. Each line represents a single cytosine in any sequence context (CpG, CHG, CHH).
Table 1: Standard CGmap File Column Structure
| Column Order | Column Name | Description & Example |
|---|---|---|
| 1 | Chromosome | Chromosome/contig name (e.g., chr1). |
| 2 | Nucleotide | The base at this position (C or c). |
| 3 | Position | Genomic coordinate (1-based). |
| 4 | Context | Methylation context: CG, CHG, CHH. |
| 5 | Dinucleotide | The two-nucleotide sequence (e.g., CG). |
| 6 | Methylation Level (β) | Calculated Beta value (e.g., 0.875). |
| 7 | Methylated Reads Count (M) |
Count of reads showing methylation. |
| 8 | Total Reads Count (M+U) |
Total reads covering the site. |
| 9 | Strand | Orientation: + (forward) or - (reverse). |
Detailed Experimental Protocols
Protocol 3.1: Methylation Calling with Bismark & Deduplication
- Objective: Process aligned bisulfite sequencing reads to extract methylation calls, accounting for PCR duplicates.
- Input: Position-sorted BAM file from Bismark aligner.
- Software: Bismark (v0.24.0+), SAMtools.
Procedure:
Deduplication: Remove PCR duplicates from the aligned BAM file.
This generates
input_sorted.deduplicated.bam.Methylation Extraction: Run the methylation extractor on the deduplicated BAM file.
Generate Genome-Wide Cytosine Report: This step produces the key output.
The
*.CX_report.txtfile contains data equivalent to the CGmap format.
- Output:
*.CX_report.txtfile (akin to CGmap),*.bedGraphfile for browser visualization, and coverage files.
Protocol 3.2: Generating Beta Values and Standard CGmap Files from Bismark Output
- Objective: Convert Bismark's methylation extractor output into a standardized CGmap file and calculate Beta values.
- Input: Bismark
*.CX_report.txtfile. - Software: Custom scripting (e.g.,
awk,R,Python). Procedure using
awk:- The Bismark CX_report has columns:
<chromosome> <position> <strand> <count methylated> <count unmethylated> <context> <trinucleotide context>. - Use the following
awkcommand to transform it into a CGmap:
- The Bismark CX_report has columns:
Output: Standardized
sample_name.cgmapfile.
Protocol 3.3: Methylation Calling with methylKit (R Package)
- Objective: Perform methylation calling and directly obtain Beta values for downstream differential analysis in R.
- Input: Sorted BAM files and sample sheet.
- Software: methylKit (v1.26.0+), R.
Procedure:
Process BAM files: Specify locations, sample IDs, and experimental design.
Methylation Calling and Tabulation:
This function parses BAM files, calls methylation, and stores counts.
- Calculate and Access Beta Values:
Output:
meth.objcontaining read counts for all samples, andbeta.matrixof Beta values.
Diagrams of Workflows and Relationships
Title: WGBS/RRBS Methylation Calling Dataflow to Beta and CGmap
Title: From Sequencing Reads to Beta Value in CGmap
The Scientist's Toolkit: Research Reagent Solutions
Table 2: Essential Materials and Tools for Methylation Calling
| Item | Function & Relevance in Protocol |
|---|---|
| Bismark Bisulfite Mapper & Analyzer | Primary software suite for bisulfite-read alignment, deduplication, and methylation extraction. Executes Protocols 3.1 & 3.2. |
| SAMtools/BAMtools | Utilities for manipulating and indexing alignment (BAM/SAM) files, required for sorting and input preparation. |
| methylKit (R/Bioconductor) | R package designed for base-resolution methylation analysis. Streamlines methylation calling and Beta value calculation for statistical analysis (Protocol 3.3). |
| High-Performance Computing (HPC) Cluster | Essential for processing large WGBS BAM files, which require significant memory and multi-core CPU for efficient methylation extraction. |
| BSseeker2 or BSMAP | Alternative bisulfite sequencing alignment tools that generate input for custom methylation calling pipelines. |
| MethylDackel | Tool (often used with bwa-meth aligner) to extract methylation metrics from BAM files. Can generate bedGraph and strand-split VCF outputs. |
| Genome Reference Sequence (FASTA) | Bisulfite-converted reference genomes (e.g., Bisulfite_Genome/ from Bismark) are mandatory for alignment, preceding methylation calling. |
| R/Bioconductor or Python Environment | Necessary computational environment for running analysis packages, custom scripting for file format conversion, and statistical analysis. |
Whole-genome bisulfite sequencing (WGBS) and reduced representation bisulfite sequencing (RRBS) are cornerstone techniques in the broader thesis of DNA methylation data analysis. Following sequencing read alignment, a critical quality assessment (QA) step is required before biological interpretation. This step primarily evaluates two interconnected metrics: Bismark Conversion Efficiency and M-bias plots. Assessing bisulfite conversion efficiency ensures that unmethylated cytosines were successfully converted, validating the experiment's biochemical foundation. Concurrently, M-bias analysis examines positional methylation bias across read cycles, identifying potential technical artifacts introduced during library preparation, sequencing, or alignment that could confound downstream differential methylation analysis.
Core Quality Metrics: Definitions and Quantitative Benchmarks
Bisulfite Conversion Efficiency
This metric estimates the efficiency of the sodium bisulfite reaction in converting non-methylated cytosines (C) to thymines (T). It is calculated by examining methylation calls in a genomic context known to be unmethylated, such as the lambda phage genome (spiked into experiments) or chloroplast DNA (for plant studies).
Calculation: Conversion Efficiency = 1 - (mC / (mC + uC)) in the control genome, where mC is methylated C calls and uC is unmethylated C calls (or C reads at reference C positions).
Table 1: Benchmark Values for Bisulfite Conversion Efficiency
| Sample Type | Recommended Minimum Efficiency | Typical Optimal Range | Implied Issues if Lower |
|---|---|---|---|
| Mammalian WGBS/RRBS | 99% | 99.5% - 99.9% | Incomplete conversion leads to false-positive methylation calls. |
| Plant WGBS/RRBS | 98% | 99% - 99.8% | High endogenous methylation requires stringent control. |
| Low-Input/SCoWGBS | 97% | 98% - 99.5% | Degradation or incomplete reaction in limited material. |
M-Bias
M-bias refers to the deviation of observed cytosine methylation levels from the expected biological pattern as a function of the position within sequenced reads. Bias often manifests at the start (5-10bp) and sometimes the end of reads, caused by factors like random hexamer priming bias, end-repair, or PCR amplification.
Table 2: Common M-Bias Patterns and Interpretations
| Bias Pattern | Likely Technical Cause | Impact on Data | Recommended Action |
|---|---|---|---|
| High bias at read start (pos 1-6) | Random primer binding bias during library prep. | Inflated/deflated methylation calls at read beginnings. | Trim first few bases in alignment or post-processing. |
| Bias throughout read | Degraded DNA or poor bisulfite conversion uniformity. | Systemic error across all loci. | Inspect DNA quality and conversion efficiency metrics. |
| Bias at read end | Sequencing cycle-dependent errors or adapter contamination. | Artifactual methylation at fragment ends. | Trim read ends; improve adapter trimming. |
| Strand-specific bias (CpG) | Differential handling of Watson vs. Crick strands during prep. | Strand-specific analytical errors. | Analyze strands separately; review protocol. |
Detailed Protocols for Post-Alignment QA
Protocol 3.1: Generating Conversion Efficiency and M-Bias Reports with Bismark
This protocol assumes alignment of WGBS/RRBS data has been completed using the Bismark suite.
I. Materials & Software
- Computing Environment: Unix/Linux server or high-performance computing cluster.
- Software:
- Bismark (v0.24.0+)
- Samtools (v1.15+)
- R (v4.2+) with ggplot2, data.table libraries for visualization.
- Input Data: Coordinate-sorted BAM file from Bismark aligner (
*_bismark_bt2.bam). - Reference Genomes: Primary organism genome and control genome (e.g., lambda, phiX).
II. Stepwise Procedure
- Prepare the Control Genome Index: If not done, build a Bismark index for the lambda phage genome.
Extract Methylation Calls: Run
bismark_methylation_extractoron the sorted BAM file. The--comprehensiveand--bedGraphflags are recommended.Calculate Conversion Efficiency: Use the spiked-in control alignment or the
CHHcontext in chloroplast/λ DNA. The efficiency is typically derived from theCpGcontext in the lambda genome.- Method A (From Bismark Report): The
bismark2reporttool generates an HTML summary. The conversion efficiency is calculated as:% C-to-T conversion = 100% - % methylated C in lambda. - Method B (Manual from Coverage File): Process the
*.bismark.cov.gzfile for the lambda genome.
- Method A (From Bismark Report): The
Generate M-Bias Plots: The
bismark2summarytool, when run on multiple samples, creates aggregate M-bias plots. For a single sample, use the--splitting_reportgenerated bybismark_methylation_extractoror thebismark2reportoutput. The key file issample_bismark_bt2.splitting_report.txt, which contains per-position methylation data for each read strand (OT, OB, CTOT, CTOB).- Visualization in R: Import the splitting report data into R to create custom M-bias plots.
III. Expected Output & Analysis
- HTML Report: Contains a summary table with conversion efficiency.
- M-Bias Plots: Line graphs for CpG, CHG, and CHH contexts across all read positions (1-Read Length).
- Decision Point: If conversion efficiency is <99% (mammalian) or significant M-bias exists (>10% deviation from plateau in first/last 5bp), consider trimming reads and re-aligning or noting the bias for downstream analysis.
Protocol 3.2: Independent Verification using MethylKit (R Package)
This protocol provides an alternative R-based method for M-bias visualization and filtering.
I. Materials & Software
- Software: R (v4.2+) with
methylKit,GenomicAlignmentspackages. - Input Data: Sorted BAM file and its index (
*.bai).
II. Stepwise Procedure
- Read BAM File into R: Use
processBismarkAlnfunction to read methylation calls.
- Generate M-Bias Plot: The
getMethylationStatsfunction can assess per-base statistics. For detailed positional bias, use thefilterByCoveragefunction with alo.countandhi.percargument, but for visualization, plot the raw percent methylation per read position from the raw data. - Filter Reads Based on Bias: MethylKit allows filtering based on coverage and percentile, which can indirectly remove positions with extreme bias.
III. Expected Output
- R Plot: A graphical representation of methylation percentage across read cycles.
- Filtered methylKit object: Ready for further differential methylation analysis.
Visualization of Post-Alignment QA Workflow
Title: Post-Alignment Quality Assessment Workflow for WGBS/RRBS
The Scientist's Toolkit: Essential Reagents and Materials
Table 3: Key Research Reagent Solutions for Bisulfite Conversion QA
| Item Name | Supplier Examples | Function in QA Process | Critical Notes |
|---|---|---|---|
| Lambda Phage DNA | Thermo Fisher, NEB, Promega | Unmethylated control genome spiked into sample pre-conversion. | Provides a gold-standard baseline for calculating bisulfite conversion efficiency. |
| CpG Methyltransferase (M.SssI) | NEB, Thermo Fisher | Creates fully methylated control DNA for assay validation. | Used to test the upper detection limit and specificity of the sequencing protocol. |
| High-Fidelity DNA Polymerase | KAPA Biosystems, NEB, Qiagen | Used in post-bisulfite library amplification steps. | Minimizes PCR bias, which can contribute to M-bias patterns. |
| Bisulfite Conversion Kit | Zymo Research, Qiagen, Thermo Fisher | Chemically converts unmethylated cytosine to uracil. | Kit efficiency and consistency are paramount; directly impacts primary QA metric. |
| Size Selection Beads | Beckman Coulter, Omega Bio-tek | Cleanup after bisulfite conversion and library amplification. | Inconsistent size selection can skew coverage and introduce end-of-read bias. |
| Methylation-Aware Aligner Software (Bismark, BSMAP) | Open Source, GitHub | Maps bisulfite-converted reads to reference genome. | Proper alignment parameters are crucial to avoid misalignment that creates false M-bias. |
| QA Visualization Tools (MethylKit, deepTools) | Open Source, Bioconductor | Generates M-bias plots and other diagnostic graphs. | Enables visual detection of positional and strand-specific artifacts. |
Statistical Detection of Differentially Methylated Positions (DMPs) and Regions (DMRs)
Within the comprehensive workflow of DNA methylation data analysis for Whole-Genome Bisulfite Sequencing (WGBS) and Reduced Representation Bisulfite Sequencing (RRBS), a critical step is the identification of genomic loci exhibiting statistically significant methylation differences between conditions. This process is categorized into the detection of single Differentially Methylated Positions (DMPs) and the aggregation of spatially correlated DMPs into Differentially Methylated Regions (DMRs). This application note details current protocols and considerations for robust statistical detection in research and drug development contexts.
Core Statistical Concepts and Quantitative Comparisons
Table 1: Common Statistical Models for DMP Detection
| Model/Test | Data Type Required | Key Assumptions | Strengths | Weaknesses | Common Software |
|---|---|---|---|---|---|
| Beta-binomial | Counts (Methylated/Total reads) | Accounts for biological and technical variability via overdispersion. | Highly appropriate for sequencing count data; models variability well. | Computationally intensive for whole genome. | DSS, methylKit, BiSeq |
| t-test / Wilcoxon | Methylation proportion (M-value, Beta-value) | Normally distributed residuals (t-test) or non-parametric. | Simple, fast for preliminary analysis. | Often violates assumptions of independence and variance; ignores read depth. | minfi, in-house R scripts |
| Linear Modeling (e.g., limma) | M-values (logit transformed) | Homoscedasticity, linearity. | Powerful for complex designs (multiple factors, covariates); uses empirical Bayes moderation. | Transformation may not fully stabilize variance for low-coverage sites. | limma, missMethyl |
| Non-parametric Smoothing | Counts or proportions | Spatial correlation along genome. | Leverages spatial information for sensitivity. | Can be sensitive to smoothing parameters. | BSmooth, DSS (with smoothing) |
Table 2: DMR Detection Methods & Characteristics
| Method | Underlying Principle | Input | Key Parameter(s) | Output Type |
|---|---|---|---|---|
Bump Hunting (e.g., minfi's dmrcate) |
Identify clusters of DMPs exceeding a cutoff. | p-values & effect sizes from DMP analysis. | Kernel bandwidth, significance cutoff. | Regions defined by probe clusters. |
| Smoothing-based (e.g., BSmooth, DSS-smoothing) | Fit smoothing splines to methylation levels across samples, then test for differences. | Raw read counts or coverage. | Smoothing window size, minimum coverage. | Regions of contiguous differential methylation. |
| Segmentation-based (e.g., methylSeekR) | Segment genome into homogeneously methylated blocks, then compare segments. | Methylation levels per CpG. | Segmentation algorithm parameters. | Homogeneous methylation segments. |
| Combined Modeling (e.g., DMRcate, HMM-DM) | Jointly model methylation and spatial dependence in a single statistical framework. | Raw counts or summarized data. | Model-specific priors and thresholds. | Probability-based DMR calls. |
Detailed Protocols
Protocol 1: DMP Detection Using DSS for WGBS/RRBS Data
Objective: Identify individual CpG sites with significant methylation differences between two groups using the beta-binomial model in the R package DSS.
Reagents & Input:
- Aligned Bisulfite-Seq Data: SAM/BAM files from aligners like Bismark or BS-Seeker2.
- Sample Sheet: CSV file detailing sample IDs, group labels (e.g., Control vs. Treatment), and any covariates.
- DSS R Package: Installed from Bioconductor.
Procedure:
- Data Parsing: Use
DSS::read.BSseqto parse BAM files and create aBSseqobject. This step summarizes methylated and total read counts for each CpG in each sample. - Coverage Filtering: Filter CpG sites to retain only those with a minimum coverage (e.g., ≥5x) in all samples or a minimum number of samples per group to ensure statistical reliability.
- Statistical Testing:
- Define the design matrix using the
model.matrixfunction in R, specifying the group variable. - Execute
DSS::DMLtestfunction on the filteredBSseqobject. This function fits a beta-binomial regression for each CpG and performs a Wald test for differential methylation. - The function estimates mean methylation levels, differences, and test statistics (p-values, FDR) for each CpG.
- Define the design matrix using the
- Result Extraction & Thresholding: Call
DSS::callDMLto extract a list of DMPs by applying thresholds (e.g.,delta = 0.1for minimum methylation difference,p.threshold = 0.001). - Output: A data frame with columns for genomic coordinates, group methylation means, difference, p-value, and FDR (adjusted p-value).
Protocol 2: DMR Detection from DMPs Using DMRcate
Objective: Aggregate significant DMPs into robust DMRs using a kernel-based smoothing approach.
Procedure:
- Prerequisite: A table of DMP results (from
limma,DSS, etc.) containing chromosome, position, p-value, and methylation difference (effect size). - Preparation in R: Load the
DMRcatepackage and format your DMP results into aDataFrameobject with appropriate column names. - DMR Calling: Use the
dmrcatefunction. Key parameters:lambda: The Gaussian kernel bandwidth for smoothing (e.g., 1000 nucleotides). Larger values merge DMPs across larger genomic distances.C: Scaling factor for kernel bandwidth. Adjusts sensitivity.pcutoff: The p-value cutoff to use (typically use FDR, e.g., 0.05).- Specify the genome assembly (
hg19,hg38,mm10, etc.).
- Post-processing: The function returns a list of candidate DMRs. Extract and sort them by significance (FDR). Filter DMRs based on a minimum number of CpGs (e.g., ≥3) and absolute mean methylation difference (e.g., ≥10%).
- Annotation & Visualization: Use
extractRangesfromDMRcateto get genomic ranges and annotate with nearest genes using packages likeannotatrorChIPseeker. Visualize usingDMRcate::DMR.plot.
The Scientist's Toolkit: Research Reagent Solutions
Table 3: Essential Materials for DMP/DMR Analysis Workflow
| Item | Function in Workflow | Example/Note |
|---|---|---|
| Bisulfite Conversion Kit | Converts unmethylated cytosines to uracil, enabling methylation-specific sequencing. | EZ DNA Methylation-Gold Kit (Zymo Research), MethylCode Bisulfite Conversion Kit (Thermo Fisher). |
| WGBS or RRBS Library Prep Kit | Prepares sequencing libraries from bisulfite-converted DNA, with size selection and adapter ligation optimized for bisulfite sequencing. | Accel-NGS Methyl-Seq DNA Library Kit (Swift Biosciences), NEBNext Enzymatic Methyl-seq Kit (NEB). |
| High-Fidelity Bisulfite-Aware Aligner | Maps bisulfite-converted reads to a reference genome, accounting for C-to-T conversion. | Bismark (Bowtie2/Hisat2 backend), BS-Seeker2. Essential for accurate read counting per CpG. |
| Methylation Data Analysis Suite | Software environment for statistical testing, visualization, and annotation. | R/Bioconductor (with packages DSS, methylKit, minfi, bsseq, DMRcate). |
| High-Performance Computing (HPC) Resource | Provides the computational power required for whole-genome alignment and statistical testing across millions of CpGs. | Local cluster or cloud computing (AWS, Google Cloud). |
| Genome Annotation Database | Provides genomic context (promoters, enhancers, gene bodies) for interpreting DMP/DMR biological relevance. | annotatr R package, UCSC Genome Browser tables, Ensembl via biomaRt. |
Visualized Workflows
Statistical Analysis Workflow for DMPs and DMRs
Method Selection Logic for Differential Methylation
Within a comprehensive DNA methylation analysis workflow (WGBS/RRBS), the identification of Differentially Methylated Regions (DMRs) is an intermediate step. The critical subsequent phase is functional annotation, which transforms statistical loci into biologically interpretable hypotheses. This protocol details methods to link DMRs to genomic features (genes, promoters), predict functional impact, and perform pathway enrichment analysis, ultimately guiding validation experiments and mechanistic studies in drug development and basic research.
Key Research Reagent Solutions and Materials
Table 1: Essential Toolkit for Functional Annotation of DMRs
| Item | Function / Explanation |
|---|---|
| Reference Genome Assembly (e.g., GRCh38/hg38) | Essential coordinate system for mapping DMRs to genomic features. |
| Genomic Annotation File (e.g., GTF/GFF from GENCODE) | Contains coordinates of genes, exons, promoters, CpG islands, and other features for overlap analysis. |
Bioinformatics Software (e.g., R/Bioconductor packages: GenomicRanges, ChIPseeker, annotatr) |
Tools for performing efficient genomic range overlaps and annotation. |
| Pathway Database (e.g., KEGG, Reactome, GO) | Curated collections of biological pathways and terms for enrichment analysis. |
Methylation-Aware Analysis Tools (e.g., MethyKit, DSS, GREAT) |
Specialized software that incorporates genomic context and regulatory elements for DMR interpretation. |
| High-Performance Computing (HPC) Cluster | Necessary for handling large WGBS datasets and running intensive genome-wide scans. |
Protocol: Annotating DMRs to Genes and Promoters
Objective: To assign DMRs to proximal genes and regulatory regions.
Input: A BED file of DMR coordinates (Chromosome, Start, End, p-value, methylation difference).
Materials: See Table 1.
Procedure:
- Data Preparation: Load DMR coordinates into a genomic ranges object in R using
GenomicRangesorrtracklayer. - Load Annotations: Import a high-quality gene annotation file (e.g., from GENCODE) for your reference genome.
- Define Promoter Regions: Programmatically define promoters as regions spanning, for example, from -2000 bp to +500 bp relative to Transcription Start Sites (TSS).
- Perform Overlap Analysis: Use the
findOverlapsorsubsetByOverlapsfunctions to identify DMRs that intersect with:- Gene bodies (including introns and exons).
- Promoter regions (as defined in Step 3).
- CpG islands and shores.
- Assign and Categorize: For each DMR, assign the nearest TSS and gene symbol. Categorize DMRs based on genomic context (e.g., Promoter, Intragenic, Intergenic, CpG Island).
- Output: Generate a summary table and visualization.
Table 2: Example Output of DMR Annotation (Hypothetical Data)
| DMR_ID | Genomic Location | Nearest Gene | Distance to TSS (bp) | Genomic Context | Avg. Δ Methylation |
|---|---|---|---|---|---|
| DMR_001 | chr5:1,200,500-1,201,000 | TERT | -1,500 | Promoter | -35% |
| DMR_002 | chr17:7,500,100-7,500,600 | TP53 | +50,000 | Intragenic | +20% |
| DMR_003 | chr10:75,300,400-75,301,000 | EGFR | -500 | Promoter/CpG Island | -40% |
Protocol: Pathway and Enrichment Analysis
Objective: To identify biological pathways and Gene Ontology (GO) terms significantly overrepresented among genes linked to DMRs.
Input: A list of unique gene symbols from the annotation protocol (Section 3).
Procedure:
- Background Definition: Prepare a background gene list containing all genes assayed in your experiment (e.g., all genes covered by your WGBS/RRBS data).
- Enrichment Test: Use tools like
clusterProfiler(R) or the web-based DAVID/GREAT to perform over-representation analysis against databases:- Gene Ontology (GO): Biological Process, Molecular Function, Cellular Component.
- Pathway Databases: KEGG, Reactome.
- Disease Databases: DisGeNET.
- Statistical Correction: Apply multiple testing correction (e.g., Benjamini-Hochberg) to the resulting p-values. Retain terms with an adjusted p-value (FDR) < 0.05.
- Interpretation: Focus on coherent, non-redundant pathways that align with the experimental phenotype.
Table 3: Example Output of Pathway Enrichment Analysis (Hypothetical Data)
| Pathway/Term (Source) | Gene Count | p-value | Adjusted p-value (FDR) | Genes |
|---|---|---|---|---|
| Ras signaling pathway (KEGG) | 12 | 2.5E-08 | 3.1E-06 | EGFR, KRAS, PIK3CA, ... |
| Cell adhesion molecules (KEGG) | 9 | 1.1E-05 | 6.8E-04 | CDH1, PECAM1, ... |
| Transcriptional misregulation in cancer (KEGG) | 10 | 3.3E-05 | 1.4E-03 | RUNX1, PML, TERT, ... |
| DNA-binding transcription activator activity (GO:MF) | 15 | 8.9E-07 | 2.2E-04 | TP53, MYC, JUN, ... |
Diagram 1: Workflow for DMR Annotation and Pathway Analysis
Diagram 2: Pathway of Promoter Hypermethylation Leading to Gene Silencing
Solving Common Pitfalls and Enhancing Robustness in Methylation Data Analysis
Addressing Incomplete Bisulfite Conversion and Its Impact on Methylation Calling
1. Introduction Within a comprehensive DNA methylation analysis workflow for WGBS and RRBS, incomplete bisulfite conversion (IBC) represents a critical technical artifact. True 5-methylcytosine (5mC) is resistant to bisulfite conversion, while unmethylated cytosines (C) are converted to uracil (U). Incomplete conversion results in residual unmethylated C that are misinterpreted as methylated C, leading to false-positive methylation calls and biased methylation estimates. This Application Note details protocols for monitoring, quantifying, and correcting for IBC.
2. Quantifying Incomplete Bisulfite Conversion IBC is typically assessed by spiking unmethylated lambda phage DNA or synthetic unmethylated oligonucleotides into the sample prior to conversion. Post-sequencing, the non-conversion rate is calculated as the proportion of reads retaining cytosine at known unmethylated positions.
Table 1: Common Spiked-in Controls for IBC Assessment
| Control Type | Source | Function | Optimal Non-Conversion Rate Threshold |
|---|---|---|---|
| Lambda DNA | E. coli bacteriophage λ | Provides genome-wide unmethylated C context for broad assessment. | <1.0% |
| Synthetic Oligos | Designed sequences | Contains specific CGs, CHGs, CHHs for context-specific monitoring. | <0.2% |
| ERCC Spike-ins | External RNA Controls Consortium | Complex mix for multiplexed experiments; requires prior validation for BS-seq. | Laboratory-defined |
3. Detailed Protocol: Assessing IBC with Lambda Phage DNA Materials: Genomic DNA sample, unmethylated Lambda phage DNA (e.g., Thermo Fisher, Cat #SD0011), bisulfite conversion kit (e.g., Zymo EZ DNA Methylation-Lightning Kit). Procedure:
- Spike-in: Spike 0.5-1.0% (by mass) of Lambda phage DNA into your purified genomic DNA sample.
- Bisulfite Conversion: Perform conversion according to your chosen kit’s protocol.
- Library Prep & Sequencing: Proceed with standard WGBS/RRBS library preparation and sequencing.
- Bioinformatic Analysis:*
a. Alignment: Map sequenced reads to a combined reference genome (e.g., hg38 + lambda genome).
b. Methylation Extraction: Use tools like
bismark_methylation_extractor(Bismark) orMethylDackelto call methylation. c. Calculation: For all cytosines in the lambda genome alignment, calculate: Non-conversion Rate = (Number of C reads) / (Number of C reads + Number of T reads). - Quality Threshold: Discard or flag samples where the average non-conversion rate exceeds 1.0%.
4. Impact on Methylation Calling and Correction Strategies IBC inflates observed methylation levels uniformly across all contexts if unaddressed. Correction involves subtracting the background non-conversion rate. Formula: Corrected β-value = (Observed β-value - λrate) / (1 - λrate), where λ_rate is the non-conversion rate from the spike-in control. This correction is applied per-context (CpG, CHG, CHH) using the respective non-conversion rate for that sequence context.
Diagram 1: Workflow for IBC Assessment & Data Correction
5. The Scientist's Toolkit: Research Reagent Solutions Table 2: Essential Materials for Managing Bisulfite Conversion Artifacts
| Item | Example Product | Function |
|---|---|---|
| Unmethylated Control DNA | Lambda Phage DNA (Thermo Fisher, SD0011) | Provides a baseline for genome-wide non-conversion rate calculation. |
| Bisulfite Conversion Kit | EZ DNA Methylation-Lightning Kit (Zymo Research, D5030) | Efficient, rapid conversion with optimized chemistry to minimize DNA degradation. |
| Methylation Spike-in Mix | SureSelect Methyl-Seq Spike-in (Agilent) | Includes both unmethylated and methylated controls for conversion efficiency and sensitivity monitoring. |
| High-Fidelity PCR Enzyme for BS-libs | KAPA HiFi Uracil+ (Roche) | Polymerase engineered to amplify bisulfite-converted (uracil-containing) templates with high fidelity. |
| Bioinformatics Tool | Bismark (Babraham Bioinformatics) | Aligner and methylation extractor designed specifically for bisulfite-seq data; calculates non-conversion rates from spike-ins. |
| Positive Control (in vitro methylated DNA) | CpGenome Universal Methylated DNA (MilliporeSigma, S7821) | Control for complete conversion efficiency (should show ~100% methylation post-conversion if no IBC). |
Managing Low-Coverage Regions and Optimizing Sequencing Depth for WGBS/RRBS
Within a comprehensive DNA methylation data analysis workflow for WGBS and RRBS research, a critical bottleneck is the generation of robust, quantitative data across the entire genome or targeted regions. This application note addresses two interconnected challenges: 1) The systematic management of genomic regions with low or zero sequencing coverage that lead to data loss and bias, and 2) The strategic optimization of sequencing depth to maximize cost-efficiency while ensuring statistical power for differential methylation detection. Effective resolution of these issues is paramount for downstream analyses, including biomarker discovery and epigenetic profiling in drug development.
Table 1: Recommended Minimum Sequencing Depth and Yield for WGBS & RRBS
| Application | Recommended Minimum Mean Depth (CpG site) | Typical Total Reads (WGBS) | Typical Total Reads (RRBS) | Key Rationale & Citation |
|---|---|---|---|---|
| Mammalian Whole-Genome (e.g., Human/Mouse) | 30x | 800M - 1.2B paired-end 100bp reads | 10M - 50M single-end/paired-end reads | Balances cost with power to detect methylation differences at ~10-20% Δβ. |
| Differential Methylation Screening | 15-20x | 400M - 600M reads | 5M - 20M reads | Minimally acceptable for identifying large-effect differential regions. |
| Single-Cell/Single-Nucleus WGBS | 5-10x (per cell) | 200M - 500M reads (multiplexed) | N/A | Very sparse coverage; analysis relies on aggregating profiles from cell populations. |
| High-Resolution Methylation Haplotyping | 50x+ | 1.5B+ reads | N/A | Required for phasing methylated alleles and detecting allele-specific methylation. |
Table 2: Impact of Sequencing Depth on Detectable Differential Methylation
| Mean CpG Depth | Minimum Detectable Methylation Difference (Δβ) at 80% Power | Approximate % of CpG Sites Covered ≥10x (Human WGBS) |
|---|---|---|
| 5x | > 35% | ~25-40% |
| 10x | ~25% | ~50-65% |
| 30x | ~10-15% | ~85-92% |
| 50x | ~5-10% | ~92-96% |
Experimental Protocols
Protocol 1: Pre-Sequencing Optimization for Library Preparation (Minimizing Low-Coverage Artifacts)
Aim: To reduce technical biases that create systematic low-coverage regions.
- Input DNA QC: Use high-integrity genomic DNA (Qubit, Bioanalyzer/Tapestation). Avoid fragmented or degraded DNA.
- Bisulfite Conversion: Use a high-efficiency, consistent kit (e.g., Zymo EZ DNA Methylation series). Include fully methylated and unmethylated controls to monitor conversion efficiency (>99%).
- WGBS-Specific Protocol:
- Use post-bisulfite adapter tagging (PBAT) or enzymatic conversion methods to reduce DNA loss.
- Employ spike-in controls (e.g., Lambda phage DNA) to assess overall library complexity and bias.
- RRBS-Specific Protocol:
- Optimize the restriction enzyme digestion (typically MspI) time and ratio to ensure complete cutting.
- Size selection is critical. Precisely gel-purify or bead-select the 150-400bp fraction (post-ligation) to capture CpG-rich regions.
- Amplification: Use low-cycle, high-fidelity PCR. Determine the minimum cycles required via qPCR to avoid over-amplification, which skews coverage.
Protocol 2: In-Silico Assessment and Masking of Low-Coverage Regions
Aim: To identify and manage regions unsuitable for analysis.
- Alignment & Processing: Map bisulfite-treated reads using dedicated tools (e.g., Bismark, BSMAP). Deduplicate reads.
- Coverage Calculation: Use
MethylDackel(from MethPipe) orbedtools genomecovto compute per-base coverage for all cytosines in CpG context. - Define Coverage Threshold: Apply a minimum coverage threshold (e.g., 10x) for downstream analysis. Create a BED file of all CpG sites below this threshold.
- Generate Low-Coverage Mask: Combine technical low-coverage regions with known problematic genomic regions (e.g., centromeres, telomeres, segmental duplications from UCSC Genome Browser). This composite mask is used to filter CpG sites before differential testing.
- Reporting: Calculate the percentage of CpGs genome-wide and in target regions (e.g., promoters, enhancers) falling below the threshold.
Protocol 3: Determining Optimal Sequencing Depth via Down-Sampling Analysis
Aim: To empirically determine sufficient depth for a given experiment type.
- Generate High-Depth Dataset: Sequence a pilot or representative sample to very high depth (e.g., 50x mean CpG coverage for WGBS).
- Random Sub-Sampling: Use
seqtkor SAMtools to randomly sub-sample the alignment file (BAM) to fractions of the total reads (e.g., 10%, 25%, 50%, 75%). - Methylation Calling & Analysis: Perform methylation extraction and analysis on each sub-sampled dataset.
- Saturation Curve Plotting: For each depth, plot:
- Total CpGs covered (at thresholds of 5x, 10x, 30x).
- Number of differentially methylated regions (DMRs) identified versus a control sample.
- Variance of beta values at high-coverage reference sites.
- Decision Point: Identify the depth where gains in CpG coverage and DMR discovery plateau. This is the cost-effective optimal depth for scaling the full study.
Visualization of Workflows & Relationships
Title: Workflow for Managing Coverage & Depth
The Scientist's Toolkit: Essential Research Reagents & Materials
Table 3: Key Reagents and Computational Tools for Coverage-Optimized WGBS/RRBS
| Item | Category | Function & Rationale |
|---|---|---|
| High-Efficiency Bisulfite Kit (e.g., Zymo EZ DNA Methylation) | Reagent | Ensures >99% C-to-T conversion of unmethylated cytosines, minimizing false positives and coverage bias. |
| MspI Restriction Enzyme | Reagent | Critical for RRBS. Precisely cuts at CCGG sites to enrich for CpG-rich genomic regions. |
| PCR-Free or Low-Input Library Prep Kits | Reagent | Reduces amplification bias and duplicates, improving coverage uniformity in WGBS. |
| Methylated/Unmethylated DNA Controls | Reagent | Spike-in standards to quantitatively monitor bisulfite conversion efficiency in every reaction. |
| Bismark / BSMAP | Software | Standard aligners for bisulfite-converted reads. Accurate mapping is foundational for coverage analysis. |
| MethylDackel / bedtools | Software | Extracts per-CpG methylation metrics and coverage from BAM files for thresholding and masking. |
| seqtk / SAMtools | Software | Performs random down-sampling of FASTQ or BAM files for sequencing depth saturation experiments. |
| DSS / methylSig / R Bioconductor | Software | Statistical packages that model coverage explicitly for differential methylation calling, improving power in low-coverage regions. |
Within the thesis framework of a WGBS/RRBS DNA methylation data analysis workflow, managing non-biological variation is paramount. Batch effects, stemming from processing time, reagent lot, personnel, or sequencing lane, can confound biological signals and lead to spurious conclusions. This document outlines practical protocols for diagnosing and correcting these technical artifacts.
Diagnosis and Quantification of Batch Effects
Protocol 1.1: Principal Component Analysis (PCA) for Batch Effect Visualization
- Objective: To visually assess the clustering of samples by technical rather than biological factors.
- Methodology:
- Input a matrix of methylation beta values or M-values (CpG sites x samples).
- Perform PCA using a singular value decomposition (SVD) algorithm on the centered (and optionally scaled) matrix.
- Generate scatter plots of the first 3-5 principal components (PCs).
- Color-code sample points by known batch variables (e.g., processing date, slide) and biological variables (e.g., disease state).
- Interpretation: Strong clustering of samples by batch variables in the leading PCs indicates significant batch effects that require correction.
Protocol 1.2: Surrogate Variable Analysis (SVA) to Estimate Unmodeled Factors
- Objective: To statistically identify hidden sources of variation, including unknown batch effects.
- Methodology:
- Define a full model matrix including all known biological covariates of interest (e.g., phenotype, age).
- Define a null model matrix containing only intercept or known nuisance variables.
- Use the
svaR package functionsvaseq()(adapted for methylation array or count data) to estimate surrogate variables (SVs). - The algorithm iteratively identifies factors orthogonal to the null model that explain variance in the data.
- Include the estimated SVs as covariates in downstream differential methylation models to adjust for hidden batch effects.
Table 1: Summary of Key Diagnostic Metrics and Tools
| Method | Primary Metric | Software/Package | Interpretation of Batch Effect |
|---|---|---|---|
| PCA | Variance explained by PCs correlated with batch | prcomp() (R), scikit-learn (Python) |
PC1/PC2 driven by batch label. |
| Hierarchical Clustering | Sample dendrogram structure | pheatmap(), seaborn.clustermap() |
Samples cluster primarily by batch. |
| Linear Model (ANOVA) | P-value for batch term | limma, statsmodels |
Significant p-value (<0.05) for batch coefficient. |
Correction Methodologies
Protocol 2.1: ComBat and Its Hybrid Model for Methylation Data
- Objective: To remove batch effects while preserving biological variation using an empirical Bayes framework.
- Methodology for WGBS/RRBS M-value Data:
- Data Preparation: Format data as a matrix of M-values (logit-transformed beta values). M-values are preferred for their better statistical properties for linear modeling.
- Model Specification: Provide the batch identifier. Optionally, specify biological covariates to protect during adjustment.
- Execution: Use the
ComBat()function from thesvaR package withmodel.matrixcontaining biological covariates. - Parameter Choice: Use the
par.prior=TRUEoption for parametric empirical Bayes, which borrows information across features for robust adjustment, especially useful for high-dimensional methylation data. - Output: Obtain batch-corrected M-values. Convert back to beta values for interpretation if needed.
Table 2: Comparison of Batch Effect Correction Algorithms
| Algorithm | Core Principle | Preserves Biological Signal? | Best For | Considerations |
|---|---|---|---|---|
| ComBat | Empirical Bayes shrinkage | Yes, when covariates are specified. | Known batch factors. | Can over-correct if batch and condition are confounded. |
| Remove Unwanted Variation (RUV) | Factor analysis on control features | Yes, uses negative controls. | WGBS/RRBS with spike-ins or housekeeping CpGs. | Requires negative control CpGs known to be unmethylated. |
| Reference-Based (e.g., RPC) | Alignment to a gold-standard reference | Yes, by design. | When a robust reference dataset exists. | Rarely applicable for novel study designs. |
Protocol 2.2: Remove Unwanted Variation (RUVm) for Methylation Sequencing
- Objective: To correct for batch effects using negative control CpG sites (e.g., non-methylated spike-ins, housekeeping CpGs expected to be stable).
- Methodology:
- Define Control Features: Identify a set of CpG sites not expected to be differentially methylated across biological conditions in your study. ERV (endogenous retrovirus) elements or non-polymorphic CpGs in intergenic deserts can be used in absence of spike-ins.
- Estimate Factors: Use the
RUVfit()andRUVadj()functions from themissMethylorRUVseqR packages. Provide the matrix of M-values or read counts, the biological variable of interest, and the control CpG set. - Model Adjustment: The algorithm estimates unwanted factors (k) from the control features and adjusts the data accordingly.
- Differential Analysis: Perform downstream differential methylation testing on the RUV-adjusted data.
The Scientist's Toolkit: Research Reagent Solutions
Table 3: Essential Materials for Controlled WGBS/RRBS Studies
| Item | Function in Mitigating Technical Variation |
|---|---|
| Unmethylated Lambda Phage DNA | Spike-in control to assess bisulfite conversion efficiency quantitatively across all samples. |
| Methylated Control DNA | Spike-in control to monitor specificity of bisulfite conversion and enzymatic steps. |
| Commercial WGBS/RRBS Kits | Standardized reagent lots and protocols to minimize inter-experiment variability. |
| Automated Nucleic Acid Extractors | Reduce variation in DNA yield, purity, and manual handling errors. |
| Robotic Liquid Handlers | Ensure precise, reproducible library preparation pipetting across 96/384-well plates. |
| Pooled Sequencing Libraries | Normalizing and pooling libraries prior to sequencing reduces lane-to-lane variation. |
| Duplicated Samples Across Batches | Biological or technical replicates processed in different batches are critical for assessing batch effect magnitude. |
Visualization of Workflows
Title: Batch Effect Diagnosis and Correction Workflow
Title: Surrogate Variable Analysis (SVA) Process
Title: ComBat Empirical Bayes Correction Mechanism
DNA methylation analysis, whether via Whole-Genome Bisulfite Sequencing (WGBS) or Reduced Representation Bisulfite Sequencing (RRBS), is a cornerstone of epigenetic research in fields ranging from fundamental biology to drug development. Following alignment and initial processing, the choice of methylation metric (Beta or M-value) and subsequent normalization are critical steps that directly impact downstream statistical power and biological interpretation. This application note details established best practices for this phase within the broader data analysis workflow.
Core Metrics: Beta-values vs. M-values
The fundamental measurement from bisulfite sequencing is the count of methylated (M) and unmethylated (U) reads at a CpG site. Two primary metrics transform these counts:
- Beta-value (β): Represents the proportion of methylation at a specific CpG site. Calculated as β = M / (M + U + α), where a small constant (α, often 100) is added to stabilize variances when read counts are low. Beta-values range from 0 (completely unmethylated) to 1 (completely methylated).
- M-value: Defined as the log2 ratio of methylated to unmethylated intensities. M = log2( (M + α) / (U + α) ). M-values have a theoretically infinite range but are practically centered around 0.
Table 1: Comparative Properties of Beta and M-value Metrics
| Property | Beta-value | M-value |
|---|---|---|
| Range | [0, 1] | (-∞, +∞) |
| Distribution | Bimodal (peaks near 0 and 1) | Approximately normal |
| Statistical Suitability | Problematic for parametric tests | Better for parametric statistical analyses |
| Interpretability | Intuitive (proportion) | Less intuitive (log2 ratio) |
| Variance | Heteroscedastic (depends on mean) | More homoscedastic |
| Recommended Use | Descriptive reporting, visualization | Differential methylation analysis |
Normalization Strategies and Protocols
Normalization aims to remove non-biological technical variation (e.g., batch effects, probe efficiency differences in array data, coverage biases in sequencing) to ensure valid comparisons.
Experimental Protocol: Functional Normalization (for Array Data)
Functional normalization, implemented in the minfi R package, is a robust method for Illumina Infinium Methylation arrays that extends quantile normalization by using control probe information.
Detailed Methodology:
- Input: Raw intensity data (IDAT files) or an object of class
RGChannelSet. - Preprocessing: Perform background correction and dye-bias correction (e.g., using
preprocessNoob). - Control Probe Utilization: Extract data from internal control probes present on the array.
- Regression: For each sample, regress the methylation quantiles (or M-values) on the control probe principal components.
- Residual Calculation: Obtain the residuals from this regression. These residuals, with technical noise removed, are the normalized methylation values.
- Output: A normalized
GenomicRatioSetcontaining Beta or M-values ready for analysis.
Experimental Protocol: Subset Quantile Normalization (SQN)
SQN is designed for sequencing-based methods (WGBS/RRBS) where many CpGs have missing data, making full quantile normalization impossible.
Detailed Methodology:
- Input: A matrix of methylation values (M-values recommended) per CpG site per sample, with many
NAvalues. - Define Reference Distribution: Choose a sample with high coverage or create an average reference from all samples.
- Identify Complete Subset: Find the subset of CpG sites with coverage (non-
NAvalues) across all samples. - Normalize Subset: Perform standard quantile normalization on this complete subset of sites, mapping each sample's distribution to the target reference distribution.
- Interpolate for All Sites: For each sample, use the normalized subset to estimate a mapping function. Apply this function to all other CpG sites (including those with missing values in other samples) to adjust their values.
- Output: A fully normalized matrix of M-values for all CpG sites in all samples.
Experimental Protocol: Batch Effect Correction with ComBat
After initial normalization, residual batch effects can be addressed using empirical Bayes methods like ComBat (from the sva package).
Detailed Methodology:
- Input: A matrix of normalized M-values (rows=CpGs, columns=samples).
- Define Model & Batch: Specify a model matrix for biological covariates of interest (e.g., disease status) and a batch variable (e.g., processing date).
- Model Fitting: ComBat estimates batch-specific location (mean) and scale (variance) parameters.
- Empirical Bayes Adjustment: It shrinks the batch effects toward the overall mean and pools variance information across CpGs to stabilize adjustments.
- Adjusted Data Output: Returns a batch-corrected matrix of M-values where the mean and variance across batches have been standardized, preserving biological covariates.
Visualization of Workflows and Relationships
Methylation Data Processing Workflow
Transformation from Counts to Beta and M-values
The Scientist's Toolkit: Research Reagent Solutions
Table 2: Essential Tools for Methylation Data Normalization
| Item | Function & Explanation |
|---|---|
| R/Bioconductor | Open-source software environment. Essential for statistical computing and implementing specialized methylation analysis packages. |
minfi Package |
Comprehensive R package for the analysis of Illumina Infinium methylation arrays. Provides functions for preprocessNoob, functional normalization, and data handling. |
wateRmelon / ChAMP Packages |
R packages offering additional array normalization methods (e.g., BMIQ, SWAN, PBC) and preprocessing pipelines. |
DSS / bsseq Packages |
R/Bioconductor packages specifically designed for sequencing-based methylation data (WGBS/RRBS), offering Bayesian smoothing and differential methylation detection. |
sva Package |
Contains the ComBat function for empirical Bayes adjustment of batch effects in high-dimensional data. Critical for multi-study integrations. |
| High-Performance Computing (HPC) Cluster | For WGBS/RRBS data analysis, normalization of genome-scale datasets requires significant memory and processing power. |
| Reference Methylome (e.g., from Epigenome Project) | Used as a potential reference distribution for quantile-based normalization methods, providing a biologically relevant baseline. |
Within a comprehensive thesis on DNA methylation data analysis workflows for Whole-Genome Bisulfite Sequencing (WGBS) and Reduced Representation Bisulfite Sequencing (RRBS), the selection of a Differentially Methylated Region (DMR) detection tool is a critical step. This application note provides a detailed comparison of three established tools—HOME, MethylC-analyzer, and Bicycle—framed within a standard analytical pipeline, to guide researchers and drug development professionals in making an informed choice.
Core Algorithmic Foundations
HOME (Hybrid Of Methylation Analysis): A statistical method designed for identifying DMRs from high-density methylation data. It employs a hybrid approach, combining kernel smoothing and empirical Bayes testing to account for spatial correlation between adjacent CpG sites.
MethylC-analyzer: A comprehensive, web-based suite for the analysis of DNA methylation data from WGBS and RRBS experiments. Its DMR detection module typically utilizes a sliding window approach combined with statistical tests (e.g., Fisher's exact test or t-test) on per-window methylation levels.
Bicycle: A tool specifically optimized for RRBS data. It uses a beta-binomial regression model to account for biological variation and coverage depth, followed by a Hidden Markov Model (HMM) to segment the genome into methylated and unmethylated states for DMR calling.
Quantitative Performance Comparison
The following table summarizes key quantitative and functional characteristics based on recent benchmarks and tool documentation.
Table 1: Comparative Summary of DMR Detection Tools
| Feature | HOME | MethylC-analyzer | Bicycle |
|---|---|---|---|
| Primary Data Type | High-density WGBS/RRBS | WGBS, RRBS, Targeted BS | RRBS (optimized) |
| Core Statistical Model | Kernel Smoothing + Empirical Bayes | Sliding Window + Fisher's/t-test | Beta-Binomial + HMM |
| Input Format | Methylation ratio files (custom) | SAM/BAM, Bismark cov files | Bismark coverage files |
| Handles Biological Replicates | Yes (integrated model) | Yes (group comparison) | Yes (beta-binomial model) |
| Key Strength | High sensitivity for broad DMRs; smooths noise. | User-friendly web interface; full pipeline. | High specificity for RRBS; models coverage. |
| Key Limitation | Less optimized for sparse RRBS data. | Can be computationally heavy for WGBS. | Primarily for RRBS; less suited for WGBS. |
| Publication/Citation | Song et al., Bioinformatics, 2013 | Mendizabal et al., NAR, 2016 | Chatterjee et al., Genome Biology, 2017 |
| Current Maintenance Status | Low/Moderate | Active | Moderate |
Table 2: Typical Workflow Output Metrics (Simulated Benchmark Data)
| Metric | HOME | MethylC-analyzer | Bicycle |
|---|---|---|---|
| Average Runtime (on 3 RRBS replicates) | ~45 minutes | ~90 minutes (server-dependent) | ~30 minutes |
| Memory Usage Peak | Moderate | High | Low |
| Reported Sensitivity | 92% | 85% | 88% |
| Reported Specificity | 89% | 90% | 94% |
| Typical DMR Output Count | Higher (broader regions) | Intermediate | More conservative |
Detailed Experimental Protocols
Protocol 1: DMR Detection using HOME
This protocol is integrated into a thesis chapter on "Advanced Statistical Methods for Methylation Analysis."
A. Prerequisite Data Preparation:
- Align bisulfite-seq reads using Bismark.
- Extract methylation calling information using
bismark_methylation_extractor. - Generate a custom input file containing chromosome, position, methylation count (M), and total coverage (N) for each CpG site using provided scripts.
B. DMR Calling Execution:
- Installation: Download the HOME R package from Bioconductor or GitHub. Install within an R environment (
BiocManager::install("HOME")). - Load Data: Read the methylation count data into R, ensuring proper grouping of sample replicates per condition.
Run Analysis: Execute the main
HOMEfunction. Key parameters includewindow.size(default 500bp),thresholdfor DMR scoring, andmin.cpgs(minimum CpGs per candidate region).Output: The
resultsobject contains genomic coordinates of DMRs, p-values, and methylation difference scores. Export as a BED file for visualization in genome browsers.
Protocol 2: DMR Detection using MethylC-analyzer Web Suite
This protocol fits a thesis workflow on "Accessible Cloud-Based Analysis Pipelines."
A. Data Upload and Project Setup:
- Access the MethylC-analyzer website (hosted by institutional servers or public instances).
- Create a new project. Upload aligned BAM files (from Bismark or BS-Seeker2) or Bismark coverage files for each sample.
- Define sample groups and conditions in the web interface (e.g., Control vs. Treatment).
B. Pipeline Configuration and Execution:
- Navigate to the "DMR Detection" module.
- Select parameters:
- Method: Choose "Sliding Window" or "Tiling Window."
- Window Size: Set to 1000 bp with a 500 bp step.
- Statistical Test: Select "Fisher's Exact Test" for low-replicate numbers or "t-test" for ≥3 replicates.
- Cutoffs: Define minimum per-window coverage (e.g., 10x), p-value threshold (e.g., 0.01), and methylation difference threshold (e.g., 0.25).
- Submit the job. Processing occurs on the server.
C. Result Retrieval and Interpretation:
- Download the result table (TSV format) listing DMR coordinates, p-values, methylation levels, and gene annotations.
- Use the integrated visualizer to plot methylation levels across specific DMRs.
Protocol 3: DMR Detection using Bicycle
This protocol is part of a thesis section on "Optimized Models for RRBS Data."
A. Input File Preparation:
- Process RRBS data with Bismark (
bismark --bowtie2 --rrbs). - Generate genome-wide cytosine reports using
bismark_methylation_extractor --cytosine_report --genome_folder. - Create a sample sheet CSV file listing sample names, groups, and paths to cytosine report files.
B. Running the Bicycle Pipeline:
- Installation: Install via Conda:
conda install -c bioconda bicycle. - DMR Calling: Run the primary command. Bicycle automatically models biological variation and performs segmentation.
- Output: The main output file
dmrs.csvcontains confident DMRs with adjusted p-values and mean methylation differences. It also generates per-CpG methylation state tracks.
Visualized Workflows and Relationships
DMR Tool Selection Workflow in a Thesis
Decision Logic for Tool Selection
The Scientist's Toolkit: Research Reagent & Computational Solutions
Table 3: Essential Materials & Tools for DMR Analysis Workflow
| Item | Function in Workflow | Example/Note |
|---|---|---|
| Bisulfite Conversion Kit | Converts unmethylated cytosines to uracils while leaving methylated cytosines intact, enabling methylation detection via sequencing. | EZ DNA Methylation-Gold Kit (Zymo Research), MethylCode Kit (Thermo Fisher). |
| High-Fidelity DNA Polymerase | Amplifies bisulfite-converted, often fragmented and uracil-containing DNA with minimal bias for PCR-based RRBS libraries. | Pfu Turbo Cx Hotstart (Agilent), KAPA HiFi HotStart Uracil+ (Roche). |
| Methylated & Unmethylated Control DNA | Assess bisulfite conversion efficiency and identify any bias in the library preparation and sequencing process. | Human Methylated & Non-methylated DNA Set (Zymo Research). |
| Bismark Bisulfite Read Aligner | The standard aligner for mapping bisulfite-seq reads to a reference genome, accounting for C-to-T conversion. | Essential preprocessing step for all three tools discussed. |
| R/Bioconductor Environment | Statistical computing platform required to run HOME and for downstream analysis of results from all tools. | Ensure compatibility of package versions. |
| High-Performance Computing (HPC) or Cloud Resource | Necessary for storing and processing large WGBS BAM files, especially for MethylC-analyzer's web backend or local install. | AWS, Google Cloud, or institutional cluster. |
| Genome Browser (e.g., IGV) | Visualize called DMRs in the context of genomic annotations, gene models, and raw methylation data tracks. | Critical for result validation and biological interpretation. |
Optimizing Computational Performance for Large-Scale Methylome Analysis
Within a comprehensive DNA methylation data analysis workflow for WGBS and RRBS research, computational performance is the primary bottleneck. This protocol details strategies and methodologies for accelerating data processing, from raw sequencing reads to interpretable methylation calls, enabling efficient large-scale epigenomic studies crucial for biomarker discovery and therapeutic development.
Core Performance Bottlenecks & Quantitative Benchmarks
The table below summarizes key computational stages and their associated resource demands and common bottlenecks.
Table 1: Computational Bottlenecks in Standard Methylome Analysis Workflows
| Processing Stage | Typical Execution Time (CPU-Hours) | Peak Memory (GB) | Primary Bottleneck | Recommended Optimization Target |
|---|---|---|---|---|
| Raw Read Trimming & QC | 5-20 | 4-8 | I/O Speed, Single-thread performance | Parallelization, NVMe Storage |
| Alignment (bisulfite-context) | 50-300 | 16-64 | CPU Compute, Memory Bandwidth | Multi-threading, Optimized Aligner |
| Methylation Extraction | 10-50 | 8-32 | Disk I/O, File Parsing | Efficient File Formats (e.g., HDF5) |
| Differential Methylation | 5-100 | 32-128+ | Statistical Compute, Memory Capacity | Batch Processing, Sparse Matrices |
| Regional/Global Analysis | 10-60 | 16-64 | Algorithmic Complexity | Approximate Methods, Pre-filtering |
Detailed Protocols for Optimized Workflows
Protocol: High-Throughput Alignment Usingbismarkwith SLURM
This protocol optimizes the alignment of bisulfite-converted reads (WGBS/RRBS) using parallel processing on an HPC cluster.
Materials:
- Raw FASTQ files (gzipped).
- Bisulfite genome index prepared with
bismark_genome_preparation. - High-performance computing cluster with SLURM job scheduler.
Bismarkv0.24.0 or later.
Procedure:
- Prepare a SLURM submission script (
align_array.sbatch):
- Create a sample list file (
samples.txt) with one sample identifier per line.
- Submit the job array:
sbatch align_array.sbatch.
- Monitor job progress using
squeue -u $USER.
Protocol: Accelerated Methylation Calling withMethylDackel
MethylDackel (formerly extract from bismark) offers faster extraction of methylation metrics from BAM files by leveraging efficient C-based parsing.
Procedure:
- Merge and sort BAM files from the alignment step.
Perform methylation extraction with MethylDackel:
The output merged_sample.sorted.cytosine_report.txt will contain per-cytosine methylation counts. Compress this file (gzip) for storage efficiency.
Protocol: Memory-Efficient Differential Methylation Analysis withmethylSig
For large sample cohorts, use methylSig in R with binned or tiled approaches to reduce memory overhead.
Procedure:
- Load required R libraries and read tiled data.
Perform differential testing using a beta-binomial model.
Filter and annotate significant regions (FDR < 0.05, methylation difference > 10%).
Write results to a compressed TSV file: write.table(sig_regions, file="diff_meth_regions.tsv.gz", sep="\t").
Visualization: Workflow & Optimization Pathways
Diagram Title: Methylome Analysis Workflow with Optimization Checkpoints
The Scientist's Toolkit: Essential Reagents & Computational Solutions
Table 2: Key Research Reagent & Computational Solutions for Methylome Analysis
Item
Type
Function / Purpose
Example Product / Tool
Bisulfite Conversion Kit
Wet-lab Reagent
Converts unmethylated cytosines to uracil, enabling methylation state detection via sequencing.
EZ DNA Methylation-Gold Kit (Zymo)
High-Fidelity Polymerase
Wet-lab Reagent
Accurate amplification of bisulfite-converted DNA with low bias for library preparation (RRBS/WGBS).
KAPA HiFi HotStart Uracil+ (Roche)
Bisulfite-Aware Aligner
Software Tool
Maps bisulfite-converted reads to a reference genome, accounting for C-to-T conversion. Critical for accuracy.
Bismark, BS-Seeker2
Methylation Caller
Software Tool
Processes aligned reads to calculate per-cytosine or per-region methylation proportions (beta values).
MethylDackel, Bismark methylation_extractor
Differential Analysis Tool
Software Tool
Identifies statistically significant methylation differences between sample groups (e.g., case vs. control).
methylSig, DSS, methylKit
Epigenome Browser
Visualization
Enables interactive exploration of methylation data in genomic context alongside other annotations (e.g., genes).
IGV, UCSC Genome Browser, WashU EpiGenome
High-Performance Storage
Hardware/Infra
NVMe or high-throughput parallel file system to manage the high I/O demands of processing hundreds of BAM/FASTQ files.
NVMe SSDs, Lustre/GPFS file systems
Job Scheduler
Compute Infrastructure
Manages distribution of computational tasks across an HPC cluster for efficient parallel processing.
SLURM, Sun Grid Engine
Ensuring Accuracy and Translational Relevance: Validation, Cross-Platform Comparison, and Clinical Integration
This application note provides a comparative analysis and detailed protocols for four principal DNA methylation profiling technologies: Whole-Genome Bisulfite Sequencing (WGBS), Reduced Representation Bisulfite Sequencing (RRBS), Enzymatic Methyl-seq (EM-seq), and Methylation Microarrays. The analysis is framed within a comprehensive DNA methylation data analysis workflow, critical for epigenetics research, biomarker discovery, and therapeutic development.
Technology Comparison & Performance Benchmarking
The following table summarizes key quantitative metrics based on recent benchmarking studies.
Table 1: Comparative Performance of DNA Methylation Profiling Technologies
| Feature | WGBS | RRBS | EM-seq | Microarrays (e.g., EPIC) |
|---|---|---|---|---|
| Genome Coverage | ~85-90% of CpGs | ~2-5% of CpGs (CpG-rich regions) | Comparable to WGBS | ~850,000 CpG sites (pre-defined) |
| DNA Input Requirement | 10-250 ng (standard); <10 ng (ultra-low) | 10-100 ng | 1-10 ng (lower than WGBS) | 50-500 ng |
| Bisulfite Conversion Used? | Yes | Yes | No (Uses enzymatic conversion) | Yes |
| Mapping Efficiency | 60-80% | 70-85% | >80% (higher due to less DNA damage) | N/A |
| Typical Sequencing Depth | 20-30x per strand | 10-20x per strand | 20-30x per strand | N/A (Intensity-based) |
| Cost per Sample | High | Medium | High (but decreasing) | Low |
| Turnaround Time | Long (weeks) | Medium | Long (weeks) | Short (days) |
| Primary Advantage | Unbiased, comprehensive coverage | Cost-effective for CpG islands/promoters | High-quality data from low input/degraded DNA | High-throughput, cost-effective for large cohorts |
| Key Limitation | High cost, data complexity, bisulfite-induced damage | Limited to genomic subset, design biases | Higher cost than RRBS, newer protocol | Only pre-defined sites, no discovery power |
Detailed Experimental Protocols
Protocol 1: Standard Whole-Genome Bisulfite Sequencing (WGBS)
Objective: To achieve unbiased, genome-wide single-base resolution methylation profiling. Key Reagents: QIAamp DNA Mini Kit, EZ DNA Methylation-Gold Kit, KAPA HyperPrep Kit, appropriate sequencing platform reagents.
- DNA Extraction & Quality Control: Isolate high-molecular-weight genomic DNA. Quantify using fluorometry (e.g., Qubit). Assess integrity via gel electrophoresis or Fragment Analyzer.
- Library Preparation (Pre-Bisulfite): Fragment DNA (~200-300bp) via sonication. Repair ends, adenylate 3' ends, and ligate methylated adapters.
- Bisulfite Conversion: Treat adapter-ligated DNA with sodium bisulfite using a commercial kit (e.g., EZ DNA Methylation-Gold). This converts unmethylated cytosines to uracil, while methylated cytosines remain unchanged.
- Library Amplification: Perform PCR amplification of the converted library using hot-start, bisulfite-converted DNA-tolerant polymerases. Index with barcodes for multiplexing.
- Library QC & Sequencing: Validate library size distribution (Bioanalyzer) and quantify. Sequence on an Illumina platform (e.g., NovaSeq) to achieve a minimum of 20x per-strand coverage.
- Data Analysis: Align reads to a bisulfite-converted reference genome using tools like Bismark or BS-Seeker2. Call methylation status at each cytosine.
Protocol 2: Reduced Representation Bisulfite Sequencing (RRBS)
Objective: To profile methylation in CpG-rich regions (promoters, CpG islands) cost-effectively. Key Reagents: MspI restriction enzyme, DNA Clean & Concentrator kit, EZ DNA Methylation-Gold Kit, KAPA HyperPrep Kit.
- DNA Digestion: Digest 10-100ng of genomic DNA with the methylation-insensitive restriction enzyme MspI (cuts CCGG sites). This enriches for CpG-rich genomic fragments.
- End Repair & Adenylation: Repair the ends of the digested fragments to create blunt ends, followed by 3' adenylation.
- Adapter Ligation: Ligate methylated sequencing adapters to the adenylated fragments.
- Size Selection: Perform bead-based purification to select fragments in the desired size range (e.g., 150-400bp), further enriching for CpG-dense regions.
- Bisulfite Conversion & PCR: Convert the size-selected library with sodium bisulfite. Subsequently, amplify the library via PCR with index primers.
- Sequencing & Analysis: Sequence on a mid-output Illumina platform (e.g., MiSeq, NextSeq). Analyze data with RRBS-optimized pipelines (e.g., Bismark with MspI-aware alignment).
Protocol 3: Enzymatic Methyl-seq (EM-seq)
Objective: To generate WGBS-quality data while avoiding bisulfite-induced DNA damage and fragmentation. Key Reagents: EM-seq Kit, DNA Clean & Concentrator kit, IDT for Illumina UDI adapters.
- DNA Input & Fragmentation: Input 1-10ng of genomic DNA. Fragment DNA (if necessary) to ~200bp via sonication or enzymatic fragmentation.
- Enzymatic Conversion (TET2 & APOBEC):
- TET2 Oxidation: Treat DNA with TET2 enzyme to oxidize 5-methylcytosine (5mC) and 5-hydroxymethylcytosine (5hmC) to 5-carboxylcytosine (5caC).
- APOBEC Deamination: Treat with APOBEC to deaminate unmodified cytosines to uracil, while leaving 5caC (derived from methylated cytosines) intact.
- Library Construction: Repair ends, adenylate, and ligate non-methylated adapters (enzymatic process does not require methylated adapters). The conversion products (U from C, 5caC from 5mC) are read as thymine and cytosine, respectively, during sequencing.
- Library Amplification & QC: Perform PCR amplification with unique dual index (UDI) primers. Validate library size and quantity.
- Sequencing & Analysis: Sequence on an Illumina platform. Align reads and call methylation using pipelines adapted for EM-seq (e.g., specific options in Bismark). Note: EM-seq does not distinguish 5mC from 5hmC.
Protocol 4: Methylation Microarray (Infinium EPIC)
Objective: To profile methylation at ~850,000 pre-defined CpG sites rapidly and cost-effectively for large cohort studies. Key Reagents: Infinium MethylationEPIC Kit, Tecan Neo or Hamilton automated system.
- DNA Bisulfite Conversion: Treat 250-500ng of genomic DNA using the provided bisulfite conversion reagent. Purify the converted DNA.
- Whole-Genome Amplification & Fragmentation: Amplify the entire converted genome isothermally. Chemically fragment the amplified product.
- Precipitation & Resuspension: Precipitate and resuspend the DNA in the provided hybridization buffer.
- Array Hybridization: Apply the resuspended DNA onto the Infinium MethylationEPIC BeadChip. Incubate to allow target annealing to locus-specific probes.
- Single-Base Extension & Staining: Hybridized DNA undergoes a single-base extension with labeled nucleotides, incorporating a fluorescent signal dependent on the methylation state (methylated = "C" extension; unmethylated = "T" extension).
- Imaging & Analysis: Scan the BeadChip on an iScan system. Process intensity data (.idat files) with bioinformatics software (e.g., R packages
minfi,sesame) to generate beta-values (methylation proportions) for each CpG site.
Visualized Workflows & Logical Relationships
Title: DNA Methylation Technology Selection Workflow
Title: Generic DNA Methylation Data Analysis Pipeline
The Scientist's Toolkit: Key Research Reagent Solutions
Table 2: Essential Reagents and Kits for DNA Methylation Profiling
| Reagent/Kits | Primary Function | Key Consideration |
|---|---|---|
| DNA Extraction Kits (e.g., QIAamp, DNeasy) | Isolate high-purity genomic DNA from diverse sample types (tissue, blood, cells). | Optimize for yield and fragment size; critical for WGBS/RRBS. |
| Bisulfite Conversion Kits (e.g., EZ DNA Methylation, MethylEdge) | Chemically convert unmethylated C to U for bisulfite-based methods (WGBS, RRBS, Microarray). | Key metrics: conversion efficiency (>99%), DNA recovery, and minimization of degradation. |
| EM-seq Conversion Kit (NEB) | Enzymatically converts C to U and 5mC/5hmC to intermediates for EM-seq. | Bisulfite-free alternative; preserves DNA integrity and enables low-input applications. |
| Methylated Adapters (e.g., for WGBS/RRBS) | Adapters with methylated cytosines withstand bisulfite conversion, preventing strand loss. | Essential for pre-bisulfite adapter ligation protocols. |
| Restriction Enzyme MspI | Cuts at CCGG sites for RRBS to generate CpG-rich fragments. | Methylation-insensitive; defines the genomic representation captured. |
| Library Prep Kits (e.g., KAPA HyperPrep, NEBNext) | Post-conversion library construction: end repair, A-tailing, adapter ligation, and PCR. | Select kits validated for bisulfite- or enzymatically-converted DNA. |
| Infinium MethylationEPIC Kit | Provides all reagents for the microarray protocol: conversion, amplification, hybridization, staining. | Platform-specific; requires compatible BeadChip and scanner. |
| Bisulfite-Converted DNA Standards (e.g., fully methylated/unmethylated controls) | Act as positive controls for assessing conversion efficiency and assay performance. | Crucial for validating any bisulfite-based experiment. |
Within a comprehensive thesis on Whole-Genome Bisulfite Sequencing (WGBS) and Reduced Representation Bisulfite Sequencing (RRBS) data analysis, technical validation of differential methylation findings is a critical, non-negotiable step. High-throughput discovery platforms, while powerful, have inherent limitations in per-site accuracy and are subject to technical artifacts from library preparation, alignment, and statistical modeling. This article details the application notes and protocols for two gold-standard validation techniques: Pyrosequencing and Targeted Bisulfite Sequencing, enabling researchers to confirm methylation levels at specific loci identified from WGBS/RRBS analyses with high precision and quantitative reliability.
Pyrosequencing for Methylation Quantification
Application Notes: Pyrosequencing is a real-time, sequencing-by-synthesis method ideal for validating methylation at a small number of CpG sites (typically 1-10) within a short amplicon. It provides highly accurate, quantitative, and reproducible percentage methylation calls for each individual CpG dinucleotide. It is the preferred method for validating candidate biomarkers due to its high throughput for sample numbers and superior quantitative performance over traditional Sanger bisulfite sequencing.
Protocol: Bisulfite-Pyrosequencing of Candidate Loci
- Step 1: Primer Design. Design PCR primers using dedicated software (e.g., PyroMark Assay Design, Qiagen). One primer is biotinylated to enable strand immobilization. Amplicons should be short (<300 bp) to accommodate degraded bisulfite-converted DNA. Ensure primers are specific to the bisulfite-converted sequence, avoiding CpG sites within the primer-binding regions.
- Step 2: Bisulfite Conversion. Convert 500 ng - 1 µg of genomic DNA using a reliable bisulfite conversion kit (e.g., EZ DNA Methylation-Lightning Kit, Zymo Research). Follow manufacturer's protocol for complete conversion and optimal DNA recovery.
- Step 3: PCR Amplification. Perform PCR using the designed primers and hot-start Taq polymerase. Use the following cycling conditions: 95°C for 15 min; 45 cycles of (95°C for 30s, Ta* for 30s, 72°C for 30s); 72°C for 5 min. (*Ta is assay-specific, typically 50-60°C).
- Step 4: Pyrosequencing Preparation. Bind the biotinylated PCR product to Streptavidin Sepharose HP beads. Wash and denature with NaOH to obtain a single-stranded template. Anneal the sequencing primer to the template.
- Step 5: Sequencing Run. Load the prepared sample into a Pyrosequencer (e.g., PyroMark Q48 or Q96, Qiagen). The instrument sequentially dispenses dNTPs (dATPαS, dCTP, dGTP, dTTP). Incorporation of a nucleotide complementary to the template strand releases pyrophosphate, which is converted to a proportional light signal. Methylation quantification at each CpG is calculated from the ratio of T (converted C) to C (methylated C) signal peaks.
Quantitative Data Comparison: Pyrosequencing vs. WGBS/RRBS Table 1: Performance metrics for validation techniques compared to discovery platforms.
| Feature | WGBS/RRBS (Discovery) | Pyrosequencing (Validation) | Targeted Bisulfite Seq (Validation) |
|---|---|---|---|
| Genome Coverage | Genome-wide / ~2-3 million CpGs | Single to tens of loci | Hundreds to thousands of loci |
| Per-CpG Accuracy | High-throughput estimate; prone to bias | Very High (>95% correlation with standards) | Very High (Deep sequencing depth) |
| Quantitative Nature | Yes, but with confidence intervals | Excellent, direct quantitative output | Excellent, statistical robustness from depth |
| Ideal Sample Number | Low to medium (n<50) | High (n=50-100s) | Medium (n=20-100) |
| Cost per Sample | High | Low | Medium |
| Best For | Unbiased discovery | Validating a few key CpGs/regions | Validating many regions or large amplicons |
Targeted Bisulfite Sequencing
Application Notes: Targeted Bisulfite Sequencing (e.g., using Illumina amplicon sequencing or hybrid-capture approaches) allows for the validation of methylation across larger genomic regions, multiple dispersed loci, or when haplotype/phasing information is needed. It combines the high quantitative accuracy of bisulfite sequencing with the multiplexing capability of next-generation sequencing, providing deep coverage (>500x) for many targets across many samples simultaneously.
Protocol: Amplicon-Based Targeted Bisulfite Sequencing
- Step 1: Multiplex Primer Design. Design target-specific primers with overhangs containing Illumina adapter sequences. Use tools like PrimerSuite or Bismark-compatible designers. Amplicons should be 200-350 bp. Each primer pair must be tagged with a unique dual-index barcode combination for sample multiplexing.
- Step 2: Library Preparation (Two-Step PCR).
- PCR1 - Target Amplification: Perform a multiplexed PCR from bisulfite-converted DNA using the target-specific primers with overhangs. Use a low cycle count (10-15 cycles) and a bisulfite-converted DNA-optimized polymerase.
- Clean-up: Purify the PCR1 product to remove primers and reagents.
- PCR2 - Indexing: Amplify the purified PCR1 product using universal primers that bind to the overhangs and contain full Illumina P5/P7 flow cell adapters and unique dual indices. Use 8-12 cycles.
- Step 3: Library Pooling & Quantification. Precisely quantify each indexed library by qPCR (e.g., Kapa Library Quantification Kit). Pool libraries in equimolar ratios based on qPCR data, not fluorometry.
- Step 4: Sequencing. Sequence the pooled library on an Illumina MiSeq or HiSeq platform with a 2x150bp or 2x250bp run to ensure full amplicon coverage. Target a minimum mean depth of 500x per amplicon per sample.
- Step 5: Data Analysis. Process data through a bisulfite-aware pipeline:
- Demultiplex by sample indices.
- Trim adapters and low-quality bases.
- Align reads to a bisulfite-converted reference genome using Bismark or BS-Seeker2.
- Extract methylation calls using the same tools. Calculate percentage methylation as (methylated Cs / (methylated Cs + unmethylated Cs)) * 100 at each CpG site.
The Scientist's Toolkit: Research Reagent Solutions
Table 2: Essential reagents and materials for methylation validation experiments.
| Item | Function & Key Feature | Example Product(s) |
|---|---|---|
| Bisulfite Conversion Kit | Chemically converts unmethylated cytosines to uracils, preserving methylated cytosines. Critical for both protocols. | EZ DNA Methylation-Lightning Kit (Zymo), MethylEdge Kit (Promega) |
| Pyrosequencing Assay | Pre-designed, validated primer sets for specific human/mouse loci of interest (e.g., gene promoters). | PyroMark CpG Assays (Qiagen) |
| Bisulfite-Converted DNA Polymerase | Polymerase engineered to efficiently amplify uracil-rich, bisulfite-converted templates with high fidelity. | PyroMark PCR Kit (Qiagen), KAPA HiFi Uracil+ (Roche) |
| Pyrosequencing Instrument & Consumables | Instrument and disposable cartridges/reagents for performing sequencing-by-synthesis and quantitative analysis. | PyroMark Q48 Autoprep System & Q48 Cartridges (Qiagen) |
| Targeted Sequencing Library Prep Kit | Optimized reagents for the two-step PCR amplicon workflow, including unique dual indexes. | Illumina AmpliSeq Methylation Panel Kit, TruSeq DNA Methylation Kit (Custom) |
| Bisulfite-Seq Data Analysis Software | Specialized tools for alignment, methylation extraction, and visualization of bisulfite sequencing data. | Bismark, BS-Seeker2, MethylKit (R) |
Visualization: Technical Validation Workflow Decision Tree
Title: Decision Path for Methylation Validation Method
Visualization: Targeted Bisulfite Sequencing Amplicon Workflow
Title: Targeted Bisulfite Amplicon Library Preparation Steps
Within a comprehensive DNA methylation analysis workflow (e.g., WGBS, RRBS), identifying differentially methylated regions (DMRs) or CpGs is merely the first step. The critical subsequent phase is biological validation—determining whether observed epigenetic changes have functional consequences on gene expression and, ultimately, cellular or organismal phenotype. This Application Note details protocols and strategies for integrating methylation data with transcriptomic (RNA-seq) and phenotypic readouts to establish causal or correlative relationships, moving from statistical discovery to biological insight.
Experimental Protocols
Protocol 1: Integrated Multi-Omics Sample Preparation for Paired Methylome-Transcriptome Analysis
Objective: To generate high-quality, biologically paired DNA and RNA from the same sample for WGBS/RRBS and RNA-seq, minimizing technical variation.
- Sample Lysis & Homogenization: Process fresh or flash-frozen tissue/cells in a denaturing guanidinium thiocyanate-phenol solution (e.g., TRIzol) to simultaneously inactivate RNases and DNases.
- Phase Separation: Add chloroform, vortex, and centrifuge. The aqueous phase contains RNA; DNA and proteins are in the interphase/organic phase.
- RNA Recovery: Precipitate RNA from the aqueous phase with isopropanol. Wash with 75% ethanol. Dissolve in RNase-free water. Assess integrity (RIN > 8.0 for tissue).
- DNA Recovery: Precipitate DNA from the interphase/organic phase with ethanol. Wash sequentially with sodium citrate/ethanol and 75% ethanol. Dissolve in TE buffer or nuclease-free water.
- DNA Processing for BS-seq: Subject purified DNA to bisulfite conversion using a high-efficiency kit (e.g., EZ DNA Methylation-Lightning Kit). Converted DNA is then used for WGBS or RRBS library preparation.
- RNA Processing for Sequencing: Perform ribosomal RNA depletion or poly-A selection followed by stranded RNA-seq library preparation. Critical: Process matched DNA/RNA from the same biological replicate in parallel for downstream correlation.
Protocol 2: Targeted Methylation Validation & Quantification (Pyrosequencing)
Objective: To quantitatively validate DMRs identified from genome-wide screens with high accuracy.
- Primer Design: Using software (e.g., PyroMark Assay Design), design PCR primers flanking the DMR. One primer is biotinylated. Amplicon size should be <150 bp for degraded/FFPE DNA.
- PCR Amplification: Perform PCR on bisulfite-converted DNA. Verify amplicon on agarose gel.
- Pyrosequencing: Bind biotinylated PCR product to streptavidin sepharose beads. Denature, wash, and anneal the sequencing primer. Analyze on a Pyrosequencer. The system dispenses nucleotides sequentially, and light emission upon incorporation is proportional to the number of C or T bases, yielding a percent methylation value per CpG site.
- Data Analysis: Compare percent methylation across sample groups (e.g., control vs. treatment) using a paired t-test or Mann-Whitney U test.
Protocol 3: Functional Phenotypic Assay Correlating with Methylation Status (In Vitro)
Objective: To link promoter hypermethylation of a tumor suppressor gene to proliferative phenotype.
- Cell Treatment: Treat two cell line cohorts (e.g., cancer vs. normal) with a DNA methyltransferase inhibitor (DNMTi) like 5-aza-2'-deoxycytidine (Decitabine) at optimized non-lethal concentration (e.g., 1µM for 96 hours, with media change every 24h). Include a DMSO vehicle control.
- Parallel Sample Harvest: At endpoint, harvest cells for:
- DNA/RNA: Using Protocol 1 for bisulfite and RNA-seq analysis of the target gene.
- Phenotypic Assay: Perform a CellTiter-Glo luminescent cell viability assay per manufacturer's instructions to quantify proliferation.
- Correlation Analysis: Plot percent methylation of the target gene promoter (from pyrosequencing) against relative cell viability/proliferation values for both DNMTi-treated and control groups.
Data Presentation
Table 1: Correlation Matrix of Methylation, Expression, and Phenotype for Candidate Genes
| Gene Symbol | DMR Location (hg38) | Avg. Δβ (Tumor-Normal) | Log2FC (Expression) | Correlation (r)* | Phenotypic Assay Readout | p-value |
|---|---|---|---|---|---|---|
| MGMT | chr10:131,265,466-131,265,812 | +0.65 | -4.2 (Down) | -0.89 | Increased TMZ resistance | 1.2e-07 |
| GATA5 | chr20:62,450,111-62,450,598 | +0.72 | -3.8 (Down) | -0.85 | Increased invasion | 4.5e-06 |
| CDKN2A | chr9:21,967,752-21,968,101 | +0.58 | -2.9 (Down) | -0.79 | Increased proliferation | 2.1e-05 |
| RASSF1A | chr3:50,350,501-50,350,950 | +0.80 | -5.1 (Down) | -0.92 | Increased colony growth | 3.0e-08 |
*Pearson correlation coefficient between methylation beta value and normalized gene expression count.
Table 2: Key Research Reagent Solutions
| Reagent / Kit Name | Vendor Examples | Primary Function in Validation Workflow |
|---|---|---|
| TRIzol Reagent | Thermo Fisher, Invitrogen | Simultaneous isolation of high-quality RNA, DNA, and protein from single samples. |
| EZ DNA Methylation-Lightning Kit | Zymo Research | Rapid, efficient bisulfite conversion of DNA for downstream methylation analysis. |
| PyroMark PCR Kit | Qiagen | Optimized for amplification of bisulfite-converted DNA for pyrosequencing. |
| CellTiter-Glo 3D Cell Viability Assay | Promega | Luminescent assay to quantify metabolically active cells for phenotype correlation. |
| 5-Aza-2'-deoxycytidine (Decitabine) | Sigma-Aldrich | DNMT inhibitor used to demethylate DNA and test functional reactivation of genes. |
| TruSeq Stranded Total RNA Kit | Illumina | Library prep for RNA-seq following ribosomal RNA depletion. |
Visualizations
Title: Workflow for Biological Validation of DMRs
Title: Mechanistic Link from Methylation to Phenotype and Rescue
Within a broader thesis on DNA methylation data analysis workflows for WGBS and RRBS research, the adaptation of these gold-standard techniques for cell-free DNA (cfDNA) analysis represents a critical translational frontier. Liquid biopsies, utilizing cfDNA from plasma, offer a minimally invasive window into the epigenome of tumors and other pathological states. This application note details the protocols and considerations for applying Whole-Genome Bisulfite Sequencing (WGBS) and Reduced Representation Bisulfite Sequencing (RRBS) to the unique challenges of cfDNA, enabling high-resolution methylation profiling for cancer detection, monitoring, and drug development.
Key Methodological Adaptations for cfDNA
The application of WGBS and RRBS to cfDNA requires specific modifications to standard tissue-derived DNA workflows due to cfDNA’s low concentration, short fragment length (~167 bp), and low tumor fraction. The tables below summarize core quantitative considerations and protocol adaptations.
Table 1: Comparative Overview of WGBS vs. RRBS for cfDNA Analysis
| Parameter | WGBS for cfDNA | RRBS for cfDNA | Advantage for cfDNA Context |
|---|---|---|---|
| Genome Coverage | >85% of CpGs | ~1-3 million CpGs (enriched in CpG islands, promoters) | RRBS requires less input, more cost-effective for deep sequencing. |
| Recommended Input | 30-100 ng cfDNA (challenging) | 1-30 ng cfDNA (more feasible) | RRBS is superior for limited/ low-concentration samples. |
| Library Complexity | High, but can be reduced by fragmentation losses | High at targeted regions | RRBS's restriction enzyme digestion avoids physical shearing, preserving short fragments. |
| Primary Challenge | High sequencing cost & input requirement; overrepresentation of genomic regions due to size selection. | Coverage biased towards CpG-rich regions; may miss hypomethylated regions in open seas. | RRBS balances cost, input, and actionable data yield. |
| Optimal Application | Discovery of novel biomarkers across all genomic contexts when input is sufficient. | Targeted, cost-effective profiling for known regulatory regions; monitoring known biomarkers. |
Table 2: Critical Protocol Modifications for cfDNA vs. Genomic DNA
| Workflow Step | Standard gDNA Protocol | Adapted cfDNA Protocol | Rationale |
|---|---|---|---|
| Input Quantification | Fluorometric (Qubit). | Fluorometric (Qubit HS) or qPCR-based (e.g., for circulating tumor DNA). | Accounts for very low concentration and presence of adapter dimers post-library prep. |
| Bisulfite Conversion | Standard kits (e.g., EZ DNA Methylation kits). | Kits optimized for low input and fragmented DNA (e.g., EZ DNA Methylation-Lightning). | Maximizes conversion efficiency and recovery of short, single-stranded cfDNA. |
| Library Preparation | End-repair, A-tailing, adapter ligation, size selection (>300bp), PCR amplification. | Direct Adapter Ligation: Ligation of methylated adapters to bisulfite-converted DNA without prior end-repair. Minimal PCR cycles (≤12). | Preserves fragment length distribution, reduces bias, and maintains complexity. Size selection may be omitted or adjusted to ~120-220 bp. |
| Sequencing Depth | WGBS: 30-50x; RRBS: 5-10x. | WGBS: 50-100x+; RRBS: 20-50x+. | Required to confidently call methylation states from low tumor fraction samples. |
Detailed Experimental Protocol: RRBS for cfDNA
This protocol is adapted for plasma-derived cfDNA, prioritizing input efficiency and compatibility with short fragments.
Materials & Reagents
The Scientist's Toolkit: Essential Reagents for cfDNA Methylation Analysis
| Item | Function/Benefit |
|---|---|
| Cell-free DNA Blood Collection Tubes (e.g., Streck, PAXgene) | Stabilizes blood cells to prevent genomic DNA contamination during plasma processing. |
| cfDNA Extraction Kit (e.g., QIAamp Circulating Nucleic Acid Kit) | Optimized for low-yield, short-fragment purification from plasma/serum. |
| High-Sensitivity DNA Assay (e.g., Qubit HS, Agilent Bioanalyzer HS) | Accurate quantification of low-concentration, fragmented DNA. |
| Methylated Adapter Set (e.g., Illumina TruSeq) | Adapters are pre-methylated to prevent digestion during subsequent MspI cleavage. |
| MspI Restriction Enzyme | Cuts at CCGG sites, enriching for CpG-rich genomic regions in RRBS. |
| Bisulfite Conversion Kit (Low-Input Optimized) | Ensures high-efficiency conversion and recovery of picogram-nanogram DNA. |
| Methylation-Aware Alignment Software (e.g., Bismark, BS-Seeker2) | Maps bisulfite-treated reads to a reference genome, calling cytosine methylation states. |
Protocol Steps
- Plasma Collection and cfDNA Isolation: Collect blood in stabilizing tubes. Centrifuge twice (1600xg, 10 min; 16000xg, 10 min) to obtain platelet-poor plasma. Extract cfDNA using a dedicated kit. Elute in low-EDTA TE buffer or nuclease-free water.
- DNA Quantification and QC: Quantify using a high-sensitivity fluorescence assay. Assess fragment size distribution using a High-Sensitivity Bioanalyzer or TapeStation chip (peak expected at ~167 bp).
- RRBS Library Construction (Pre-Bisulfite): a. Restriction Digestion: Digest 1-30 ng cfDNA with MspI (20U) in NEBuffer 2 at 37°C for 6-8 hours. b. End Repair & A-tailing: Optional step; some protocols proceed directly to adapter ligation on native MspI ends. c. Methylated Adapter Ligation: Ligate pre-methylated, barcoded adapters to digested DNA using T4 DNA Ligase. Purify with magnetic beads (e.g., AMPure XP), using a 1.8x bead-to-sample ratio.
- Bisulfite Conversion: Convert the adapter-ligated DNA using a lightning/rapid low-input bisulfite kit (e.g., 14-cycle program: Denaturation 98°C, Incubation 64°C, optional Holding 4°C). Desulfonate and elute in a small volume (10-15 µL).
- Library Amplification: Perform limited-cycle PCR (e.g., 12-14 cycles) using a hot-start, methylation-aware polymerase (e.g., Pfu Turbo Cx) and primers complementary to the adapters. Use a high-fidelity polymerase to minimize errors.
- Final Library Purification and QC: Clean up PCR product with magnetic beads (0.9x ratio to remove long fragments and primer dimers). Quantify by qPCR or HS fluorescence. Check final library size (~150-350 bp) on a Bioanalyzer.
- Sequencing: Pool libraries and sequence on an Illumina platform. For RRBS, a 50-100bp single-end or paired-end run is typical. Aim for a minimum of 20-50 million reads per cfDNA sample.
- Bioinformatic Analysis:
a. Preprocessing: Trim adapters and low-quality bases using Trim Galore! (which incorporates Cutadapt) with
--rrbssetting. b. Alignment: Align reads to a bisulfite-converted reference genome using Bismark in--single-endor--paired-endmode. Deduplicate aligned reads. c. Methylation Calling: Extract methylation calls for each cytosine using thebismark_methylation_extractortool. d. Differential Analysis: Use tools likemethylKitorDSSto identify differentially methylated regions (DMRs) between case and control samples.
Workflow and Data Analysis Visualization
Title: cfDNA Methylation Analysis: WGBS vs. RRBS Workflow
Title: Bioinformatic Pipeline for cfDNA Bisulfite Data
Adapting WGBS and RRBS workflows for cfDNA analysis requires focused modifications in sample handling, library preparation, and sequencing depth. RRBS, with its lower input requirement and cost-efficiency, is often the more pragmatic choice for liquid biopsy applications, especially in longitudinal monitoring and early detection studies. The successful implementation of these protocols, followed by robust bioinformatic analysis, provides a powerful tool for discovering and tracking disease-associated methylation changes, directly contributing to advances in precision oncology and drug development. This application solidifies the role of DNA methylation analysis workflows as a cornerstone of modern liquid biopsy research.
Integrating Machine Learning for Predictive Biomarker Discovery and Classification
This document provides detailed application notes and protocols for the integration of machine learning (ML) into predictive biomarker discovery and classification workflows, specifically within the context of DNA methylation analysis from Whole-Genome Bisulfite Sequencing (WGBS) and Reduced Representation Bisulfite Sequencing (RRBS) data. The primary goal is to identify methylation signatures that can serve as diagnostic, prognostic, or predictive biomarkers for complex diseases, most notably in oncology and neurology. The convergence of high-throughput sequencing and advanced computational modeling enables the transition from correlative observations to robust, generalizable predictive models, accelerating translational research and drug development.
Core Application Notes:
- Feature Engineering is Critical: Raw methylation β-values or M-values require significant pre-processing. Key steps include filtering low-coverage CpGs, imputation of missing values, batch effect correction (e.g., using ComBat), and dimensionality reduction (e.g., via selecting differentially methylated regions (DMRs) or CpG islands). This creates a robust feature set for model training.
- Model Selection Depends on Context: The choice of ML algorithm depends on the sample size, feature dimensionality, and interpretability requirements.
- Elastic Net Regression: Preferred for high-dimensional data where feature selection (identifying key CpGs) is as important as prediction.
- Random Forests / XGBoost: Effective for capturing non-linear interactions between CpG sites with built-in feature importance metrics.
- Support Vector Machines (SVM): Powerful for classification tasks with clear margin separation in high-dimensional space.
- Deep Learning (e.g., CNNs, Autoencoders): Applied to discover higher-order patterns from raw sequence or methylation array data, though requiring larger datasets.
- Validation is Non-Negotiable: Rigorous validation using independent cohorts is essential. Nested cross-validation within the discovery cohort and testing on a held-out validation cohort mitigate overfitting. Performance metrics must extend beyond accuracy to include AUC-ROC, precision, recall, and F1-score, especially for imbalanced datasets.
- Biological Interpretation Drives Value: Post-model analysis, such as enrichment of top predictive features in gene pathways (e.g., via GREAT or LOLA tools) or regulatory regions, is crucial for establishing biological plausibility and translational potential.
Table 1: Performance Comparison of ML Models in Methylation-Based Biomarker Studies
| Study & Disease Context | Sequencing Method | ML Algorithm Used | Key Performance Metrics | Number of Predictive Features (CpGs/DMRs) Identified |
|---|---|---|---|---|
| Cancer Subtype Classification | RRBS | Random Forest | AUC: 0.97, Accuracy: 0.93 | ~150 DMRs |
| Early-Stage Disease Detection | WGBS | Elastic Net | Sensitivity: 0.89, Specificity: 0.94 | 45 CpG sites |
| Treatment Response Prediction | RRBS | SVM (RBF Kernel) | Precision: 0.87, Recall: 0.85 | 82 Methylation Loci |
| Prognostic Risk Stratification | WGBS | XGBoost | C-index: 0.81, AUC: 0.92 | ~200 Regions |
Table 2: Essential Pre-processing Steps for WGBS/RRBS Data Prior to ML
| Processing Step | Tool/Platform Example | Purpose | Key Parameters/Output |
|---|---|---|---|
| Read Alignment & Methylation Calling | Bismark, BS-Seeker2 | Map bisulfite-converted reads and extract per-CpG methylation counts. | Alignment rate, CpG coverage depth. |
| Quality Control & Filtering | MethylKit, SeqMonk | Remove low-coverage CpGs (<10X) and samples with high bisulfite failure rates. | Final set of high-quality CpG sites. |
| Batch Effect Correction | ComBat (in sva), RUVm | Adjust for technical variation from sequencing batch or plate. | Normalized methylation matrix. |
| Dimensionality Reduction | Limma, DMRcate | Identify differentially methylated positions (DMPs) or regions (DMRs). | List of significant DMPs/DMRs (FDR < 0.05). |
Experimental Protocols
Protocol 3.1: End-to-End Workflow for ML-Based Biomarker Discovery from RRBS Data
I. Sample Preparation & Sequencing (Wet Lab)
- Input: Genomic DNA (50-200 ng) from tissue or liquid biopsy.
- Restriction Digestion: Digest DNA with MspI (CpG-rich cutter). Size-select fragments (40-220 bp) representing CpG-rich regions.
- Bisulfite Conversion: Treat size-selected fragments using the EZ DNA Methylation-Lightning Kit. Convert unmethylated cytosines to uracil.
- Library Prep & Sequencing: Perform library construction with methylated adapters. Sequence on an Illumina platform to a minimum depth of 30-50 million reads per sample.
II. Bioinformatics Pre-processing (Dry Lab)
- Alignment: Use Bismark (v0.24.0). Trim adapters with Trim Galore! then align to a bisulfite-converted reference genome (e.g., GRCh38).
- Methylation Extraction: Run
bismark_methylation_extractorto generate per-CpG count files (methylated vs. unmethylated calls). - Data Compilation: Use MethylKit (R package) to read count files, unite coverage across samples, and create a matrix of percent methylation (β-values).
III. Machine Learning Pipeline (R/Python)
- Feature Matrix Creation: Filter CpGs with coverage >=10X in all samples. Convert β-values to M-values for statistical stability. Retain top 10,000 most variable CpGs or use DMRs from DMRcate.
- Train-Test Split: Split data (e.g., 70/30) stratified by outcome label. Crucial: Ensure no data leakage; perform all normalization and scaling after split, fitting on training data only.
- Model Training (Example: Random Forest in R):
- Validation & Interpretation: Predict on the held-out test set. Generate a confusion matrix and ROC curve. Extract variable importance (
varImp(rf_model)) to rank predictive CpGs/DMRs. - Biological Validation: Annotate top features to genes and perform pathway enrichment analysis (e.g., using clusterProfiler with KEGG/GO databases).
Diagrams and Visualizations
Title: ML-Driven Methylation Biomarker Discovery Workflow
Title: Core ML Training and Validation Pipeline
The Scientist's Toolkit: Research Reagent Solutions
Table 3: Essential Materials for ML-Integrated Methylation Biomarker Research
| Category | Item / Kit / Software | Function in Workflow | Key Notes |
|---|---|---|---|
| Wet-Lab Sequencing | EZ DNA Methylation-Lightning Kit (Zymo Research) | Rapid bisulfite conversion of genomic DNA. | Critical for high conversion efficiency (>99%). Essential for both WGBS and RRBS. |
| NEBNext RRBS Kit (NEB) | All-in-one solution for RRBS library preparation. | Standardizes digestion, size selection, and adapter ligation steps. | |
| Bioinformatics | Bismark Suite | Alignment and methylation extractor for bisulfite-seq data. | Industry standard. Handles both directional and non-directional libraries. |
| MethylSuite (MethylKit, DSS, etc.) | R/Bioconductor packages for methylation analysis and DMR calling. | Enables statistical analysis and feature matrix creation for ML input. | |
| Machine Learning | scikit-learn (Python) / caret (R) | Comprehensive libraries for building, training, and evaluating ML models. | Provide unified interfaces for algorithms like SVM, RF, and Elastic Net. |
| XGBoost | Optimized gradient boosting framework for structured/tabular data. | Often achieves state-of-the-art performance in classification tasks. | |
| Validation & Interpretation | PyMethylProcess / MethylPipe | Pipelines for reproducible methylation-based ML. | Automates preprocessing, modeling, and visualization. |
| GREAT / LOLA | Functional enrichment tools for genomic region annotation. | Provides biological context for identified predictive methylation marks. |
The translation of DNA methylation biomarkers from WGBS/RRBS research into clinical diagnostics requires rigorous, phased validation. This process moves from discovery in research cohorts to analytical validation and finally to clinical utility studies in intended-use populations. The following sections detail the critical considerations and protocols for this path.
Key Validation Milestones and Quantitative Benchmarks
Table 1: Phases of Clinical Biomarker Validation and Success Criteria
| Validation Phase | Primary Objective | Key Quantitative Metrics | Typical Sample Size Requirement | Common Study Design |
|---|---|---|---|---|
| Discovery & Pre-validation | Identify differential methylation signals associated with a condition. | Effect size (Δβ ≥ 0.2); Genome-wide significance (p < 1e-7). | 50-200 cases/controls. | Case-control, retrospective. |
| Assay Optimization | Develop a robust, specific, and reproducible assay (e.g., targeted bisulfite sequencing, qMSP). | Limit of Detection (LOD < 1% methylated allele), PCR Efficiency (90-110%). | N/A (technical replicates). | Analytical performance study. |
| Analytical Validation | Establish test performance characteristics in a CLIA-like environment. | Sensitivity/Specificity (>90%); Precision (CV < 10%); Reproducibility (>95% concordance). | 100-300 characterized samples. | Blinded testing of reference materials. |
| Clinical Validation | Evaluate test performance in the intended-use population. | Clinical Sensitivity/Specificity, PPV/NPV, AUC (>0.85 for diagnostic). | 300-1000+ subjects, powered for CI width. | Prospective or retrospective cohort. |
| Clinical Utility | Demonstrate test improves patient outcomes vs. standard of care. | Clinical outcomes (survival, therapy response), Change in clinical decision rate (>30%). | Large, multi-center trial. | Randomized controlled trial. |
Detailed Protocols for Key Validation Experiments
Protocol 1: Analytical Validation of a Targeted Methylation Assay (e.g., Bisulfite Amplicon Sequencing)
Objective: To rigorously determine the analytical sensitivity, specificity, precision, and limit of detection (LOD) of a candidate methylation biomarker assay.
Materials: Epigenetically characterized reference DNA (fully methylated/unmethylated), patient-derived DNA samples, bisulfite conversion kit, targeted PCR primers, high-fidelity polymerase, NGS library prep kit, sequencer.
Procedure:
- Sample Preparation: Create methylation dilution series (100%, 75%, 50%, 25%, 10%, 5%, 1%, 0% methylated DNA).
- Bisulfite Conversion: Convert 500 ng of each dilution and control DNA using a validated kit (e.g., EZ DNA Methylation-Lightning Kit). Include non-converted controls.
- Targeted PCR: Amplify regions of interest using primers designed for bisulfite-converted DNA. Perform in triplicate.
- Library Preparation & Sequencing: Pool amplicons, prepare NGS library, and sequence on a platform (e.g., Illumina MiSeq) to achieve >10,000x coverage per site.
- Bioinformatic Analysis: Align reads to bisulfite-converted reference. Calculate methylation percentage (reads with C / total reads) per CpG site per sample.
- Statistical Analysis:
- LOD: Identify the lowest methylation fraction where the signal is distinguishable from 0% with 95% confidence.
- Precision: Calculate Coefficient of Variation (CV) for methylation levels across replicates.
- Linearity: Assess R² of observed vs. expected methylation across the dilution series.
- Specificity: Verify no amplification in non-converted controls.
Protocol 2: Blinded Retrospective Clinical Validation Study
Objective: To evaluate the clinical sensitivity and specificity of a locked-down methylation biomarker assay using archived, clinically annotated samples.
Materials: Archived specimens (e.g., FFPE tissue, plasma) with linked clinical outcome data. IRB approval for use.
Procedure:
- Cohort Definition: Define inclusion/exclusion criteria matching the test's intended use. Obtain a statistically powered sample set (see Table 1). Randomize sample order.
- Blinding: A biostatistician or third party assigns a blinded ID to each sample. The lab team performing the assay is unaware of the clinical status.
- Assay Execution: Run the finalized assay (from Protocol 1) on all samples in the cohort over multiple days/runs to incorporate real-world variability.
- Data Collection: Record quantitative methylation results (e.g., methylation score, positive/negative call based on pre-set cutoff).
- Unblinding & Statistical Analysis: Link results to clinical truth. Generate:
- Contingency table (True Positive, False Positive, etc.).
- Sensitivity, Specificity, PPV, NPV with 95% confidence intervals.
- Receiver Operating Characteristic (ROC) curve and Area Under the Curve (AUC).
- Report: Document all procedures, results, and potential sources of bias.
Visualizing the Validation Pathway and Workflow
Title: Phased Pathway for Methylation Biomarker Clinical Validation
Title: Targeted Methylation Assay Workflow for Clinical Samples
The Scientist's Toolkit: Essential Research Reagents & Materials
Table 2: Key Reagent Solutions for Clinical Methylation Assay Development
| Reagent/Material | Function | Key Considerations for Clinical Validation |
|---|---|---|
| Bisulfite Conversion Kit | Converts unmethylated cytosines to uracil, leaving methylated cytosines intact. | Reproducibility, complete conversion efficiency, compatibility with sample type (e.g., FFPE, cfDNA), and minimal DNA degradation. |
| Methylated/Unmethylated Control DNA | Provides reference materials for assay calibration, sensitivity, and specificity testing. | Commercially sourced, fully characterized, and traceable. Used to construct standard curves and dilution series. |
| PCR Primers for Bisulfite-Converted DNA | Amplifies target regions of interest after conversion. | Specificity for converted sequence, avoidance of CpG sites in 3' end, optimized to minimize bias and ensure robust amplification. |
| High-Fidelity, Bias-Resistant Polymerase | Amplifies bisulfite-converted DNA for sequencing or qPCR. | Must handle uracil-rich templates and demonstrate minimal sequence bias to ensure accurate methylation quantification. |
| Digital PCR or NGS Library Prep Kit | Enables absolute quantification (dPCR) or high-throughput sequencing of targets. | For LOD studies (dPCR) or multi-locus panels (NGS). Requires validation for use with bisulfite-converted DNA. |
| Reference Standard with Known Methylation | A well-characterized sample or synthetic construct with known methylation levels at target loci. | Critical for inter-laboratory reproducibility studies and as a run control in clinical assays. |
| FFPE DNA Extraction Kit | Isols DNA from archived formalin-fixed, paraffin-embedded tissue, a common clinical source. | Optimized for fragmented, cross-linked DNA; must yield DNA compatible with bisulfite conversion. |
Conclusion
The analysis of WGBS and RRBS data is a powerful but multi-faceted process that bridges fundamental biology and clinical application. A successful workflow hinges on a clear understanding of the biological question, careful selection and execution of the computational pipeline, vigilant troubleshooting of technical artifacts, and rigorous validation of findings. As the field evolves, emerging technologies like EM-seq and long-read sequencing offer solutions to historical limitations of bisulfite treatment[citation:2][citation:4]. Furthermore, the integration of machine learning and multi-omics approaches is transforming methylation data from a descriptive output into a predictive engine for disease diagnosis, prognosis, and treatment[citation:3][citation:9]. Future progress will depend on standardizing analytical frameworks, improving computational efficiency for large cohorts, and successfully navigating the translational pathway to deliver reliable epigenetic biomarkers into routine clinical practice[citation:7][citation:10].