Decoding Tumor Evolution: A Comparative Analysis of CpG Island Methylation in Primary Tumors and Metastatic Sites
This article provides a comprehensive analysis of CpG island methylation dynamics between primary tumors and their metastatic counterparts.
Decoding Tumor Evolution: A Comparative Analysis of CpG Island Methylation in Primary Tumors and Metastatic Sites
Abstract
This article provides a comprehensive analysis of CpG island methylation dynamics between primary tumors and their metastatic counterparts. Aimed at researchers and drug development professionals, we explore the foundational role of DNA methylation in tumor progression, detailing current methodologies for comparative methylation profiling. We address common technical challenges in sample analysis and data interpretation, and critically evaluate validation strategies and comparative findings across cancer types. The synthesis highlights the potential of metastasis-specific methylation signatures as biomarkers and therapeutic targets, offering insights for precision oncology and epigenetic therapy development.
The Epigenetic Blueprint of Metastasis: Understanding CpG Island Dynamics in Cancer Progression
Defining CpG Islands and Their Canonical Role in Gene Silencing
CpG islands (CGIs) are genomic regions with a high frequency of cytosine-phosphate-guanine (CpG) dinucleotides relative to the bulk genome. The canonical definition, established by Gardiner-Garden and Frommer, specifies them as DNA sequences >200 base pairs (bp) with a G+C content >50% and an observed-to-expected CpG ratio >0.6. CGIs are predominantly found in the promoter and first exon regions of approximately 60-70% of human genes, particularly housekeeping and developmental regulator genes.
Within the context of a broader thesis on CpG island methylation in primary and metastatic sites, understanding CGI definition and function is foundational. Differential CGI methylation is a key epigenetic driver in cancer progression, with distinct patterns observed between primary tumors and their metastases, influencing tumor cell plasticity, immune evasion, and therapeutic resistance.
Canonical Role in Gene Silencing
The canonical role of unmethylated promoter-associated CGIs is to maintain a transcriptionally permissive state. They are typically bound by proteins containing CXXC domains (e.g., CFP1) that recruit histone-modifying complexes, promoting active histone marks (e.g., H3K4me3). Conversely, hypermethylation of these CGIs leads to stable, long-term transcriptional silencing via a well-characterized pathway:
- Methyl-CpG Binding Domain (MBD) Protein Recruitment: DNMT enzymes (DNMT1, DNMT3A/B) establish and maintain 5-methylcytosine (5mC) at CpG sites.
- Histone Deacetylase (HDAC) Recruitment: MBD proteins (e.g., MeCP2, MBD2) bind methylated CpGs and recruit HDAC-containing co-repressor complexes (e.g., Sin3a, NCoR).
- Chromatin Compaction: Deacetylation of histones results in a condensed, transcriptionally repressive chromatin structure (heterochromatin).
- Secondary Histone Modifications: This is often reinforced by repressive histone marks like H3K9me3 and H3K27me3, leading to stable gene silencing.
This process is critical in X-chromosome inactivation, genomic imprinting, and, pathologically, in the silencing of tumor suppressor genes (TSGs) in cancer.
Quantitative Data on CpG Islands in Human Genomics
Table 1: Genomic Distribution and Characteristics of Human CpG Islands
| Metric | Value | Notes |
|---|---|---|
| Total Number of CGIs | ~28,000 | In the human reference genome (hg38). |
| Percentage in Gene Promoters | ~60-70% | Associated with annotated transcription start sites (TSS). |
| Average CGI Length | ~1000 bp | Can range from 200 bp to several kilobases. |
| Genome-wide CpG Observed/Expected Ratio | ~0.2 | In bulk genomic DNA (CpG suppression). |
| CpG Observed/Expected Ratio within CGIs | >0.6 | Standard definition threshold. |
| Percentage of All CpGs in Genome within CGIs | ~7% | Despite their small genomic footprint. |
| Methylation Level in Normal Somatic Tissues | <10% | At unmethylated promoter CGIs in a tissue-inappropriate gene. |
| Methylation Level in Cancer (Silenced TSG Promoters) | >70% | Characteristic hypermethylation event. |
Table 2: Differential CGI Methylation in Primary vs. Metastatic Sites (Exemplar Data)
| Feature | Primary Tumor Site | Paired Metastatic Site | Implication |
|---|---|---|---|
| Global Hypermethylation | Moderate | Often Increased | Associated with worse prognosis, genomic instability. |
| Specific TSG Methylation | Present (e.g., MGMT, CDKN2A) | Frequently Enhanced/Novel | May drive clonal selection & metastatic adaptation. |
| Hypomethylation at Enhancer CGIs | Variable | Often Pronounced | Can activate oncogenic or EMT pathway genes. |
| Intra-tumoral Heterogeneity | High | Can be Higher or Clonal | Challenges biomarker consistency; indicates evolution. |
Experimental Protocols for CGI Methylation Analysis
Protocol 4.1: Bisulfite Conversion and Pyrosequencing for Targeted CGI Methylation Quantification
Objective: To quantitatively analyze methylation levels at specific CpG sites within a CGI. Workflow:
- DNA Extraction & Bisulfite Conversion: Isolate genomic DNA (500 ng) from primary/metastatic FFPE or frozen tissue. Treat with sodium bisulfite (e.g., EZ DNA Methylation Kit), which converts unmethylated cytosines to uracil, while methylated cytosines remain unchanged.
- PCR Amplification: Design PCR primers specific to the bisulfite-converted sequence of the target CGI, avoiding CpG sites. Amplify the region.
- Pyrosequencing: Use a sequencing primer internal to the PCR product. Dispense dNTPs (dATPαS, dCTP, dGTP, dTTP) sequentially. Incorporation releases pyrophosphate, triggering a chemiluminescent reaction quantified in a pyrogram. The C/T ratio at each CpG represents the proportion of methylated/unmethylated molecules.
- Analysis: Software (e.g., PyroMark Q24) calculates percentage methylation per CpG site. Average across sites for a regional score.
Protocol 4.2: Methylated DNA Immunoprecipitation Sequencing (MeDIP-seq) for Genome-wide CGI Methylation Profiling
Objective: To identify methylated genomic regions, including CGIs, across the genome. Workflow:
- DNA Fragmentation: Sonicate genomic DNA (1-5 µg) to 100-500 bp fragments.
- Immunoprecipitation: Incubate fragments with a monoclonal antibody specific for 5-methylcytosine (5mC). Capture antibody-DNA complexes using magnetic beads coupled to protein A/G.
- Wash and Elution: Stringently wash beads to remove non-specifically bound DNA. Elute the methylated DNA fraction.
- Library Preparation & Sequencing: Prepare next-generation sequencing libraries from input (control) and MeDIP-enriched DNA. Sequence on platforms like Illumina NovaSeq.
- Bioinformatics: Align sequences to a reference genome. Identify enriched regions (peaks) compared to input, denoting methylated areas. Annotate peaks overlapping CGI coordinates.
Signaling Pathways and Experimental Workflows
Diagram 1: CpG Island Methylation and Transcriptional Outcome (99 chars)
Diagram 2: MeDIP-seq Experimental Workflow (81 chars)
The Scientist's Toolkit: Research Reagent Solutions
Table 3: Essential Reagents and Kits for CGI Methylation Research
| Item | Function | Example Product/Supplier |
|---|---|---|
| Sodium Bisulfite Conversion Kit | Converts unmethylated C to U for downstream methylation-specific analysis. Critical for bisulfite sequencing/pyrosequencing. | EZ DNA Methylation Kit (Zymo Research), MethylEdge Kit (Promega). |
| Anti-5-Methylcytosine Antibody | For enrichment-based methods like MeDIP. Specificity and affinity are paramount for clean results. | Clone 33D3 (Invitrogen), Anti-5mC (Diagenode). |
| DNA Methyltransferases (DNMTs) & Inhibitors | Recombinant enzymes for in vitro methylation assays. Inhibitors (e.g., 5-Azacytidine) for functional demethylation studies. | Human DNMT1 (NEB); 5-Aza-2'-deoxycytidine (Sigma). |
| Methylated & Unmethylated Control DNA | Essential positive/negative controls for bisulfite conversion, PCR, and sequencing assays. | CpGenome Universal Methylated DNA (Merck). |
| Pyrosequencing System & Reagents | For quantitative, single-CpG resolution analysis post-bisulfite conversion. | PyroMark Q24 System & Reagents (Qiagen). |
| Next-Generation Sequencing Library Prep Kit | For constructing sequencing libraries from bisulfite-converted or MeDIP-enriched DNA. | Accel-NGS Methyl-Seq DNA Library Kit (Swift Biosciences). |
| Methylation-Specific PCR (MSP) Primers | Designed to discriminate methylated vs. unmethylated alleles after bisulfite conversion. Often custom-designed. | Available from multiple oligo synthesis vendors. |
| HDAC Inhibitors | Used in functional studies to probe the link between DNA methylation and histone deacetylation. | Trichostatin A (TSA), Vorinostat (SAHA). |
This whitepaper examines the dual dysregulation of DNA methylation in carcinogenesis, contextualized within broader research on CpG island methylation in primary tumors and metastatic sites. The concomitant global genomic hypomethylation and promoter-specific CpG island hypermethylation represent a fundamental epigenetic hallmark driving genomic instability, oncogene activation, and tumor suppressor silencing.
The cancer epigenome is characterized by a paradoxical redistribution of DNA methylation. While the bulk of the genome undergoes demethylation, leading to chromosomal instability, specific CpG-rich promoter regions of tumor suppressor genes (TSGs) become aberrantly hypermethylated and transcriptionally silenced. This duality is a critical focus in understanding tumor evolution from primary to metastatic sites.
Quantitative Landscape of Methylation Changes
Recent genome-wide studies quantify the scale and impact of these changes.
Table 1: Quantitative Metrics of Methylation Dysregulation in Solid Tumors
| Metric | Global Hypomethylation | Promoter-Specific Hypermethylation |
|---|---|---|
| Typical Change | 20-60% reduction in 5mC genome-wide | 5-10% increase in promoter 5mC density |
| Genomic Targets | Repetitive elements (LINE-1, Alu), introns, gene deserts | CpG islands (∼60% of gene promoters) |
| Affected Genes | Oncogenes, pro-metastatic genes (e.g., SNAIL, MMPs) | Tumor suppressor genes (e.g., MLH1, BRCA1, VHL), miRNAs |
| Impact | Chromosomal instability, reactivation of transposons, loss of imprinting | Transcriptional silencing, disrupted DNA repair, evasion of growth suppression |
| Detection Method | LUMA (Luminometric Methylation Assay), LINE-1 pyrosequencing | Methylation-Specific PCR (MSP), Bisulfite sequencing, MethylCap-seq |
Table 2: Methylation Comparison: Primary vs. Metastatic Sites
| Site | Global Methylation Status (LINE-1) | Promoter Hypermethylation Events | Clinical Correlation |
|---|---|---|---|
| Primary Tumor | Moderately hypomethylated (∼70-80% of normal) | Foundational TSG silencing established | Prognostic stratification |
| Matched Metastasis | Frequently further hypomethylated (∼60-75% of normal) | Often additional de novo events; some reversions observed | Therapy resistance, worse outcome |
| Circulating Tumor DNA (ctDNA) | Reflects tumor burden | Real-time monitoring of TSG silencing | Liquid biopsy for minimal residual disease |
Mechanistic Pathways and Functional Consequences
Title: Dual Methylation Dysregulation Drives Cancer Hallmarks
Detailed Experimental Protocols
Protocol: Genome-Wide Methylation Analysis (LUMA)
Objective: Quantify global 5-methylcytosine (5mC) levels.
- Genomic DNA Digestion: Digest 500 ng of DNA with methylation-sensitive (HpaII) and methylation-insensitive (MspI) isoschizomers separately.
- Pyrosequencing: Ligate a biotinylated sequencing adapter to the digested DNA. Perform pyrosequencing on a PyroMark Q96 MD system. The ratio of HpaII/MspI signals correlates with global methylation levels.
- Data Analysis: Calculate %5mC = (1 - (HpaII peak height / MspI peak height)) * 100. Use LINE-1 pyrosequencing as a surrogate validation.
Protocol: Methylation-Specific PCR (MSP) for Promoter Analysis
Objective: Detect hypermethylation in specific CpG islands.
- Bisulfite Conversion: Treat 1 µg genomic DNA with sodium bisulfite (e.g., EZ DNA Methylation-Gold Kit) converting unmethylated C to U, leaving methylated C unchanged.
- PCR Amplification: Design primer pairs specific for methylated (M) and unmethylated (U) sequences post-conversion.
- M-primers: Complement converted sequence retaining C at CpG sites.
- U-primers: Complement converted sequence with T at CpG sites.
- Gel Electrophoresis: Run PCR products on 2-3% agarose gel. Presence of an M-band indicates promoter methylation.
Protocol: Whole-Genome Bisulfite Sequencing (WGBS) Workflow
Objective: Single-base resolution methylome mapping for primary-metastasis comparison.
Title: WGBS Workflow for Methylome Comparison
The Scientist's Toolkit: Key Research Reagent Solutions
Table 3: Essential Reagents and Kits for Methylation Research
| Item (Supplier Examples) | Function & Application | Key Considerations |
|---|---|---|
| EZ DNA Methylation-Gold / Lightning Kits (Zymo Research) | High-efficiency bisulfite conversion. Critical for MSP, WGBS, and arrays. | Optimized for low input (≥100 pg), includes DNA protection buffer. |
| MethylMiner Methylated DNA Enrichment Kit (Invitrogen) | Immunoprecipitation of methylated DNA (MeDIP) using MBD2 protein. | For enrichment-based sequencing (MeDIP-seq). Less single-CpG resolution than bisulfite. |
| Infinium MethylationEPIC BeadChip (Illumina) | Array-based profiling of >850,000 CpG sites. Ideal for large cohort studies. | Covers enhancer regions; requires 250 ng bisulfite-converted DNA. |
| PyroMark PCR / Q24 Advanced Kits (Qiagen) | Reagents for pyrosequencing-based methylation quantification (e.g., LINE-1). | Provides quantitative % methylation at individual CpGs. |
| SssI Methyltransferase (NEB) | Positive control generation. Fully methylates all CpG sites in DNA. | Essential for validating assay sensitivity and specificity. |
| Methylated & Unmethylated Human Control DNA (MilliporeSigma) | Controls for bisulfite conversion, MSP, and sequencing. | Certified for use in diagnostic development. |
| Anti-5-methylcytosine Antibody (Diagenode, Abcam) | For MeDIP, dot-blot, or immunohistochemistry to visualize global 5mC. | Clone specificity (e.g., 33D3) affects performance in different applications. |
Therapeutic Implications and Drug Development
The methylation landscape presents dual targets: reversing promoter hypermethylation and stabilizing the hypomethylated genome. DNMT inhibitors (e.g., Azacitidine) are approved for myeloid malignancies but face challenges in solid tumors. Next-generation strategies include:
- Targeted DNMT inhibition using guide RNAs or fusion proteins.
- Combination therapies with HDAC inhibitors or immunotherapies.
- Emerging targets like TET enzymes to reactivate hypermethylated TSGs.
The interplay between global hypomethylation and focal hypermethylation evolves during metastatic progression. Longitudinal analysis of paired primary-metastasis samples using high-resolution techniques (WGBS, long-read sequencing) is crucial to identify:
- Metastasis-specific epimutations that could serve as biomarkers.
- Epigenetic plasticity enabling adaptation to new microenvironments.
- Therapeutic vulnerabilities unique to the metastatic epigenome.
Understanding this hallmark is fundamental for developing epigenetic diagnostics and therapies aimed at both primary and disseminated disease.
This whitepaper is framed within the broader thesis that CpG island methylation dynamics are a fundamental driver of the metastatic cascade, orchestrating phenotypic plasticity, immune evasion, and tissue-specific colonization. It posits that metastatic dissemination is not solely a genetic but a profoundly epigenetic process, where primary tumor cells acquire and maintain disseminated potential through reversible, heritable changes in gene expression, primarily mediated by DNA methylation and histone modifications.
Core Hypotheses
Hypothesis 1 (The Epigenetic Priming Hypothesis): Transient, heterogeneous epigenetic alterations in the primary tumor, particularly hypermethylation of CpG islands in promoters of metastasis suppressor genes (e.g., CDH1, CDKN2A), create a subpopulation of "primed" cells with enhanced invasive and migratory potential. Hypothesis 2 (The Epigenetic Plasticity Hypothesis): Dynamic methylation and demethylation events enable phenotypic switching (Epithelial-to-Mesenchymal Transition - EMT, and its reverse MET), allowing for dissemination and subsequent colonization. Hypothesis 3 (The Metastatic Niche Epigenetic Reprogramming Hypothesis): The microenvironment of distant organs induces epigenetic reprogramming in disseminated tumor cells (DTCs), aligning their gene expression profile with the new niche, a process driven by signals from stromal cells that alter the DTC's methylome. Hypothesis 4 (The Immune Editing via Methylation Hypothesis): Tumor cells evade immune detection in circulation and at secondary sites by silencing antigen presentation machinery (e.g., B2M, MHC Class I genes) and immune-activating ligands via promoter hypermethylation.
Key Data and Evidence
Recent studies provide quantitative support for these hypotheses. The data below summarizes findings from key publications (2019-2023).
Table 1: CpG Island Methylation Changes in Key Genes During Metastatic Progression
| Gene Symbol | Gene Function | Primary Tumor Avg. Methylation (%) | Matched Metastasis Avg. Methylation (%) | Change Direction | Associated Hypothesis | Key Study (Year) |
|---|---|---|---|---|---|---|
| CDH1 (E-cadherin) | Cell adhesion, suppressor of invasion | 25-40% | 60-80% | Increase | H1, H2 | Fernandez et al. (2022) |
| CDKN2A (p16) | Cell cycle regulator | 30-50% | 55-75% | Increase | H1 | Morris et al. (2021) |
| BRSK1 | Polarized cell migration | 15% | 45% | Increase | H1 | Nguyen et al. (2023) |
| HOXA10 | Developmental transcription factor | 70% | 25% | Decrease | H3 | Smith et al. (2020) |
| B2M (Beta-2-microglobulin) | MHC Class I component | 10-20% | 40-60% | Increase | H4 | Li et al. (2022) |
| CXCL12 | Chemokine for homing | 50% | 20% | Decrease | H3 | Patel et al. (2019) |
Table 2: Correlation Between Methylation Markers and Clinical Outcomes
| Epigenetic Biomarker (Methylation Status) | Cancer Type | Hazard Ratio (HR) for Metastasis-Free Survival (95% CI) | P-value | Assay Used | Reference |
|---|---|---|---|---|---|
| CDH1 Promoter (High) | Breast | 2.85 (2.10-3.87) | <0.001 | Pyrosequencing | Zhao et al. (2021) |
| 5-Gene Panel (APC, RASSF1A, etc.) | Colorectal | 3.42 (2.11-5.54) | <0.001 | MSP (Methylation-Specific PCR) | Wang et al. (2022) |
| TIMP3 (High) | Lung Adenocarcinoma | 0.55 (0.38-0.79) | 0.001 | MassARRAY EpiTYPER | Chen et al. (2023) |
| Global Methylation (LINE-1 Hypomethylation) | Prostate | 1.92 (1.30-2.83) | 0.001 | Bisulfite-PCR & Sequencing | Miller et al. (2020) |
Experimental Protocols
Protocol 1: Genome-Wide Methylation Profiling of Matached Primary-Metastasis Pairs Using Reduced Representation Bisulfite Sequencing (RRBS)
- Objective: To identify differentially methylated regions (DMRs) between primary tumors and their metastases.
- Procedure:
- Tissue Acquisition & DNA Extraction: Snap-frozen tissue from patient-matched primary tumor and metastatic site (e.g., liver, lung) is obtained. Genomic DNA is extracted using a column-based kit, assessing purity (A260/280 ~1.8) and integrity (Agilent Bioanalyzer).
- Restriction Digest: 100ng of genomic DNA is digested with the methylation-insensitive restriction enzyme MspI (cuts CCGG).
- End-Repair & Ligation: Fragments undergo end-repair, A-tailing, and ligation to methylated sequencing adapters.
- Bisulfite Conversion: Using the EZ DNA Methylation-Lightning Kit, DNA is treated with sodium bisulfite, converting unmethylated cytosines to uracils, while methylated cytosines remain unchanged.
- PCR Amplification & Size Selection: Converted DNA is PCR-amplified. Fragments of 40-220 bp (representing CpG-rich regions) are selected via gel extraction.
- Sequencing & Analysis: Libraries are sequenced on an Illumina platform. Reads are aligned to a bisulfite-converted reference genome. Methylation levels per CpG are calculated as #C/(#C+#T). DMRs are identified using software like DSS or MethylKit.
Protocol 2: Functional Validation of a Metastasis-Associated DMR Using CRISPR-dCas9 Epigenetic Editing
- Objective: To causally link a specific DMR to metastatic phenotypes.
- Procedure:
- sgRNA Design: Design two sgRNAs flanking the CpG island of interest (e.g., in the CDH1 promoter).
- Lentiviral Construct Assembly: Clone sgRNAs into a lentiviral vector expressing dCas9 fused to the catalytic domain of DNMT3A (for targeted methylation) or TET1 (for targeted demethylation).
- Cell Line Transduction: Transduce a lowly metastatic cell line (for gain-of-function) or a highly metastatic line (for loss-of-function) with the lentivirus. Include controls (dCas9 only).
- Validation of Targeted Editing: After selection, perform bisulfite pyrosequencing across the target region to confirm site-specific methylation changes.
- Phenotypic Assays:
- Invasion: Matrigel-coated transwell assay. Count cells invading after 24-48 hours.
- Colonization: Tail-vein injection of edited cells into immunodeficient mice. Quantify lung/liver metastatic burden after 6-8 weeks via bioluminescence or histology.
Visualization
Diagram Title: Epigenetic Hypotheses in the Metastatic Cascade
Diagram Title: RRBS Workflow for Primary-Metastasis Analysis
The Scientist's Toolkit: Key Research Reagent Solutions
Table 3: Essential Reagents and Kits for Metastasis Epigenetics Research
| Item Name | Supplier (Example) | Function in Research | Key Application in Hypotheses Testing |
|---|---|---|---|
| EpiTect Fast DNA Bisulfite Kit | Qiagen | Efficient conversion of unmethylated cytosines to uracil for downstream methylation analysis. | Foundational for all bisulfite-based methylation detection (qMSP, pyrosequencing, NGS). |
| MethylMiner Methylated DNA Enrichment Kit | Thermo Fisher | Immunoprecipitation of methylated DNA using MBD2 protein. | Enrichment for methylated CpGs prior to sequencing (MeDIP-seq) to identify hypermethylated regions (H1, H4). |
| EZ DNMTase / EZ TET1 Activity Assay Kits | Zymo Research | Colorimetric/fluorometric measurement of enzymatic activity of DNMTs or TET proteins. | Quantifying global epigenetic enzyme activity changes in metastatic vs. primary cells. |
| CRISPR/dCas9-DNMT3A-EGFP All-in-One Lentivector | Sigma-Aldrich (ToolGen) | Targeted de novo DNA methylation at specific genomic loci for loss-of-function studies. | Functional validation of H1 (e.g., silencing CDH1 in vitro). |
| ChIP-Validated Anti-H3K27me3 Antibody | Cell Signaling Technology | Chromatin immunoprecipitation of trimethylated histone H3 lysine 27, a repressive mark. | Investigating interplay between DNA methylation and histone modifications in DTC dormancy (H3). |
| Human PrimePan TGF-β1 | STEMCELL Technologies | Recombinant TGF-β1 cytokine to induce EMT in vitro. | Modeling phenotypic plasticity (H2) and assessing its effect on the methylome. |
| Matrigel Basement Membrane Matrix | Corning | Extract for coating transwell inserts to create a barrier for invasion assays. | Functional assay for invasive potential following epigenetic manipulation (H1, H2). |
| NucleoBond HMW DNA Kit | Macherey-Nagel | Isolation of high molecular weight, inhibitor-free genomic DNA from tissue. | Critical for long-read sequencing approaches (PacBio, Nanopore) to study haplotype-specific methylation. |
Within the broader thesis on CpG island methylation in cancer progression, this whitepaper provides a technical analysis of epigenetic divergence between primary tumors and their metastatic derivatives. The methylation landscape is a critical determinant of cellular identity, transcriptional programs, and therapeutic response, making its comparative mapping essential for understanding metastatic evolution and resistance mechanisms.
Core Concepts and Differential Methylation Patterns
Metastasis is an epigenetically selective process. Metastatic clones often exhibit methylation profiles distinct from the bulk primary tumor, driven by evolutionary pressures in the tumor microenvironment (TME) of secondary sites. Key differentially methylated regions (DMRs) frequently involve promoters of metastasis-suppressor genes, cell-adhesion molecules, and developmental pathway regulators.
| Genomic Feature | Typical State in Primary Tumor | Typical State in Metastatic Site | Associated Functional Consequence |
|---|---|---|---|
| CpG Island Promoters | Variable, often focal hypermethylation | Increased global hypermethylation burden | Transcriptional silencing of tumor suppressors |
| Shore/Shell Regions | Moderate hypomethylation | Significant hypomethylation | Genomic instability, oncogene activation |
| Polycomb Repressive Complex 2 (PRC2) Targets | Bivalent chromatin (H3K4me3/H3K27me3) | Stable repression via DNA hypermethylation | Locked-in de-differentiation state |
| LINE-1 Elements | ~70-85% methylation | ~60-75% methylation (hypomethylation) | Chromosomal instability, altered transcription |
| EMT-related Gene Promoters | Variable methylation | Consistent hypermethylation of epithelial genes | Sustained mesenchymal phenotype, invasiveness |
Table 2: Quantitative Data from Representative Studies
| Cancer Type | Sample Size (P/M) | Avg. % of DMRs Hypermethylated in Metastasis | Key Hypermethylated Gene(s) in Metastasis | Technology Used |
|---|---|---|---|---|
| Colorectal Cancer | 45 / 45 | 15.3% | CDH1 (E-cadherin), TIMP3 | Whole-genome bisulfite sequencing |
| Prostate Cancer | 30 / 30 | 22.1% | GSTP1, APC, RASSF1A | EPIC 850K array |
| Breast Cancer | 50 / 50 | 18.7% | ESR1, CST6, BCL2 | Reduced Representation Bisulfite Sequencing |
| Melanoma | 20 / 20 | 12.5% | TNFRSF10D, SOCS1 | Targeted bisulfite sequencing |
Experimental Protocols for Comparative Methylation Analysis
Protocol 1: DNA Extraction and Bisulfite Conversion from Formalin-Fixed Paraffin-Embedded (FFPE) Tissue Cores
Objective: To obtain high-quality bisulfite-converted DNA from matched primary and metastatic FFPE samples.
- Macrodissection: Cut 5-10 μm sections. Stain with methylene blue and microdissect tumor areas with >70% cellularity.
- DNA Extraction: Use the QIAamp DNA FFPE Tissue Kit (Qiagen). Deparaffinize with xylene, wash with ethanol. Digest with Proteinase K at 56°C for 3 hours. Bind DNA, wash, and elute in 40 μL AE buffer.
- DNA Quantification: Use Qubit dsDNA HS Assay.
- Bisulfite Conversion: Use the EZ DNA Methylation-Lightning Kit (Zymo Research). Incubate 500 ng DNA in Lightning Conversion Reagent (98°C for 8 min, 54°C for 60 min). Desulphonate, wash, and elute in 20 μL M-Elution Buffer. Store at -80°C.
Protocol 2: Genome-Wide Methylation Profiling Using the Infinium EPIC 850K BeadChip
Objective: Interrogation of >850,000 CpG sites across matched pairs.
- Amplification: Amplify 250 ng of bisulfite-converted DNA using the Infinium HD Assay Methylation Protocol. Perform isothermal amplification (37°C, 20-24 hours).
- Fragmentation & Precipitation: Fragment amplified DNA with enzymes. Precipitate with 2-propanol, resuspend in RA1 buffer.
- Hybridization: Apply to EPIC BeadChip. Hybridize at 48°C for 16-20 hours.
- Single-Base Extension & Staining: Perform extension with labeled nucleotides. Stain chip.
- Imaging: Scan the BeadChip using an iScan System.
- Data Processing: Use
minfiR package for IDAT file import, normalization (e.g., SWAN), and β-value calculation (β = M/(M+U+100)).
Protocol 3: Validation by Pyrosequencing
Objective: Quantitative validation of DMRs identified from array/sequencing.
- PCR Design: Design primers using PyroMark Assay Design Software 2.0. One primer is biotinylated.
- PCR Amplification: Perform PCR in a 50 μL reaction with HotStarTaq Plus Master Mix. Verify amplicon on agarose gel.
- Pyrosequencing Preparation: Bind 20 μL PCR product to Streptavidin Sepharose HP beads. Denature, wash, and anneal sequencing primer.
- Run on Pyrosequencer: Use PyroMark Q96 ID instrument with appropriate dispensation order. Analyze results in PyroMark Q96 software, obtaining % methylation per CpG.
Signaling Pathways in Methylation-Driven Metastasis
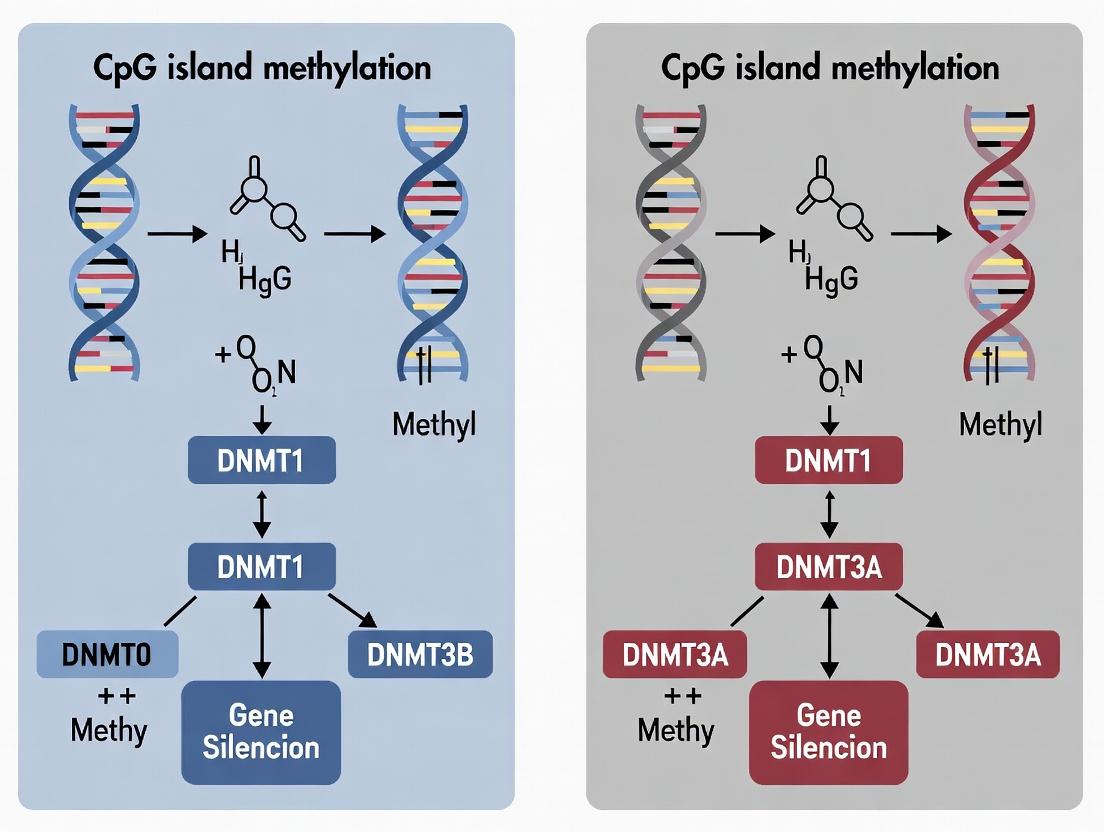
Title: Epigenetic silencing pathway in metastasis.
Experimental Workflow for Comparative Analysis
Title: Core workflow for methylation comparison.
The Scientist's Toolkit: Research Reagent Solutions
| Item / Reagent | Supplier (Example) | Function in Research |
|---|---|---|
| QIAamp DNA FFPE Tissue Kit | Qiagen | High-yield DNA extraction from archival FFPE samples. |
| EZ DNA Methylation-Lightning Kit | Zymo Research | Rapid, complete bisulfite conversion of DNA. |
| Infinium MethylationEPIC 850K BeadChip Kit | Illumina | Genome-wide methylation profiling of 850K+ CpG sites. |
| PyroMark PCR & Q96 ID Kit | Qiagen | Quantitative methylation analysis at single-CpG resolution. |
| Methylation-Specific PCR (MSP) Primers | Custom (e.g., Sigma) | Rapid, sensitive detection of methylation at specific loci. |
| DNMT Inhibitors (e.g., 5-Azacytidine) | Selleckchem | Functional validation of methylation-dependent gene silencing. |
| Anti-5-Methylcytosine Antibody | Abcam | Immunohistochemical detection of global methylation levels. |
| Methylated & Unmethylated Control DNA | MilliporeSigma | Bisulfite conversion and assay positive/negative controls. |
R minfi / DSS Packages |
Bioconductor | Bioinformatics analysis of array and sequencing data. |
| NucleoBond HP Plasmid Kit | Macherey-Nagel | For cloning bisulfite sequencing PCR products. |
The comparative methylation landscape between primary and metastatic tumors reveals a dynamic and often more aggressive epigenetic state in metastases. This evolution involves hypermethylation-mediated silencing of critical regulatory pathways, locked in by the cooperation of histone marks and DNA methylation. For drug development professionals, these sites represent potential targets for epigenetic therapies (e.g., DNMT inhibitors) and biomarkers for predicting metastatic potential and monitoring treatment response in liquid biopsies. Future research must focus on single-cell methylome analyses to deconvolute intra-tumor heterogeneity and identify the true metastatic precursor cells within the primary tumor.
Driver vs. Passenger Methylation Events in Tumor Evolution
The systematic analysis of CpG island (CGI) methylation patterns across primary tumors and their metastatic derivatives is pivotal for deciphering the evolutionary history of cancer. Within this context, a critical distinction emerges between driver and passenger methylation events. Driver methylation refers to epigenetic alterations, typically the hypermethylation of CGI-associated tumor suppressor gene promoters, that confer a selective growth advantage, are causally involved in oncogenesis, and are subject to positive selection during tumor evolution. Conversely, passenger methylation comprises widespread, stochastic epigenetic changes that accumulate due to global dysregulation of the methylation machinery (e.g., DNMT upregulation) but do not directly contribute to tumor fitness. Disentangling these events is essential for identifying therapeutic targets, understanding metastatic competency, and developing epigenetic biomarkers with prognostic and predictive value.
Distinguishing Features and Quantitative Data
Key differentiating characteristics between driver and passenger methylation events are summarized in the table below.
Table 1: Comparative Analysis of Driver vs. Passenger Methylation Events
| Feature | Driver Methylation | Passenger Methylation |
|---|---|---|
| Functional Impact | Causally contributes to tumorigenesis; confers selective advantage. | Neutral; no direct contribution to tumor fitness. |
| Genomic Location | Highly specific, often at promoters of genes in key pathways (e.g., DNA repair, cell adhesion). | Widespread, stochastic, enriched in gene bodies and intergenic regions. |
| Selective Pressure | Positively selected; recurrent across tumors and metastatic sites. | Neutral; reflects epigenetic instability. |
| Temporal Occurrence | Often early, clonal events in primary tumor evolution. | Can be clonal or subclonal, accumulating over time. |
| Conservation in Metastasis | Highly conserved from primary to metastatic lesions. | Less conserved; divergence between primary and metastatic sites. |
| Association with CGI | Strongly associated with CGI promoters ("CpG Island Methylator Phenotype" - CIMP subsets). | Less specific to CGI promoters. |
| Example Genes/Regions | MLH1, CDKN2A (p16), MGMT, BRCA1, VHL. | LINE-1, SATα repeats (though hypomethylation here can be a driver). |
Quantitative data from integrative genomic-epigenomic studies further illustrate these differences:
Table 2: Representative Quantitative Data from Metastasis Evolution Studies
| Study Focus | Primary Tumor Mean Methylation Variance | Metastatic Site Mean Methylation Variance | % Driver Events (Clonal & Conserved) | % Passenger Events (Divergent) | Key Technology |
|---|---|---|---|---|---|
| Colorectal Cancer (Liver Mets) | 12.5% (high-variance loci) | 10.8% (high-variance loci) | ~8-15% of differentially methylated regions (DMRs) | ~85-92% of DMRs | Whole-genome bisulfite sequencing (WGBS) |
| Prostate Cancer (Multi-site Mets) | - | - | ~5% of hypermethylated CGIs (e.g., GSTP1) conserved | >70% of methylation changes subclonal | EPIC array, targeted bisulfite sequencing |
| Breast Cancer (Brain Mets) | CIMP+ subtype: 45% loci methylated | CIMP+ subtype: 42% loci methylated | Clonal driver methylation highly conserved | Significant divergence in non-CGI shores/shelves | Reduced Representation Bisulfite Sequencing (RRBS) |
Experimental Protocols for Identification and Validation
Protocol 1: Identification of Conserved Driver Methylation Events in Matched Primary-Metastasis Pairs
- Sample Collection & DNA Extraction: Obtain fresh-frozen or FFPE tissue from primary tumor and one or more metastatic sites from the same patient. Extract high-molecular-weight DNA using a column-based kit with proteinase K digestion for FFPE.
- Genome-wide Methylation Profiling: Perform Infinium MethylationEPIC (EPIC) array or Whole-Genome Bisulfite Sequencing (WGBS).
- Bisulfite Conversion: Treat 500ng DNA using the EZ DNA Methylation-Lightning Kit, ensuring >99% conversion efficiency (assessed via control loci).
- EPIC Array: Follow standard Illumina protocol for hybridization, staining, and scanning on an iScan system.
- WGBS: Prepare libraries using a post-bisulfite adapter tagging (PBAT) method. Sequence on a NovaSeq platform for >30x coverage.
- Bioinformatic Analysis:
- Preprocessing: For arrays, use minfi R package for normalization and background correction. For WGBS, align reads with Bismark and call methylation states with MethylKit.
- Differential Methylation: Identify differentially methylated CpGs (DMCs) and regions (DMRs) between tumor and normal, and between primary and metastasis.
- Clonality & Conservation: Use beta-value distributions and hierarchical clustering. Driver candidates are clonal (present in most cells of the primary) and conserved (similar methylation level in metastasis). Passenger events show heterogeneity.
- Functional Enrichment: Annotate conserved DMRs to gene promoters. Perform pathway enrichment analysis (GO, KEGG) using tools like GREAT or clusterProfiler.
- Validation: Perform pyrosequencing or droplet digital PCR (ddPCR) methylation assays on the same sample set for top candidate driver DMRs (e.g., promoter of a tumor suppressor). Design primers specific for bisulfite-converted DNA.
Protocol 2: Functional Validation of a Putative Driver Methylation Event
- In Vitro Demethylation: Treat a cancer cell line harboring the hypermethylated candidate gene with 5-Aza-2'-deoxycytidine (Decitabine). Protocol: Culture cells in 6-well plates. Treat with 1µM Decitabine for 72 hours, refreshing media and drug every 24 hours. Include DMSO vehicle control.
- Post-Treatment Analysis:
- Methylation Validation: Extract DNA post-treatment and analyze target locus methylation via pyrosequencing.
- Gene Expression: Extract RNA, synthesize cDNA, and perform qRT-PCR for the candidate gene. Use GAPDH as housekeeping control. Calculate fold-change (2^-ΔΔCt) vs. control.
- Phenotypic Assays: Perform functional assays relevant to the gene's function (e.g., proliferation assay by MTT, apoptosis assay by flow cytometry with Annexin V staining, invasion assay using Matrigel-coated Transwells).
- Causal Link Establishment: Correlate demethylation, gene re-expression, and phenotypic reversal (e.g., reduced proliferation/invasion). This supports a driver role.
Visualizing Concepts and Workflows
Title: Tumor Evolution with Driver and Passenger Methylation
Title: Workflow for Identifying Driver Methylation Events
The Scientist's Toolkit: Key Research Reagent Solutions
Table 3: Essential Reagents and Kits for Methylation Driver-Passenger Research
| Item Name | Vendor Examples | Function/Brief Explanation |
|---|---|---|
| EZ DNA Methylation-Lightning Kit | Zymo Research | Rapid, complete bisulfite conversion of DNA for downstream methylation analysis. Critical for array and sequencing prep. |
| Infinium MethylationEPIC (850k) BeadChip Kit | Illumina | Industry-standard array for cost-effective, reproducible profiling of >850,000 CpG sites, including CGI, enhancers, and intergenic regions. |
| TrueMethyl OxBS & PBAT Kits | Cambridge Epigenetix / Diagenode | Enables sequential oxidation and bisulfite treatment or post-bisulfite adapter tagging for accurate 5mC/5hmC discrimination and WGBS. |
| QIAamp DNA FFPE Tissue Kit | Qiagen | Robust DNA extraction from challenging FFPE archival tissues, common in metastasis studies. Includes deparaffinization and proteinase K steps. |
| PyroMark PCR & Q24 Advanced Kits | Qiagen | Complete solution for designing, amplifying, and quantitatively analyzing bisulfite-converted DNA via pyrosequencing for validation. |
| ddPCR Methylation Assay Probes | Bio-Rad | Design TaqMan probe assays for methylation-specific ddPCR, allowing absolute quantification of methylated alleles with high sensitivity. |
| 5-Aza-2'-deoxycytidine (Decitabine) | Sigma-Aldrich | DNMT inhibitor used for in vitro demethylation experiments to functionally test causality of hypermethylation events. |
| Methylated & Unmethylated Human Control DNA | MilliporeSigma | Essential controls for bisulfite conversion efficiency, assay calibration, and ensuring specificity of methylation detection methods. |
From Bench to Bioinformatics: Profiling Methylation in Paired Primary-Metastasis Samples
Within the context of investigating CpG island methylation profiles in tumor progression, the acquisition of high-quality, matched primary and metastatic tissues is a foundational and critical step. This guide provides a detailed technical and ethical framework for procuring these biospecimens, which are essential for elucidating epigenetic drivers of metastasis and identifying potential therapeutic targets.
Ethical and Regulatory Framework
Procuring matched tissues necessitates rigorous adherence to ethical principles and regulatory guidelines.
- Informed Consent: Consent must be specific, allowing for the collection of both primary and subsequent metastatic tissues, genomic/epigenetic analysis, and future research use. Dynamic consent models are recommended for long-term studies.
- IRB/EC Protocol: The study must be approved by an Institutional Review Board or Ethics Committee. Protocols should detail methods for identifying metastatic events (e.g., imaging, biopsy for clinical care) and subsequent tissue acquisition.
- Privacy (GDPR, HIPAA): All patient data must be de-identified. A coded system linking samples to clinical data should be maintained with strict access controls.
- Return of Results: Policies must be established regarding whether and how incidental findings from methylation analysis will be handled and communicated to patients or their physicians.
Procedural Workflow for Sample Acquisition
The following diagram outlines the integrated workflow from patient identification to nucleic acid extraction, highlighting critical decision points.
Title: Workflow for Procuring Matched Primary and Metastatic Tissues
Key Technical Considerations & Protocols
Tissue Collection and Processing
Rapid and standardized processing is vital to preserve methylation patterns.
Protocol: Intraoperative Tissue Collection for Methylation Analysis
- Immediate Transfer: Transport fresh tissue from the operating room to pathology on ice (within 20 minutes).
- Gross Assessment: A certified pathologist identifies and dissects the tumor, ensuring >70% tumor cellularity and selecting adjacent normal tissue.
- Tissue Allocation: Divide the sample into three aliquots:
- Aliquot 1 (Snap-Freeze): Embed in Optimal Cutting Temperature (OCT) compound or place in cryovial. Submerge in liquid nitrogen or a dry ice/isopentane slurry for 1 minute. Store at -80°C or in liquid nitrogen vapor phase.
- Aliquot 2 (FFPE Block): Fix in 10% neutral buffered formalin for 18-24 hours at room temperature. Process through graded alcohols and xylene, then embed in paraffin.
- Aliquot 3 (Stabilization): Preserve in a commercial nucleic acid stabilization buffer (e.g., RNAlater) at 4°C overnight, then store at -80°C.
- Metastatic Biopsy: For core needle biopsies, the entire sample should be processed as one aliquot (prioritizing snap-freezing or stabilization).
Nucleic Acid Extraction for Methylation Analysis
High-molecular-weight, contaminant-free DNA is required for bisulfite conversion and sequencing.
Protocol: DNA Extraction from Snap-Frozen Tissues for Bisulfite Sequencing
- Cryosectioning: Cut 5-10 x 20µm sections from the OCT block onto glass slides. Stain with H&E to confirm tumor content via laser capture microdissection (LCM) or proceed to scrape the entire section if tumor purity is high.
- Lysis: Digest tissue in a proteinase K buffer (e.g., 400 µg/mL) with 1% SDS at 56°C overnight.
- Purification: Perform phenol-chloroform-isoamyl alcohol extraction, followed by ethanol precipitation. Alternatively, use a commercial column-based kit designed for bisulfite conversion compatibility.
- Assessment: Quantify DNA using a fluorometric assay (e.g., Qubit). Assess purity (A260/A280 ~1.8-2.0) and integrity via agarose gel electrophoresis or Fragment Analyzer (DV200 > 50% for FFPE).
Table 1: Comparison of Tissue Acquisition Methods for Methylation Studies
| Method | Advantages | Disadvantages | Best Use for Methylation Analysis |
|---|---|---|---|
| Snap-Frozen | Preserves native nucleic acids, excellent for whole-genome bisulfite sequencing (WGBS). | Requires immediate processing, specialized storage. | Gold standard for discovery-phase, high-resolution profiling (e.g., WGBS, RRBS). |
| FFPE | Routine in clinics, stable at room temp, linked to rich clinical data. | DNA is cross-linked/fragmented; requires repair steps. | Validation studies, large retrospective cohorts with long-term follow-up. |
| Stabilization Buffer | Stabilizes RNA/DNA at room temp for days, good for multi-omics. | Can inhibit some enzymatic reactions if not removed. | Multi-institutional studies with variable transport logistics. |
The Scientist's Toolkit: Research Reagent Solutions
Table 2: Essential Materials for Matched Tissue Methylation Studies
| Item | Function | Example Product/Catalog |
|---|---|---|
| Laser Capture Microdissection (LCM) System | Precisely isolates pure tumor or stromal cells from heterogeneous tissue sections to avoid confounding signals. | ArcturusXT LCM System, Leica LMD7. |
| DNA Extraction Kit (Bisulfite-compatible) | Purifies high-quality DNA without carrying over contaminants that inhibit bisulfite conversion. | QIAamp DNA FFPE Tissue Kit, Zymo Research Quick-DNA Miniprep Plus Kit. |
| Bisulfite Conversion Kit | Converts unmethylated cytosines to uracils while leaving 5-methylcytosines intact, enabling methylation detection. | EZ DNA Methylation-Lightning Kit (Zymo), EpiTect Fast DNA Bisulfite Kit (Qiagen). |
| Methylation Array Platform | For genome-wide profiling of CpG sites; ideal for screening many matched pairs. | Illumina Infinium MethylationEPIC v2.0 BeadChip. |
| Targeted Bisulfite Sequencing Panel | For deep, cost-effective sequencing of candidate regions (e.g., CpG islands) in large cohorts. | Agilent SureSelectXT Methyl-Seq, Twist Bioscience NGS Methylation Detection System. |
| Digital Droplet PCR (ddPCR) Probe Assays | Absolute quantification of allele-specific or locus-specific methylation with high sensitivity in limited samples. | Bio-Rad ddPCR Methylation Assay probes. |
Data Integration and Analysis Pathway
Integrating methylation data from matched sites requires a specific analytical pipeline to identify metastasis-specific changes.
Title: Data Analysis Pathway for Matched Tissue Methylation
In the context of cancer research, particularly studies investigating CpG island methylation patterns in primary tumors versus metastatic sites, genome-wide DNA methylation analysis is indispensable. DNA methylation, primarily at cytosine residues in CpG dinucleotides, is a key epigenetic regulator of gene expression. Aberrant methylation, especially the hypermethylation of CpG island promoters in tumor suppressor genes, is a hallmark of cancer progression and metastasis. Bisulfite sequencing is the gold-standard technique for detecting 5-methylcytosine (5mC) at single-base resolution. This guide details the two principal genome-wide bisulfite sequencing approaches: Whole-Genome Bisulfite Sequencing (WGBS) and Reduced Representation Bisulfite Sequencing (RRBS), framing them within a metastatic research thesis.
Core Principles of Bisulfite Conversion
Sodium bisulfite treatment deaminates unmethylated cytosine to uracil, while 5-methylcytosine remains unchanged. During subsequent PCR amplification, uracil is read as thymine, allowing methylated (C) and unmethylated (T) positions to be distinguished by sequencing.
Technical Approaches: WGBS vs. RRBS
Whole-Genome Bisulfite Sequencing (WGBS) provides comprehensive, unbiased coverage of ~90% of all CpGs in the genome. It is the most complete method but requires high sequencing depth, making it costly. Reduced Representation Bisulfite Sequencing (RRBS) uses restriction enzymes (commonly MspI) to enrich for CpG-rich regions, including most CpG islands and promoters. It offers a cost-effective, high-resolution view of functionally relevant regions.
Table 1: Comparison of WGBS and RRBS for Metastatic Research
| Parameter | Whole-Genome Bisulfite Sequencing (WGBS) | Reduced Representation Bisulfite Sequencing (RRBS) |
|---|---|---|
| Genome Coverage | ~90% of CpGs, genome-wide | ~2-5% of CpGs; enrichment in CpG islands, promoters, shores |
| Typical Sequencing Depth | 30x - 100x | 10x - 30x (for enriched regions) |
| Approx. Cost per Sample | $2,000 - $5,000 (USD) | $800 - $2,000 (USD) |
| DNA Input Required | 50 - 200 ng (post-bisulfite) | 10 - 100 ng |
| Ideal Application in Metastasis Research | Discovery of novel methylation events genome-wide, including intergenic regions and enhancers | Focused, cost-effective profiling of known regulatory regions across many patient-matched primary/metastasis samples |
| Key Limitation | High cost and data complexity | Bias towards MspI fragments; misses low-CpG-density regions |
Detailed Experimental Protocols
RRBS Protocol for Limited Clinical Samples
This protocol is optimized for frozen or FFPE tissue from primary and metastatic sites.
- DNA Extraction & Quality Control: Use a silica-column or magnetic bead-based kit. Assess integrity via agarose gel or Bioanalyzer. Input: 10-100 ng high-quality DNA.
- Restriction Digestion: Digest DNA with MspI (recognition site: CCGG) at 37°C for 8-16 hours. MspI cuts regardless of CpG methylation, enriching for CpG-rich sequences.
- End-Repair & A-Tailing: Repair ends using Klenow fragment and dATP to create adenine-overhangs for adapter ligation.
- Adapter Ligation: Ligate methylated Illumina adapters (methylated to preserve strand specificity post-bisulfite treatment) to the fragments.
- Bisulfite Conversion: Use a commercial bisulfite conversion kit (e.g., Zymo EZ DNA Methylation-Lightning). Incubate adapter-ligated DNA in bisulfite solution (cycling: 98°C for 10 min, 64°C for 2.5 hours). Desulfonate and elute.
- PCR Amplification: Amplify libraries with a high-fidelity, bisulfite-converted DNA-friendly polymerase (e.g., Pfu Turbo Cx Hotstart). Use 10-12 cycles.
- Library Purification & Size Selection: Perform double-sided SPRI bead cleanup to select fragments ~150-400 bp.
- Sequencing: Sequence on Illumina platform (e.g., NovaSeq 6000) using 150 bp paired-end reads to ensure adequate coverage.
WGBS Library Preparation Protocol
- DNA Fragmentation: Fragment 100-500 ng genomic DNA via sonication (Covaris) to ~300 bp.
- End-Repair, A-Tailing, and Adapter Ligation: As in RRBS, but using methylated adapters compatible with bisulfite conversion.
- Bisulfite Conversion: Convert the entire library using a rigorous kit (e.g., Qiagen EpiTect Fast). Two consecutive conversion cycles are sometimes used for >99.5% efficiency.
- Library Amplification & Cleanup: Amplify with 8-10 PCR cycles and purify.
Data Analysis Workflow
The primary analysis involves aligning bisulfite-converted reads to a reference genome using dedicated aligners (e.g., Bismark, BS-Seeker2) that perform in-silico bisulfite conversion of the reference. Key metrics include:
- Conversion Rate: >99% from non-CpG cytosines (internal control).
- Coverage Depth: Mean coverage per CpG (see Table 1).
- Differential Methylation Analysis: Using tools like methylKit or DSS to identify differentially methylated regions (DMRs) between primary and metastatic samples.
Diagram: Bisulfite Sequencing Data Analysis Pipeline
The Scientist's Toolkit: Essential Research Reagents & Kits
Table 2: Key Reagent Solutions for Bisulfite Sequencing Studies
| Item | Function & Rationale | Example Product |
|---|---|---|
| Methylated Adapters | Illumina-compatible adapters with methylated cytosines to prevent denaturation during bisulfite conversion, preserving library complexity. | Illumina TruSeq DNA Methylation Indexed Adapters |
| High-Efficiency Bisulfite Kit | Chemical conversion kit with high recovery (>80%) and conversion efficiency (>99.5%), critical for low-input samples. | Zymo Research EZ DNA Methylation-Lightning Kit |
| Bisulfite-Conversion Competent Polymerase | DNA polymerase (e.g., Pfu variant) engineered to efficiently amplify uracil-rich, bisulfite-converted DNA without bias. | Agilent PfuTurbo Cx Hotstart DNA Polymerase |
| CpG Methyltransferase (M.SssI) | Positive control for methylation. Used to generate fully methylated genomic DNA to assess technique specificity and efficiency. | New England Biolabs M.SssI (CpG Methyltransferase) |
| DNA Cleanup Beads | Size-selective solid-phase reversible immobilization (SPRI) magnetic beads for post-digestion, post-PCR, and final library cleanup and size selection. | Beckman Coulter AMPure XP Beads |
| RRBS-Specific Enzyme (MspI) | Frequent-cutter restriction enzyme targeting CCGG sites, which are abundant in CpG islands, enabling reduced representation. | New England Biolabs MspI (High-Fidelity) |
| Methylation-Specific qPCR Assays | For rapid, targeted validation of DMRs discovered via WGBS/RRBS in an expanded cohort of primary/metastatic pairs. | Qiagen Methyl-Light PCR Systems |
Application in Metastasis Research: A Proposed Workflow
To investigate CpG island methylation dynamics, a tandem approach is recommended:
- Discovery Phase: Perform WGBS on a limited set (n=5-10) of matched primary tumor and metastasis samples to identify genome-wide DMRs without bias.
- Validation & Screening Phase: Design RRBS or targeted bisulfite-seq panels based on discovery-phase DMRs. Apply to a large cohort (n=50+) of matched samples to statistically correlate specific methylation changes with metastatic potential or site tropism.
- Functional Integration: Integrate methylation data with transcriptomic (RNA-seq) and chromatin accessibility (ATAC-seq) data from the same samples to establish mechanistic links between methylation, gene silencing, and metastatic phenotype.
Diagram: Integrated Methylation Study Design for Metastasis
Within the framework of investigating CpG island methylation in primary and metastatic tumor sites, the selection of a precise, quantitative, and sensitive detection method is paramount. This technical guide details three core targeted DNA methylation analysis techniques—Pyrosequencing, Methylation-Specific High-Resolution Melting (MS-HRM), and Methylation-Specific PCR (MSP)—critical for validating genome-wide screens and elucidating epigenetic drivers of cancer progression and metastasis.
Pyrosequencing
Pyrosequencing is a quantitative, sequencing-by-synthesis method that analyzes methylation at individual CpG sites within a short amplified target sequence following bisulfite conversion.
Experimental Protocol for Bisulfite-Pyrosequencing
Key Steps:
- Genomic DNA Isolation & Bisulfite Conversion: Extract high-quality DNA (≥50 ng) from primary and matched metastatic FFPE or frozen tissue. Treat with sodium bisulfite (e.g., using EZ DNA Methylation kits) to convert unmethylated cytosines to uracil, while methylated cytosines remain unchanged.
- PCR Amplification: Design primers (one biotinylated) to amplify the bisulfite-converted DNA of interest. Use hot-start PCR to minimize non-specific amplification.
- Template Preparation: Immobilize the biotinylated PCR product onto streptavidin-coated Sepharose beads. Denature with NaOH and wash to obtain a single-stranded template.
- Pyrosequencing Reaction: Anneal the sequencing primer to the template. In the Pyrosequencing instrument, sequential dispensing of dNTPs (dATPαS, dCTP, dGTP, dTTP) results in real-time light emission upon nucleotide incorporation, proportional to the number of bases added. The ratio of C to T incorporation at each CpG site quantifies methylation percentage.
Diagram: Pyrosequencing Workflow for CpG Methylation
Quantitative Data from Metastasis Studies
Table 1: Example Pyrosequencing Data for a Hypothetical Metastasis Suppressor Gene
| Tissue Site | CpG Site 1 Methylation % (Mean ± SD) | CpG Site 2 Methylation % (Mean ± SD) | CpG Site 3 Methylation % (Mean ± SD) | N |
|---|---|---|---|---|
| Normal Adjacent Tissue | 8.2 ± 2.1 | 10.5 ± 3.0 | 7.8 ± 1.9 | 10 |
| Primary Tumor | 45.7 ± 12.3 | 52.1 ± 15.6 | 48.9 ± 11.8 | 15 |
| Lymph Node Metastasis | 78.4 ± 9.8* | 81.6 ± 8.2* | 76.9 ± 10.5* | 15 |
| Distant Organ Metastasis | 92.5 ± 5.1*# | 94.3 ± 4.7*# | 90.8 ± 6.3*# | 12 |
- p<0.01 vs. Primary Tumor; # p<0.05 vs. Lymph Node Metastasis (hypothetical t-test).
Methylation-Specific High-Resolution Melting (MS-HRM)
MS-HRM is a closed-tube, semi-quantitative method that discriminates methylated and unmethylated alleles based on their differential melting profiles following bisulfite PCR.
Experimental Protocol for MS-HRM
Key Steps:
- Bisulfite Conversion: As per Section 1.1.
- PCR Amplification: Design primers that anneal to sequences devoid of CpG sites to equally amplify all bisulfite-converted alleles. Include a saturating DNA intercalating dye (e.g., LCGreen Plus, EvaGreen).
- High-Resolution Melting: After amplification, slowly increase temperature (0.1°C/sec to 0.3°C/sec) in a dedicated HRM instrument. The dye fluoresces when bound to double-stranded DNA. Methylated alleles (with more GC pairs post-conversion) melt at higher temperatures than unmethylated alleles (with more AT pairs).
- Analysis: Plot fluorescence decrease vs. temperature. Samples with different methylation levels produce distinct melting curve shapes and temperature shifts. Quantification is achieved by comparison to standards of known methylated/unmethylated ratios.
Diagram: MS-HRM Principle & Analysis
Methylation-Specific PCR (MSP)
MSP is a highly sensitive, non-quantitative method that detects the presence or absence of methylation at a specific locus using primers designed to anneal specifically to methylated or unmethylated bisulfite-converted sequences.
Experimental Protocol for MSP
Key Steps:
- Bisulfite Conversion: As per Section 1.1.
- Primer Design: Design two primer pairs: one pair (M primers) complementary to sequences where CpGs are methylated (remaining as C after conversion), and one pair (U primers) complementary where CpGs are unmethylated (converted to T). The 3' ends of primers should contain multiple CpG sites for specificity.
- PCR Amplification: Perform separate PCR reactions for M and U primers. Use hot-start Taq polymerase. Include controls: in vitro methylated DNA (positive for M), normal lymphocyte DNA (positive for U), and no-template water.
- Gel Electrophoresis: Resolve PCR products on an agarose gel. Detection of a product with the M primers indicates methylation at the locus. Sensitivity can detect 0.1% methylated alleles.
Diagram: MSP Primer Design Logic
Application in Primary vs. Metastatic Analysis
MSP is ideal for rapidly screening large cohorts of paired samples to classify tumors as methylated or unmethylated for a candidate biomarker, prior to quantitative analysis by Pyrosequencing.
The Scientist's Toolkit: Research Reagent Solutions
Table 2: Essential Reagents for Targeted Methylation Analysis
| Reagent / Kit | Primary Function | Key Consideration for Metastasis Research |
|---|---|---|
| Sodium Bisulfite Conversion Kits | Converts unmethylated cytosine to uracil while preserving methylated cytosine. | Optimized for degraded DNA from FFPE metastatic samples is critical. |
| Hot-Start PCR Master Mix | Reduces non-specific amplification during PCR setup, improving bisulfite PCR specificity and yield. | Essential for MSP specificity and robust MS-HRM/Pyrosequencing pre-amplification. |
| PyroMark PCR Kit | Provides optimized chemistry for biotinylated PCR amplification prior to Pyrosequencing. | Ensures high yield of pure, single-stranded template for accurate quantification. |
| Methylation-Specific Primers | Oligonucleotides designed to discriminate methylated/unmethylated sequences post-bisulfite conversion. | Design requires careful attention to CpG positioning and annealing temperatures. |
| DNA Intercalating Dye (LCGreen) | Saturating dye for MS-HRM that does not inhibit PCR and provides high-resolution melting data. | Superior to SYBR Green I for precise melting curve differentiation. |
| In Vitro Methylated DNA Control | Universally methylated genomic DNA (e.g., via SssI methylase) serves as a positive control for methylation assays. | Crucal for standard curve generation in MS-HRM and as a control in MSP/Pyrosequencing. |
| Methylated & Unmethylated DNA Standards | Pre-mixed DNA standards of known methylation ratios (e.g., 0%, 10%, 25%, 50%, 75%, 100%). | Required for semi-quantitative calibration in MS-HRM and Pyrosequencing assays. |
Method Comparison & Selection Guide
Table 3: Comparative Summary of Targeted Methylation Analysis Methods
| Feature | Pyrosequencing | MS-HRM | MSP |
|---|---|---|---|
| Quantification | Excellent (Fully Quantitative) | Good (Semi-Quantitative) | No (Qualitative - Present/Absent) |
| Resolution | Single CpG site | Amplicon-wide average | Locus-specific |
| Throughput | Medium | High | Very High |
| Sensitivity | ~5% methylated alleles | ~1-5% methylated alleles | ~0.1% methylated alleles |
| Speed & Cost | Moderate speed, Higher cost | Fast post-PCR, Moderate cost | Very Fast, Low cost |
| Primary Application in Metastasis Research | Gold-standard validation and precise quantification of methylation shifts between sites. | Rapid screening and relative quantification across sample sets. | High-throughput binary classification of methylation status. |
In the context of CpG island methylation analysis across primary and metastatic niches, Pyrosequencing, MS-HRM, and MSP form a complementary toolkit. MSP offers unmatched sensitivity for initial screening, MS-HRM provides efficient semi-quantitative profiling, and Pyrosequencing delivers definitive, single-base-pair quantitative data. The integrated application of these techniques enables robust validation of epigenetic alterations driving tumor progression, informing potential therapeutic strategies and biomarker development.
This technical guide explores two transformative methodologies within the broader thesis framework of investigating CpG island methylation patterns across primary and metastatic tumor sites. The central thesis posits that metastatic evolution is driven by epigenetic reprogramming, where specific CpG island hyper- or hypo-methylation in promoter regions confers survival, invasive, and proliferative advantages. Understanding this spatial and temporal heterogeneity is critical for deciphering metastatic mechanisms and identifying novel therapeutic targets. Single-cell methylomics resolves epigenetic heterogeneity within tumor ecosystems, while liquid biopsy-based detection enables non-invasive tracking of these evolving methylation patterns from circulation, together providing a comprehensive view of cancer progression.
Single-Cell Methylomics: Dissecting Epigenetic Heterogeneity
Core Principles and Current Technologies
Single-cell methylomics enables the profiling of DNA methylation—primarily 5-methylcytosine (5mC) at CpG dinucleotides—at individual cell resolution. This is essential for uncovering epigenetic subpopulations within primary and metastatic lesions that bulk sequencing masks.
Key Technologies:
- scBS-seq (single-cell bisulfite sequencing): The gold standard. Treatment with sodium bisulfite converts unmethylated cytosines to uracil (read as thymine), while methylated cytosines remain unchanged.
- scRRBS (single-cell reduced representation bisulfite sequencing): Targets CpG-rich regions (including CpG islands), offering a cost-effective method for focused analysis.
- scNOMe-seq (single-cell nucleosome occupancy and methylome sequencing): Simultaneously maps DNA methylation and chromatin accessibility using a GpC methyltransferase.
- Emerging: Long-read sequencing (e.g., PacBio, Oxford Nanopore) applied to single cells allows for phased methylation haplotyping, linking methylation patterns across adjacent CpGs on a single DNA molecule.
Table 1: Comparison of Key Single-Cell Methylomics Platforms
| Technology | Principle | CpG Coverage per Cell | Key Advantage | Primary Limitation |
|---|---|---|---|---|
| scBS-seq | Whole-genome bisulfite sequencing | ~2-5 million | Gold standard, unbiased genome-wide coverage | High cost, high DNA damage from bisulfite |
| scRRBS | Enzymatic capture (e.g., MspI) + Bisulfite seq | ~1-2 million | Cost-effective, enriches for regulatory CpG islands | Limited to ~5% of genomic CpGs |
| scNOMe-seq | GpC methyltransferase + Bisulfite treatment | ~1-3 million | Simultaneous methylation and chromatin accessibility | Complex protocol, lower coverage depth |
| scATAC-me | Combinatorial indexing (sci-) for ATAC & methylation | ~0.5-1 million | Multi-omic (accessibility + methylation) from same cell | Very low coverage, highly complex analysis |
Detailed Experimental Protocol: scRRBS for Primary/Metastatic Cell Suspensions
A. Cell Preparation and Lysis
- Dissociation: Fresh primary or metastatic tissue is dissociated into a single-cell suspension using a validated tumor dissociation kit (e.g., Miltenyi Biotec GentleMACS). Viability (>90%) is assessed via Trypan Blue.
- Cell Sorting: Single cells are sorted into individual wells of a 96-well plate containing 5 µl of lysis buffer (0.1% SDS, 0.5% Triton X-100, 10 mM Tris-HCl pH 8.0, 10 mM EDTA, 100 µg/ml Proteinase K) using a FACS sorter with index sorting to record surface markers.
- Lysis: Incubate plates at 50°C for 1 hour, then 70°C for 10 minutes to inactivate Proteinase K.
B. Bisulfite Conversion and Library Construction
- MspI Digestion: Add 15 µl of master mix containing MspI restriction enzyme (10 U/µl, NEB) to each well. Incubate at 37°C for 1 hour. MspI cuts at CCGG sites, enriching for CpG-rich regions.
- End-Repair and Tailing: Perform end-repair and A-tailing using Klenow Fragment (3’→5’ exo–) and dATP.
- Adapter Ligation: Add pre-methylated Illumina adapters (to protect from bisulfite-induced degradation) using T4 DNA ligase.
- Bisulfite Conversion: Use the EZ-96 DNA Methylation-Lightning MagPrep kit (Zymo Research). Bind DNA to magnetic beads, treat with bisulfite reagent (95°C for 5 min, 60°C for 20 min), then desulphonate and elute.
- PCR Amplification: Amplify libraries with high-fidelity, bisulfite-converted DNA-friendly polymerase (e.g., KAPA HiFi HotStart Uracil+). Index with unique dual indexes (UDIs) for multiplexing.
- Clean-up and QC: Clean libraries with AMPure XP beads. Assess quality via Bioanalyzer/TapeStation (broad smear ~200-600bp expected) and quantify via qPCR (KAPA Library Quant kit).
C. Sequencing and Data Analysis
- Sequencing: Pool libraries and sequence on an Illumina NovaSeq 6000 with 150bp paired-end reads, aiming for ~5-10 million reads per cell.
- Bioinformatics Pipeline: Process using
bismark(alignment & methylation calling) andmethylKitorSeurat(for single-cell analysis) in R. Key steps include:- Adapter trimming with
Trim Galore!. - Alignment to bisulfite-converted reference genome.
- Extraction of methylation calls for each CpG.
- Identification of differentially methylated regions (DMRs) between cell clusters from primary vs. metastatic sites.
- Adapter trimming with
Diagram 1: Single-Cell RRBS Experimental Workflow
Liquid Biopsy for Methylation Detection: Tracking Metastatic Signals
Principles and Analytical Targets
Liquid biopsy analyzes circulating tumor DNA (ctDNA), which carries the methylation signature of its cell of origin. In metastatic disease, ctDNA reflects the integrated methylation landscape from all tumor sites, with potential to identify metastasis-specific signals.
Key Analytical Approaches:
- Targeted Methylation PCR: (e.g., Methylation-Specific PCR - MSP, Quantitative Methylation-Specific PCR - qMSP). Highly sensitive for known markers.
- Bead-Based Array: (Infinium MethylationEPIC BeadChip). Requires bisulfite-converted DNA, suitable for cell-free DNA (cfDNA) with sufficient input.
- Next-Generation Sequencing (NGS) Methods:
- Targeted Capture Sequencing: Hybrid capture panels (e.g., Roche SeqCap Epi) enrich for CpG islands of interest from bisulfite-converted cfDNA.
- Whole-Genome Bisulfite Sequencing (WGBS) of cfDNA: Provides an unbiased map but requires high input and depth.
- Fragmentation-Based Analysis: Leverages the fact that cfDNA from apoptotic cells (e.g., from tumors) has a different fragmentation pattern around nucleosomes, which correlates with methylation state.
Table 2: Liquid Biopsy Methylation Detection Methods for Metastasis Research
| Method | Sensitivity | Throughput | Primary Application | Key Challenge |
|---|---|---|---|---|
| qMSP/ddMSP | 0.01%-0.1% mutant allele frequency (MAF) | Low (1-10 markers) | Validating known metastasis-specific markers in ctDNA | Primer bias, false positives from incomplete conversion |
| Methylation-Sensitive ddPCR | ~0.1% MAF | Low (1-2 markers/assay) | Absolute quantification of specific methylated alleles | Limited multiplexing |
| Targeted NGS Panels | 0.1%-1% MAF | Medium (10s-1000s of regions) | Profiling known pan-cancer or cancer-type specific markers | Input requirements (10-30ng cfDNA) |
| EPIC Array on cfDNA | ~5-10% tumor fraction | High (850K CpG sites) | Discovery in samples with high ctDNA fraction | Poor performance on low-input, degraded cfDNA |
| Whole-Genome Bisulfite Sequencing | Theoretical: <1% MAF Practical: ~5% | High (All CpGs) | Unbiased discovery of novel metastatic signatures | Very high cost, requires >50ng high-quality cfDNA |
Detailed Experimental Protocol: Targeted Methylation Sequencing of Plasma cfDNA
A. Blood Collection and cfDNA Extraction
- Collection: Collect 10-20 ml of peripheral blood into Streck Cell-Free DNA BCT or similar cfDNA-stabilizing tubes. Process within 6 hours.
- Plasma Isolation: Double-centrifugation protocol. First spin: 1600 x g for 10 min at 4°C. Transfer supernatant (plasma) to a fresh tube. Second spin: 16,000 x g for 10 min at 4°C to remove residual cells.
- cfDNA Extraction: Use a high-sensitivity silica-membrane column kit (e.g., QIAamp Circulating Nucleic Acid Kit, Qiagen). Elute in 20-30 µl of low-EDTA TE buffer. Quantify using a fluorometer sensitive to low DNA concentrations (e.g., Qubit dsDNA HS Assay).
B. Bisulfite Conversion and Library Preparation
- Conversion: Use the EZ DNA Methylation-Lightning Kit (Zymo Research) on 10-50 ng of cfDNA. Conditions: 98°C for 8 min, 54°C for 60 min.
- Library Prep: Use a commercial kit designed for bisulfite-converted DNA (e.g., Swift Biosciences Accel-NGS Methyl-Seq DNA Library Kit or Twist Bioscience FFPE & Methylation Detection Kit).
- Target Enrichment: Perform hybrid capture using a custom panel targeting CpG islands differentially methylated in primary vs. metastatic samples from your single-cell data (e.g., Twist Human Methylome Panel). Follow manufacturer's protocol for hybridization, wash, and capture.
- Amplification & QC: Perform a final PCR amplification. Validate library size distribution (Bioanalyzer) and quantify (qPCR).
C. Sequencing and Bioinformatics
- Sequencing: Sequence on an Illumina platform (minimum 200x depth per captured region).
- Analysis:
- Trim adapters and low-quality bases (
Trim Galore!). - Align to bisulfite-converted reference (
bismarkorBS-Seeker2). - Call methylation status at each CpG (
methylKit). - Use statistical models (e.g.,
CancerDetector,ichorCNA) to deconvolute ctDNA fraction and assign methylation haplotypes to clonal populations.
- Trim adapters and low-quality bases (
Diagram 2: Liquid Biopsy ctDNA Methylation Analysis Pathway
The Scientist's Toolkit: Essential Research Reagent Solutions
Table 3: Key Reagents and Kits for Integrated Methylation Analysis
| Item (Supplier Examples) | Category | Function in Research |
|---|---|---|
| GentleMACS Human Tumor Dissociation Kit (Miltenyi) | Tissue Processing | Standardized enzymatic mix for viable single-cell suspension from solid tumors. |
| Chromium Next GEM Single Cell ATAC Reagent Kits (10x Genomics) | Single-Cell Multi-omics | Enables linked scATAC-seq (chromatin) + methylation analysis from the same cells. |
| EZ-96 DNA Methylation-Lightning MagPrep (Zymo Research) | Bisulfite Conversion | High-throughput, bead-based bisulfite conversion with high recovery for low-input samples. |
| KAPA HiFi HotStart Uracil+ ReadyMix (Roche) | PCR | Polymerase engineered to efficiently amplify uracil-containing, bisulfite-converted DNA. |
| Twist Human Methylome Panel (Twist Bioscience) | Target Enrichment | Comprehensive hybrid capture panel covering >2.5 million CpGs for NGS. |
| QIAamp Circulating Nucleic Acid Kit (Qiagen) | cfDNA Extraction | Optimized silica-membrane protocol for high yield, pure cfDNA from plasma/serum. |
| Infinium MethylationEPIC v2.0 BeadChip (Illumina) | Array-Based Profiling | Genome-wide methylation array covering >935,000 CpG sites for discovery phases. |
| Cell-Free DNA Collection Tubes (Streck) | Sample Collection | Preserves blood sample, prevents leukocyte lysis and genomic DNA contamination for cfDNA studies. |
| Methylated & Unmethylated Human Control DNA (Zymo) | Controls | Essential bisulfite conversion efficiency controls for both single-cell and liquid biopsy protocols. |
| Unique Dual Indexes (UDI) Sets (Illumina/IDT) | Library Indexing | Enables multiplexing of hundreds of samples while minimizing index hopping errors. |
Bioinformatic Pipelines for Differential Methylation Analysis (e.g., dmrseq, MethylKit)
Within the context of a broader thesis investigating CpG island methylation patterns in primary tumors versus metastatic sites, the selection and application of a robust bioinformatic pipeline for differential methylation analysis is paramount. Such analysis aims to identify statistically significant methylation changes that may drive metastatic progression, offering potential biomarkers and therapeutic targets. This technical guide provides an in-depth comparison of two prominent R-based pipelines, dmrseq and MethylKit, detailing their methodologies, experimental protocols, and application to oncology research.
Core Pipeline Comparison
MethylKit is a user-friendly tool designed for downstream analysis of methylation data from bisulfite sequencing (BS-seq) or array-based platforms. It performs differential methylation analysis on a per-CpG (or per-base) basis, using statistical tests like logistic regression or Fisher's exact test, followed by multiple testing correction. It is efficient for genome-wide screening but does not inherently identify differentially methylated regions (DMRs) without additional steps.
dmrseq is specifically designed to identify and map Differentially Methylated Regions (DMRs) from BS-seq data. It employs a Bayesian approach to model spatial correlations between nearby CpG sites, accounting for variability in coverage and biological variation. This makes it particularly powerful for detecting coherent regional changes, which are often biologically more relevant than single-CpG changes.
The table below summarizes their key characteristics.
Table 1: Core Feature Comparison of MethylKit and dmrseq
| Feature | MethylKit | dmrseq |
|---|---|---|
| Primary Unit of Analysis | Single CpG site | Pre-defined/empirical genomic regions |
| Statistical Foundation | Logistic regression, Fisher's exact test | Bayesian hierarchical model, likelihood ratio test |
| Handles Biological Replicates | Yes, via generalized linear models | Yes, integrated into model |
| Spatial Correlation | Not inherently accounted for | Explicitly models correlation between nearby CpGs |
| Output | Differentially Methylated Positions (DMPs) | Differentially Methylated Regions (DMRs) |
| Key Strength | Speed, ease of use, flexible input formats | Statistical rigor for DMR detection, controls false discoveries |
| Typical Use Case | Initial genome-wide screening for DMPs | Definitive identification of biologically coherent DMRs |
Quantitative Performance Metrics
A critical consideration for a thesis comparing primary and metastatic samples is pipeline performance. Published benchmarks provide quantitative insights.
Table 2: Benchmarking Performance Metrics (Representative Values)
| Metric | MethylKit | dmrseq | Interpretation for Metastasis Research |
|---|---|---|---|
| Precision (Positive Predictive Value) | ~0.85 | ~0.92 | dmrseq's higher precision reduces false positive DMRs, crucial for downstream validation. |
| Recall (Sensitivity) | ~0.78 | ~0.75 | Comparable sensitivity; MethylKit may detect more subtle single-site changes. |
| F1 Score (Harmonic Mean) | ~0.81 | ~0.83 | dmrseq often has a marginally better balance, favoring reliable DMR calls. |
| Runtime (on mammalian genome) | ~1-2 hours | ~4-8 hours | MethylKit is faster; dmrseq's longer runtime is due to its complex regional modeling. |
| Memory Usage | Moderate | High | dmrseq requires significant RAM for large sample sets and whole-genome analysis. |
Experimental Protocols for Analysis
Protocol 1: Differential Analysis with MethylKit
This protocol details steps from alignment files to Differentially Methylated Positions (DMPs).
1. Input Preparation: Process BS-seq alignments (e.g., .bam files) to extract methylation calls. Tools like bismark_methylation_extractor or MethylDackel can be used. Create a tab-delimited text file or R data frame containing sample IDs, file paths, and experimental design (e.g., "Primary" vs "Metastatic").
2. Data Loading and Assembly:
3. Filtering and Normalization:
4. Merging Samples and Calculating Differential Methylation:
5. Result Extraction and Annotation:
Protocol 2: DMR Identification with dmrseq
This protocol builds upon per-sample Bismark coverage files to identify DMRs.
1. Prerequisite Data: Generate per-sample coverage files (.cov.gz format) using Bismark. Prepare a sample data frame (sampleData) with columns sampleNames, files (paths to .cov.gz files), and condition (e.g., Primary/Metastatic).
2. Data Loading and Preprocessing:
3. DMR Detection:
4. Filtering and Interpretation:
Visualization of Workflows
Title: Comparative Workflow of MethylKit and dmrseq Pipelines
Title: Core Statistical Logic of the dmrseq Algorithm
The Scientist's Toolkit: Research Reagent Solutions
Table 3: Essential Reagents and Materials for Differential Methylation Studies
| Item | Function/Description | Key Consideration for Primary/Metastasis Research |
|---|---|---|
| Bisulfite Conversion Kit (e.g., EZ DNA Methylation-Lightning Kit, Qiagen Epitect) | Chemically converts unmethylated cytosine to uracil, leaving methylated cytosine unchanged. The foundational step for BS-seq. | Use kits with high conversion efficiency (>99%) and minimal DNA degradation, critical for limited archival FFPE samples from metastatic biopsies. |
| High-Fidelity DNA Polymerase for Post-BS PCR (e.g., KAPA HiFi HotStart Uracil+, Pfu Turbo Cx) | Amplifies bisulfite-converted DNA while handling uracil templates and maintaining fidelity. | Essential for preparing sequencing libraries from low-input converted DNA, ensuring unbiased amplification. |
| Methylation-Aware Sequencing Adapters & Enzymes | Library preparation kits specifically designed for BS-seq (e.g., Accel-NGS Methyl-Seq, Swift Biosciences). | Includes uracil-tolerant enzymes and often incorporates unique molecular identifiers (UMIs) to mitigate PCR duplicates, improving quantification accuracy for heterogeneous metastatic samples. |
| Positive Control DNA (e.g., Fully Methylated & Unmethylated Human Genomic DNA) | Control for bisulfite conversion efficiency and library preparation completeness. | Run alongside experimental samples to batch-check conversion rates, ensuring data comparability across primary and metastatic sample sets processed at different times. |
| CpG Island / Promoter-Specific Panels (e.g., for Targeted BS-seq or Pyrosequencing) | Focused assays for validating genome-wide findings on specific gene sets of interest. | Crucial for validating candidate DMRs from bioinformatic analysis in a larger cohort of primary/metastasis pairs. Enables rapid, cost-effective confirmation. |
| Genomic DNA Isolation Kit (FFPE-Compatible) | Extracts high-quality DNA from formalin-fixed, paraffin-embedded (FFPE) tissue blocks. | Metastasis samples are often only available as FFPE blocks. Kits must effectively reverse cross-links and yield DNA suitable for bisulfite conversion. |
Navigating Pitfalls: Optimizing Methylation Analysis for Heterogeneous and Low-Quality Samples
The analysis of CpG island methylation patterns in primary tumors versus metastatic sites is a cornerstone of understanding cancer evolution and epigenetic drivers of spread. A core thesis in this field posits that metastatic clones exhibit distinct, stable epigenetic signatures, including hypermethylation of specific CpG island promoters, which confer survival and proliferative advantages. However, the technical fidelity of bisulfite sequencing data, the gold standard for DNA methylation analysis, is fundamentally compromised by two major artifacts: inefficient bisulfite conversion of unmethylated cytosines (leading to false-positive methylation calls) and incomplete conversion (leading to false-negative calls). This technical noise directly obscures the true biological signal, potentially leading to erroneous conclusions about differential methylation between primary and metastatic sites. This guide provides an in-depth technical framework to identify, quantify, and mitigate these artifacts to ensure data integrity in metastasis research.
Quantifying and Diagnosing Conversion Artifacts
Rigorous QC is non-negotiable. The following metrics must be calculated for every sample.
Table 1: Key Quantitative Metrics for Bisulfite Conversion QC
| Metric | Calculation | Target Threshold | Indicates Problem If... |
|---|---|---|---|
| Unmethylated Lambda Genome Conversion Rate | %C-to-T conversion in spiked-in unmethylated λ DNA | ≥99.5% | Low value signals inefficient conversion, causing false positives. |
| Fully Methylated Control Conversion Rate | %C-to-T conversion in spiked-in fully methylated control (e.g., pUC19) | ≤0.5% | High value signals over-conversion/degradation or control impurity. |
| Non-CpG Cytosine (CHH/CHG) Methylation in Sample | Average % methylation in endogenous CHH & CHG contexts (mammalian genomes) | ~0.1 - 0.5% | >1.0% signals incomplete conversion, causing false negatives at CpGs. |
| Bisulfite Conversion Efficiency (BCE) | 1 - (Avg. CHH methylation %) | ≥99.0% | Low BCE indicates poor reaction efficiency. |
| Read Depth at Control Loci | Mean coverage for spike-in control genomes | ≥10X | Low coverage reduces QC statistical power. |
Detailed Experimental Protocols for Mitigation
Protocol A: High-Fidelity Bisulfite Conversion with Dual Spike-Ins
Objective: To simultaneously monitor conversion efficiency and incompletion in each sample.
- DNA Quantification & Spike-In: Accurately measure 100-500 ng of genomic DNA (e.g., from primary tumor and matched metastasis). Spike with 0.5% (w/w) unmethylated λ DNA (e.g., Promega, D1521) and 0.5% fully methylated control DNA (e.g., Zymo Research, D5014).
- Bisulfite Reaction: Use a kit optimized for minimal degradation (e.g., Zymo Research EZ DNA Methylation-Lightning Kit, Qiagen EpiTect Fast DNA Bisulfite Kit). Precisely follow incubation times and temperatures. Critical Step: Ensure thermal cycler lid is heated to >75°C to prevent condensation-induced pH shifts.
- Post-Conversion Cleanup: Perform the recommended desulfonation and purification. Elute in low-EDTA TE buffer or nuclease-free water. Measure DNA concentration with a fluorometer (Qubit); expect significant loss (50-80%).
- Library Preparation & Sequencing: Use a bisulfite-converted DNA-compatible library prep kit (e.g., Swift Biosciences Accel-NGS Methyl-Seq, Illumina EPIC). Use unique dual indices. Sequence on an appropriate platform (NovaSeq, NextSeq) to achieve desired coverage (typically 30X for WGBS).
Protocol B: In-Silico Correction and Filtering Pipeline
Objective: To computationally identify and exclude loci potentially affected by incomplete conversion.
- Alignment & Methylation Calling: Align reads using a bisulfite-aware aligner (Bismark, BSMAP) to a reference genome plus spike-in genomes. Extract methylation calls with
MethylDackelorBismark_methylation_extractor. - Calculate QC Metrics: Generate per-sample report with metrics from Table 1 using
bismark2reportand custom scripts analyzing CHH contexts and spike-in alignment files. - Filter Loci by Coverage: Require a minimum coverage (e.g., ≥10X) per CpG site in all samples being compared.
- Apply a CHH-based Filter: For each CpG site, examine the average CHH methylation level in its immediate genomic vicinity (e.g., ±100bp). If the local CHH methylation >1%, flag the CpG as potentially affected by incomplete conversion and exclude it from downstream differential methylation analysis.
- Differential Methylation Analysis: Use tools like
DSSormethylKitthat account for coverage and biological variation, analyzing only the filtered, high-confidence CpG set.
Visualizing Workflows and Relationships
Title: End-to-End Workflow for High-Fidelity Methylation Analysis
Title: Molecular Outcome of Complete vs. Incomplete Bisulfite Conversion
The Scientist's Toolkit: Essential Research Reagents & Materials
Table 2: Key Reagent Solutions for Robust Bisulfite Sequencing
| Item | Example Product (Vendor) | Critical Function |
|---|---|---|
| High-Fidelity BS Kit | EZ DNA Methylation-Lightning Kit (Zymo) | Maximizes conversion efficiency (>99.5%) while minimizing DNA degradation. |
| Unmethylated Control DNA | Lambda DNA, unmethylated (Promega) | Spike-in control to quantify conversion efficiency and detect false positives. |
| Fully Methylated Control DNA | Methylated pUC19 DNA (Zymo) | Spike-in control to detect over-conversion or degradation. |
| Fluorometric DNA Quantifier | Qubit dsDNA HS Assay Kit (Thermo Fisher) | Accurate post-conversion DNA quantification (bisulfite DNA is poorly quantified by A260). |
| Bisulfite-Seq Library Prep Kit | Accel-NGS Methyl-Seq Kit (Swift Biosciences) | Efficient library construction from low-input, fragmented bisulfite-converted DNA. |
| Bisulfite Converted Control DNA | Human Methylated & Non-methylated DNA Set (Zymo) | Whole-process positive/negative controls for assay validation. |
| Computational Pipeline | Bismark / MethylDackel / DSS | Dedicated software for alignment, calling, and differential analysis of bisulfite-seq data. |
Managing Tumor Heterogeneity and Stromal Contamination in Metastatic Samples
Within the broader thesis investigating CpG island methylation landscapes across primary and metastatic tumors, a central technical challenge is the accurate molecular profiling of metastatic samples. These samples are frequently confounded by intratumoral heterogeneity (ITH) and significant contamination by non-malignant stromal cells. This whitepaper provides an in-depth technical guide to dissecting the true metastatic epithelial signal from this complex biological background, ensuring data fidelity for downstream methylation and genomic analyses.
The Dual Challenge: Heterogeneity and Contamination
Metastatic biopsies represent a mosaic of subclonal tumor populations and admixed normal stroma. This compromises the sensitivity for detecting somatic variants, copy number alterations, and, critically, subtle shifts in CpG methylation patterns that may drive metastatic progression or therapy resistance.
Quantitative Impact of Stromal Contamination
Stromal contamination directly dilutes the tumor-derived molecular signal. The table below summarizes its effect on common genomic assays.
Table 1: Impact of Stromal Contamination on Assay Sensitivity
| Assay Type | Target Signal | 50% Stromal Contamination | 70% Stromal Contamination |
|---|---|---|---|
| Somatic SNP/Indel Calling | Variant Allele Frequency (VAF) | VAF halved; low-VAF variants lost. | 70% reduction; only clonal variants detectable. |
| CpG Methylation (e.g., Array) | Beta Value | Weighted average; tumor-specific hypo/hypermethylation attenuated. | Stromal methylation profile dominates. |
| RNA-Seq | Tumor Gene Expression | Differential expression signatures are obscured. | Stromal/immune signatures dominate transcriptome. |
| Copy Number Variation | Log R Ratio | Aberrations less pronounced; focal losses may be missed. | Major arm-level changes only. |
Experimental Protocols for Sample Deconvolution
Protocol 1: Laser Capture Microdissection (LCM) for Targeted Cell Isolation
Objective: To physically isolate pure populations of metastatic carcinoma cells from stromal tissue. Procedure:
- Sectioning & Staining: Cut frozen or FFPE-embedded metastatic biopsy sections at 5-10 μm. Perform rapid H&E or immunofluorescence (e.g., anti-pan-cytokeratin) staining.
- Visualization & Capture: Visualize the slide on the LCM system. Use the outlining tool to select groups of stained tumor cells.
- Extraction: Activate the laser to cut the membrane around the selected cells and catapult them into a microcentrifuge tube cap containing lysis buffer.
- Downstream Processing: Proceed with DNA/RNA extraction using ultra-low input protocols (e.g., Qiagen PicoPure, Arcturus PicoPure). Amplify if necessary (e.g., REPLI-g for DNA, SMART-Seq for cDNA).
Protocol 2: Computational Deconvolution of Bulk Methylation Data
Objective: To infer tumor purity and estimate cell-type-specific methylation profiles from bulk metastatic sample data. Procedure:
- Data Acquisition: Generate genome-wide methylation data (e.g., Illumina EPIC array) from the bulk metastatic sample.
- Reference Selection: Obtain methylation reference matrices for expected cell types (e.g., carcinoma epithelium, fibroblasts, immune cells) from public repositories (e.g., TCGA, GEO) or matched normal tissue.
- Deconvolution Analysis: Utilize computational tools such as MethylCIBERSORT or EpiDISH.
- Input: Bulk sample Beta-values (M-values) and reference matrix.
- Execution: Run the deconvolution algorithm (e.g., constrained projection, robust partial correlations).
- Output: Estimated proportions of each reference cell type in the sample.
- In-Silico Purification: Apply tools like RFpurify or QUBIC to in silico "subtract" the stromal contribution, yielding an estimated pure tumor methylation profile for subsequent differential methylation analysis.
Signaling Pathways in Metastasis and Stromal Crosstalk
The tumor-stroma interface is a hub of bidirectional signaling that influences methylation patterns. A key pathway is the TGF-β signaling axis.
TGF-β Signaling in Stroma-Driven Methylation
Integrated Workflow for Metastatic Sample Analysis
A robust, multi-modal approach is required to manage heterogeneity and contamination from sample acquisition through data analysis.
Integrated Metastatic Analysis Workflow
The Scientist's Toolkit: Research Reagent Solutions
Table 2: Essential Reagents for Managing Heterogeneity and Contamination
| Item | Function | Key Consideration |
|---|---|---|
| Anti-Pan-Cytokeratin Antibody | Immunofluorescence staining for epithelial cells prior to LCM. | Validated for use on FFPE tissue; fluorophore choice compatible with LCM system. |
| Arcturus PicoPure DNA/RNA Kit | Nucleic acid extraction from LCM-captured or microdissected cells. | Optimized for very low cell counts (<100). |
| Illumina Infinium EPIC Methylation BeadChip | Genome-wide CpG methylation profiling (850k sites). | Includes probes relevant to both cancer and stromal biology. |
| MethylCIBERSORT Software Package | Computational deconvolution of bulk methylation data. | Requires appropriate reference methylation signatures for deconvolution. |
| SMART-Seq v4 Ultra Low Input Kit | Full-length cDNA amplification for RNA-Seq from low-input samples. | Critical for transcriptomics from LCM samples. |
| DEPArray NxT System | Image-based sorting of single cells from a heterogeneous suspension. | Enables single-cell DNA methylation sequencing (scBS-seq) prep from rare CTCs or dissociated tissue. |
| QIAseq Human Methylation Panel | Targeted, ultra-deep methylation sequencing for validation. | Allows high-depth follow-up on candidate CpG islands identified via array. |
Optimizing Protocols for FFPE vs. Fresh-Frozen Tissue Comparisons
This technical guide is framed within a broader thesis investigating differential CpG island methylation patterns between primary tumors and their metastatic sites. The accurate comparison of epigenetic markers, particularly from biobanked FFPE tissues and prospectively collected fresh-frozen (FF) samples, is a cornerstone of such research. Optimized protocols for nucleic acid extraction, quality assessment, and downstream molecular analyses are critical to generating reliable, comparable data that can inform mechanisms of cancer progression and potential therapeutic targets.
Fundamental Molecular Differences and Impact
Formalin fixation and paraffin embedding (FFPE) preserves tissue morphology but introduces extensive biomolecular modifications, primarily through methylene cross-linking. Fresh-frozen (FF) tissues, flash-frozen in liquid nitrogen, best preserve native biomolecular integrity. The key differences impacting downstream analyses, especially bisulfite sequencing for methylation, are quantified below.
Table 1: Quantitative Comparison of Nucleic Acid from FFPE vs. FF Tissue
| Parameter | Fresh-Frozen (FF) Tissue | FFPE Tissue | Impact on CpG Methylation Analysis |
|---|---|---|---|
| DNA Yield | High (1-5 µg/mg tissue) | Variable, often lower (0.1-2 µg/mg) | Low yield may limit genome-wide coverage. |
| DNA Fragment Size | >20 kbp intact | Highly fragmented (100-500 bp) | Limits long-range PCR; requires short amplicons (<150 bp) for bisulfite sequencing. |
| Cytosine Deamination | Minimal (<0.1%) | High (up to 10%, C>U conversion) | Creates false positives for 5mC in bisulfite sequencing; requires uracil-DNA glycosylase (UDG) treatment. |
| RNA Integrity Number (RIN) | 8.0 - 10.0 | Typically <4.0 (DV200 preferred metric) | Compromised transcriptomic correlation; microRNA more stable. |
| Protein Cross-linking | None | Extensive, reversible with heat/alkali | Requires antigen retrieval for IHC; epitope masking affects proteomics. |
| Bisulfite Conversion Efficiency | >99% | Often reduced (90-97%) due to cross-linking | Inefficient conversion leads to false methylation calls; requires stringent QC. |
Optimized Core Protocols
Nucleic Acid Extraction and QC
A. DNA Extraction for Bisulfite Sequencing
- FFPE Protocol: Use a combination of xylene or paraffin-removal reagents followed by proteinase K digestion with extended incubation (up to 72 hours) at 56°C with agitation. Kits specifically designed for FFPE DNA recovery, incorporating robust de-crosslinking steps, are essential. Post-extraction, treat with UDG to remediate formalin-induced cytosine deamination.
- FF Protocol: Standard phenol-chloroform or silica-membrane column kits yield high-molecular-weight DNA. Proteinase K digestion requires only 2-4 hours.
- Critical QC Step for Both: Use fluorometric quantification (e.g., Qubit). Assess fragment size via TapeStation or Bioanalyzer. For FFPE, the percentage of DNA >300 bp is a key metric.
B. RNA Extraction
- FFPE Protocol: Use kits with prolonged, high-temperature digestion and specialized buffers to reverse cross-links. Assess quality using the DV200 metric (% of fragments >200 nucleotides) rather than RIN.
- FF Protocol: Standard TRIzol or column-based methods with RNase inhibition. RIN is a valid metric.
Bisulfite Conversion and Methylation-Specific Analysis
Given the thesis focus on CpG islands, this step is paramount.
- Optimized Bisulfite Conversion: Use kits with defined incubation times and temperatures. For FFPE-DNA, consider slightly extended conversion time but monitor fragmentation.
- Post-Conversion Cleanup: Rigorous cleanup is critical to remove all bisulfite salts, which inhibit downstream PCR.
- Assay Design for FFPE: Target amplicons must be short (80-150 bp). Place primers in regions devoid of CpG sites to ensure unbiased amplification of methylated and unmethylated sequences.
- Validation: Include fully methylated and unmethylated control DNAs. Use pyrosequencing or deep amplicon sequencing for quantitative validation of NGS results.
Table 2: Essential Research Reagent Solutions
| Reagent / Material | Function / Purpose | Key Consideration for FFPE vs. FF |
|---|---|---|
| Proteinase K | Digests proteins, reverses cross-links. | Use higher concentrations and longer incubation for FFPE. |
| Uracil-DNA Glycosylase (UDG) | Removes uracil residues from DNA. | Critical for FFPE to mitigate formalin-induced C>U deamination artifacts in bisulfite data. |
| FFPE-DNA/RNA Extraction Kit | Optimized buffers for de-crosslinking. | Essential; do not use standard kits designed for FF tissue. |
| High-Sensitivity Bisulfite Kit | Converts unmethylated C to U. | Choose kits with robust recovery for fragmented FFPE-DNA. |
| Methylated/Unmethylated Control DNA | Process controls for conversion efficiency. | Mandatory for both types to calibrate assays. |
| DV200 Assay Reagents | Measures RNA fragment size distribution. | Primary QC metric for FFPE-RNA; replaces RIN. |
| Target-Specific Bisulfite Primers | Amplifies converted DNA. | Must be designed for short fragments (FFPE) and CpG-free regions. |
Experimental Workflow Diagram
Diagram 1: DNA Methylation Analysis Workflow for Matched FF/FFPE Tissues
Pathway: Impact of FFPE Artifacts on Methylation Data
Diagram 2: FFPE Deamination Artifact and Remediation Pathway
For research within the thesis context of CpG island methylation in metastasis, protocol optimization is non-negotiable. The systematic application of UDG treatment, fragment-size-appropriate assay design, and artifact-aware bioinformatics allows for the valid integration of historically valuable FFPE cohorts with contemporary FF samples. This enables robust, large-scale epigenetic comparisons across primary and metastatic sites, driving discoveries in cancer biology and drug development.
Data Normalization and Batch Effect Correction in Multi-Site Studies
Within the context of a broader thesis investigating CpG island methylation patterns in primary tumors and their corresponding metastatic lesions, robust data normalization and batch effect correction are not merely technical steps but fundamental prerequisites for valid biological inference. Multi-site studies, essential for accruing sufficient sample sizes in such research, inherently introduce technical variability due to differences in reagent lots, sequencing platforms, processing dates, and laboratory protocols. This technical guide details the methodologies to distinguish true biological signals, such as metastatic epigenetic drivers, from these confounding artifacts.
Core Concepts and Quantitative Challenges
Batch effects in multi-site methylation studies (e.g., using Illumina EPIC arrays or bisulfite sequencing) can arise from multiple sources. The following table summarizes key quantitative metrics and their impact.
Table 1: Common Sources of Batch Effects in Multi-Site Methylation Studies
| Source of Variation | Typical Metric Affected | Potential Magnitude of Effect | Impact on Differential Methylation Analysis |
|---|---|---|---|
| Site-to-Site Protocol Differences | Beta value distribution, Detection P-values | Mean beta shift up to 0.2 | High false positive rate for site-associated CpGs |
| Processing Date / BeadChip Lot | Intensity values (M/U), Quality control flags | Deterioration of Detection P-value > 0.01 | Increased technical noise, loss of low-methylation signals |
| DNA Input Quality & Bisulfite Conversion Efficiency | Bisulfite Conversion Control probes | Efficiency variance of 5-10% between batches | Inaccurate absolute methylation quantification |
| Sample Position on Array | Background fluorescence intensity | Localized spatial bias | Spurious correlation among samples processed adjacently |
Experimental Protocols for Integrated Analysis
Protocol 1: Pre-Normalization Quality Control and Diagnostics
- Data Loading: Load raw IDAT files (for array data) or Bismark coverage files (for sequencing) into R using
minfiormethylKit. - Quality Metrics Calculation: Generate a table of sample-wise metrics: median intensity, bisulfite conversion efficiency, detected CpG count (detection p-value < 0.01), and sex chromosome probe consistency.
- Diagnostic Visualization: Perform Principal Component Analysis (PCA) on the raw M-values of the 10,000 most variable CpG probes. Color samples by
SiteandSample Type(Primary/Metastasis). A clear clustering bySiteprior to correction indicates a strong batch effect. - Exclusion Criteria: Discard samples with median detection p-value > 0.05, bisulfite conversion efficiency < 95%, or obvious sex mismatch.
Protocol 2: Intra-Array Normalization
- Method: Functional normalization (
preprocessFunnorminminfi) is recommended for Illumina array data. This method uses a subset of control probes to estimate and remove unwanted variation, assuming it is orthogonal to biological variation of interest (e.g., primary vs. metastasis). - Procedure: Apply
preprocessFunnormto theRGChannelSetobject. This step corrects for dye bias and probe-type bias (Infinium I vs. II) within each array, producing normalized Beta and M-values.
Protocol 3: Inter-Site Batch Effect Correction
- Method: Empirical Bayes methods, specifically Combat (
svapackage) or its improved variantCombat-seqfor sequencing data, are standard. - Procedure:
- Input: Normalized M-values (preferred over Beta for homoscedasticity) from all sites.
- Model: Specify
~ Sample_Typeas the model of interest (preserving primary vs. metastasis difference) and~ Siteas the batch variable. - Execution: Run
ComBatwithpar.prior=TRUE(parametric empirical priors). The output is a batch-corrected M-value matrix.
- Validation: Repeat PCA on the same 10,000 probes. Successful correction is indicated by clusters dissolving by
Sitewhile tightening bySample_Type.
Visualizing the Analytical Workflow
Title: Multi-Site Methylation Data Processing Pipeline
The Scientist's Toolkit: Research Reagent Solutions
Table 2: Essential Reagents & Kits for Robust Multi-Site Methylation Analysis
| Item | Function in Workflow | Critical for Multi-Site Consistency |
|---|---|---|
| Commercial Bisulfite Conversion Kit | Chemical conversion of unmethylated cytosines to uracil. | Standardized conversion efficiency minimizes inter-site technical variance. Use same brand/model across sites. |
| Illumina Infinium MethylationEPIC v2.0 BeadChip | Genome-wide profiling of CpG methylation. | Using identical array version is mandatory. Lot-to-lot variability must be recorded and modeled as a batch factor. |
| Universal Methylation DNA Standards | Pre-converted (fully methylated/unmethylated) control DNA. | Serves as a process control across all sites to track conversion yield and hybridization performance. |
| DNA Quantitation Kit (Fluorometric) | Accurate quantification of input DNA post-bisulfite treatment. | Prevents over/under-loading of arrays, a major source of intensity batch effects. |
| Bioinformatics Pipelines (e.g., nf-core/methylseq) | Standardized processing of raw sequencing data to methylation calls. | Containerized pipelines ensure identical software and reference genome usage across computational analysts at different sites. |
In the study of CpG island methylation across primary and metastatic sites, the integrity of conclusions hinges on the rigorous application of the normalization and correction frameworks outlined above. By implementing standardized wet-lab protocols, systematic quality control, and robust computational correction for site effects, researchers can confidently attribute differential methylation patterns to the biology of metastasis rather than technical artifact. This ensures that subsequent biomarker discovery or therapeutic target identification is grounded in reliable data.
Distinguishing Biological Variability from Technical Artifact in Methylation Calls
1. Introduction
In the investigation of CpG island methylation patterns across primary tumors and metastatic sites, a central analytical challenge is the precise attribution of observed variation. Differences in methylation calls can arise from genuine biological mechanisms—such as clonal evolution, metastatic seeding, or tissue-specific epigenetic reprogramming—or from technical artifacts introduced during sample processing, bisulfite conversion, sequencing, and bioinformatic analysis. This technical guide provides a framework for distinguishing between these sources, a critical step for valid interpretation in cancer research and the development of epigenetically-targeted therapies.
2. Primary Sources of Technical Artifact
Technical variability can be introduced at multiple stages. Key sources and their signatures are summarized below.
Table 1: Common Technical Artifacts in Methylation Analysis
| Stage | Artifact Source | Potential Effect on Methylation Calls | Signature/Indicator |
|---|---|---|---|
| Wet Lab | Incomplete Bisulfite Conversion | False positive retention of C (reads as methylated C) | Low conversion rate in non-CpG cytosines (CHH/CHG contexts). |
| Over-conversion / Degradation | False negative loss of 5mC (reads as unmethylated T) | Excessive conversion rate (>99.5%) or low DNA quality metrics. | |
| PCR Bias / Duplication | Over-representation of specific fragments | High sequencing duplication rates; skewed allele frequencies. | |
| Sequencing | Low Coverage / Depth | Stochastic sampling error | High variance at low-coverage CpGs; poor reproducibility. |
| Read Mapping Bias | Incorrect alignment of converted reads | Low mapping efficiency; anomalous methylation at repetitive regions. | |
| Bioinformatics | Inappropriate Background Correction | Systematic over/under-estimation of β-values | Batch effects correlated with processing date or array lot. |
| Poor SNP Filtering | Misinterpretation of C/T polymorphisms as methylation | Reads coinciding with known SNP positions. |
3. Experimental Protocols for Artifact Mitigation
Implementing robust experimental controls is non-negotiable. Below are detailed protocols for key quality control steps.
Protocol 3.1: Spike-in Controls for Bisulfite Conversion Efficiency
- Purpose: To quantitatively assess the completeness of bisulfite conversion in each sample.
- Materials: Unmethylated Lambda phage DNA or commercially available conversion control oligos.
- Procedure:
- Spike a known amount (e.g., 0.1% by mass) of unmethylated control DNA into each genomic DNA sample prior to bisulfite treatment.
- Proceed with standard bisulfite conversion (e.g., using Zymo Research EZ DNA Methylation kits).
- Post-conversion, perform qPCR on the converted control DNA using primers specific for its sequence. The primer pair should amplify a region containing multiple non-CpG cytosines.
- Calculate conversion efficiency. Non-conversion rates >1% (conversion efficiency <99%) typically indicate problematic conversion requiring troubleshooting.
Protocol 3.2: Duplicate/Replicate Concordance Analysis
- Purpose: To separate technical noise from biological variation using replicate samples.
- Procedure:
- For a subset of samples (including both primary and metastatic tissue), create true technical replicates by splitting the same biological sample before bisulfite conversion.
- Process replicates through the entire workflow (conversion, library prep, sequencing) independently.
- Map reads, call methylation, and calculate β-values (methylated/(methylated + unmethylated)) for each CpG site.
- Compute the correlation (e.g., Pearson's R) of β-values between technical replicates across all shared CpGs. High correlation (R > 0.98 for whole-genome bisulfite sequencing (WGBS) on replicates) indicates low technical noise. Substantially lower correlation between biological samples can then be more confidently attributed to biological variability.
4. Analytical Framework for Distinguishing Sources of Variation
A systematic, multi-step analytical workflow is required to filter artifacts and reveal biological signals.
Diagram 1: Analytical workflow for filtering methylation artifacts.
5. The Scientist's Toolkit: Key Research Reagent Solutions
Table 2: Essential Reagents and Tools for Robust Methylation Analysis
| Item | Function & Rationale |
|---|---|
| Unmethylated Spike-in Control DNA | Provides an internal, sequence-specific monitor for bisulfite conversion efficiency, controlling for false positives. |
| Methylated Spike-in Control DNA | Controls for over-conversion and degradation, helping to identify false negatives. |
| Bisulfite Conversion Kits (e.g., EZ DNA Methylation) | Standardized, optimized reagents for complete and reproducible cytosine deamination. |
| Duplicate Sample Kits/Reagents | Identical processing materials for creating true technical replicates to quantify workflow noise. |
| CpG Methyltransferase (M.SssI) | Used to create fully methylated control DNA for assay calibration and threshold setting. |
| High-Fidelity, Bias-Resistant Polymerase | Reduces PCR amplification bias during library preparation, preserving true methylation ratios. |
| UMI (Unique Molecular Index) Adapters | Tags original DNA molecules pre-PCR to accurately identify and collapse PCR duplicates post-sequencing. |
| Bioinformatic Packages (e.g., Bismark, MethylKit, SeSAMe) | Specialized software for unbiased read alignment, methylation extraction, and differential analysis. |
6. Validation and Biological Contextualization
After artifact filtering, putative biological signals require orthogonal validation and pathway analysis.
Diagram 2: Example pathway linking hypermethylation to metastatic potential.
Protocol 6.1: Pyrosequencing Validation of Differentially Methylated Regions (DMRs)
- Purpose: To quantitatively validate methylation levels at candidate loci identified from high-throughput screening using a targeted, sequence-based method.
- Procedure:
- Design pyrosequencing assays around the DMR core. Perform bisulfite conversion on original DNA samples.
- Amplify target regions using biotinylated PCR primers. Bind PCR product to streptavidin-sepharose beads.
- Denature the bound DNA and anneal the sequencing primer.
- Run sequencing-by-synthesis on a pyrosequencer (e.g., Qiagen PyroMark). The instrument sequentially dispenses nucleotides (dNTPs); incorporation of a nucleotide releases pyrophosphate, generating a light signal proportional to the number of bases incorporated.
- Quantify the C/T ratio at each CpG dinucleotide within the amplicon. Compare results between primary and metastatic samples to confirm the direction and magnitude of change observed in the discovery dataset.
7. Conclusion
Robust distinction between biological variability and technical artifact in methylation calls is foundational for research comparing primary and metastatic sites. It requires integrated vigilance at the bench (through spike-ins and replicates), in the sequencing center (via high coverage and balanced design), and at the computational stage (using rigorous filtering and batch correction). Only after applying this stringent framework can epigenetic differences be reliably interpreted as drivers of metastatic progression, ultimately informing the development of novel biomarkers and therapeutic targets.
Validating Metastasis-Specific Signatures: Cross-Cancer Comparisons and Clinical Correlations
Within the critical research domain of CpG island methylation in primary tumors versus metastatic sites, robust validation is paramount. This whitepaper details two cornerstone validation strategies—Orthogonal Assays and Independent Cohort Analysis—that are essential for confirming the biological and clinical relevance of epigenetic findings, thereby mitigating false discoveries and enhancing translational potential in oncology drug development.
Orthogonal Assays for CpG Methylation Validation
Orthogonal assays employ fundamentally different methodological principles to measure the same analyte, providing cross-verification that reduces technical artifact and increases confidence in results.
Core Quantitative Techniques & Data Comparison
| Assay | Core Principle | Throughput | Locus Resolution | DNA Input (ng) | Key Metric (e.g., Average Methylation % in Metastasis) |
|---|---|---|---|---|---|
| Bisulfite Sequencing (WGBS/RRBS) | Bisulfite conversion, NGS | Medium-High | Single-base | 10-100 | 72.5% ± 8.2% |
| Methylation-Specific qPCR (MSP) | Bisulfite conversion, PCR primers specific to methylated/unmethylated DNA | High | Locus-specific (pre-defined) | 10-50 | 68.1% ± 12.4% |
| Pyrosequencing | Bisulfite conversion, sequential nucleotide dispensation & luminometric detection | Medium | Single-base (short amplicons) | 20-50 | 70.8% ± 5.7% |
| Methylation Microarray (e.g., EPIC) | Beadchip hybridization of bisulfite-converted DNA | Very High | Single CpG (850,000+ sites) | 250-500 | 71.9% ± 4.1% |
Detailed Experimental Protocols
Protocol A: Bisulfite Conversion for Subsequent Analysis (e.g., Pyrosequencing)
- Input: 500 ng – 1 µg of genomic DNA from primary or metastatic FFPE or frozen tissue.
- Bisulfite Conversion: Use the EZ DNA Methylation-Lightning Kit (Zymo Research).
- Dilute DNA in 20 µL of nuclease-free water.
- Add 130 µL of Lightning Conversion Reagent, mix, and incubate: 98°C for 8 min, 54°C for 60 min, hold at 4°C.
- Desalt and clean up using a spin column-based binding buffer.
- Desulfonate with 200 µL of Lightning Desulphonation Buffer for 15 min at room temperature.
- Wash and elute in 20 µL of Elution Buffer.
- PCR Amplification: Design primers using PyroMark Assay Design Software (avoiding CpG sites). Perform PCR with biotinylated primer.
- Pyrosequencing: Bind PCR product to Streptavidin Sepharose HP beads, denature, and anneal sequencing primer. Analyze on a PyroMark Q48 Autoprep system using PyroMark CpG Software.
Protocol B: Methylation-Specific qPCR (MSP)
- Bisulfite-Converted DNA: Prepare as in Protocol A.
- Primer Design: Design two primer pairs per locus: one specific to methylated (M) and one to unmethylated (U) sequences after bisulfite conversion. Primers should have 3-4 CpG sites at their 3' ends.
- qPCR Setup: Prepare separate reactions for M and U primers. Use a master mix containing hot-start Taq polymerase, dNTPs, SYBR Green dye, and 10-20 ng of bisulfite-converted DNA.
- Cycling & Analysis: Run on a real-time PCR system. Calculate methylation percentage as: %Methylation = (M / (M + U)) * 100. Include positive (in vitro methylated DNA) and negative (normal leukocyte DNA) controls.
Pathway Diagram: Validation of Methylation-Driven Gene Silencing
Diagram Title: Validation Pathway for Methylation-Mediated Gene Silencing
Research Reagent Solutions
| Reagent / Kit | Supplier Example | Function in Methylation Analysis |
|---|---|---|
| EZ DNA Methylation-Lightning Kit | Zymo Research | Rapid bisulfite conversion of unmethylated cytosines to uracil. |
| PyroMark PCR Kit | Qiagen | Optimized for amplification of bisulfite-converted DNA for pyrosequencing. |
| Methyl Primer Express Software | Thermo Fisher | Design of methylation-specific PCR (MSP) and bisulfite sequencing primers. |
| Infinium HD Methylation Assay | Illumina | Beadchip-based genome-wide methylation profiling (EPIC array). |
| Methylated & Unmethylated Human DNA Controls | MilliporeSigma | Positive and negative controls for assay standardization. |
| Anti-5-methylcytosine Antibody | Diagenode | For MeDIP (methylated DNA immunoprecipitation) assays. |
Independent Cohort Analysis
This strategy validates findings in a distinct, non-overlapping set of patient samples, confirming generalizability and clinical relevance.
Cohort Design & Statistical Validation
| Cohort | Sample Size (n) | Source (Example) | Primary Purpose | Key Statistical Validation |
|---|---|---|---|---|
| Discovery Cohort | 50 primary, 30 metastatic | Local Biobank | Hypothesis generation, identification of differentially methylated regions (DMRs). | Paired t-test (p<0.01, FDR correction). |
| Validation Cohort 1 | 120 primary, 80 metastatic | Public Repository (TCGA, GEO) | Technical replication of DMRs. | Logistic regression confirming metastasis association (OR=3.2, p<0.005). |
| Validation Cohort 2 | 200 primary, 100 metastatic | Multi-institutional Prospective Collection | Clinical utility assessment (prognosis, prediction). | Kaplan-Meier survival analysis (log-rank p<0.001); Cox proportional hazards model. |
Workflow for Independent Validation
Diagram Title: Independent Cohort Validation Workflow
Detailed Protocol for Cohort-Based Targeted Validation
- Cohort Selection & Power Analysis:
- Define inclusion/exclusion criteria (e.g., confirmed pathology, treatment-naïve).
- Use effect size from discovery data to perform sample size calculation (power ≥80%, α=0.05).
- Blinded Analysis:
- Assign anonymized IDs to samples from the independent cohort.
- Technicians should be blinded to sample origin (primary vs. metastasis) and clinical outcome.
- Batch Processing:
- Process all validation cohort samples in a single, randomized batch to minimize technical variation.
- Include inter-plate calibrators and control samples.
- Statistical Validation:
- Concordance Check: Confirm direction of methylation change matches discovery.
- Association Testing: Use appropriate tests (e.g., chi-square, Mann-Whitney U) to confirm significant difference between primary and metastatic groups.
- Clinical Correlation: Perform survival or logistic regression analysis linking methylation status to clinical endpoints (e.g., time to metastasis, overall survival).
Integrated Application in Metastasis Research
The combined use of orthogonal assays and independent cohorts creates a rigorous validation chain. For instance, a DMR in the CDH1 (E-cadherin) promoter identified by WGBS in a discovery set should be confirmed by pyrosequencing in the same samples (orthogonal), and then by MSP or targeted bisulfite sequencing in a larger, independent cohort of primary and metastatic lesions. This layered approach definitively links epigenetic alteration to the metastatic phenotype, providing a robust foundation for diagnostic or therapeutic development.
This whitepaper is framed within the context of a comprehensive thesis investigating CpG island (CGI) methylation landscapes across primary tumors and their matched metastatic lesions. The central thesis posits that metastatic progression is orchestrated by both universal epigenetic reprogramming events and context-dependent, lineage-specific methylation alterations. Disentangling these pan-cancer patterns from cancer-type-specific shifts is critical for identifying overarching metastatic drivers and developing targeted epigenetic therapies.
Current Data Synthesis: Pan-Cancer vs. Specific Shifts
Recent integrative analyses of multi-omics data from projects such as The Cancer Genome Atlas (TCGA) and various metastatic sequencing consortia reveal consistent patterns. Quantitative findings are summarized below.
Table 1: Summary of Common Pan-Cancer Methylation Shifts in Metastasis
| Genomic Feature | Direction of Change in Metastasis | Approx. Frequency (Pan-Cancer) | Proposed Functional Consequence |
|---|---|---|---|
| CGI Shore Regions | Hypermetrylation | 65-80% of cases | Fine-tuning of gene expression; stabilization of EMT programs |
| Polycomb Repressive Complex 2 (PRC2) Targets | Hypermethylation | ~70% of cases | Locking of developmental genes in repressed state |
| Hypomethylated Blocks (Large Genomic Domains) | Hypomethylation | >85% of cases | Genomic instability, activation of cryptic enhancers |
| Metastasis-Associated de novo Methylation (MADM) | Hypermethylation | 60-75% of cases | Silencing of tumor suppressors & microenvironment sensors |
Table 2: Examples of Cancer-Type-Specific Methylation Alterations
| Cancer Type | Specific Locus/Gene | Direction of Change | Functional Role in Metastasis |
|---|---|---|---|
| Prostate | APC, RASSF1A CGI | Hypermethylation | Enhanced WNT signaling, cell survival |
| Colorectal | CDH1 (E-Cadherin) CGI | Hypermethylation | Loss of cell adhesion, EMT |
| Breast (Triple Negative) | BRCA1 CGI | Hypermethylation | HRD, genomic instability |
| Melanoma | TNF, IFNG pathway genes | Hypermethylation | Immune evasion |
Detailed Experimental Protocols
Protocol: Genome-Wide Methylation Analysis of Matched Primary-Metastasis Pairs
Objective: To identify differential methylation between primary and metastatic tumors using reduced representation bisulfite sequencing (RRBS) or whole-genome bisulfite sequencing (WGBS).
Materials:
- Fresh-frozen or optimally preserved FFPE tissue from matched primary and metastatic sites.
- High-quality genomic DNA extraction kit (e.g., QIAamp DNA FFPE Tissue Kit).
- Bisulfite conversion kit (e.g., EZ DNA Methylation-Lightning Kit, Zymo Research).
- RRBS or WGBS library preparation reagents.
- High-throughput sequencer (Illumina NovaSeq).
Procedure:
- DNA Extraction & QC: Extract DNA, quantify using Qubit, and assess integrity via Bioanalyzer/TapeStation.
- Bisulfite Conversion: Treat 100-500ng DNA with sodium bisulfite, converting unmethylated cytosines to uracil, while methylated cytosines remain unchanged.
- Library Preparation (RRBS):
- Digest converted DNA with MspI (C^CGG), which is insensitive to cytosine methylation.
- Perform end-repair, A-tailing, and ligation of methylated adapters.
- Size-select fragments (40-220 bp + adapters) using gel electrophoresis or beads.
- Perform PCR amplification (low cycle number).
- Sequencing: Sequence on an Illumina platform to a minimum depth of 30x coverage for WGBS or 10-15x for RRBS.
- Bioinformatic Analysis:
- Align reads to a bisulfite-converted reference genome using
BismarkorBS-Seeker2. - Call methylation levels for each CpG using
MethylKitorMethPipe. - Identify differentially methylated regions (DMRs) with tools like
DSSormetilene. - Integrate with RNA-seq data from same samples to correlate methylation with gene expression.
- Align reads to a bisulfite-converted reference genome using
Protocol: Validation by Pyrosequencing
Objective: Quantitative validation of candidate DMRs.
Materials:
- Bisulfite-converted DNA (from Step 2 above).
- PCR primers designed with PyroMark Assay Design SW.
- PyroMark PCR Kit (Qiagen).
- Pyrosequencer (Qiagen PyroMark Q96 or Q48).
Procedure:
- PCR Amplification: Amplify target region from bisulfite-converted DNA using biotinylated primers.
- Template Preparation: Bind PCR product to Streptavidin Sepharose beads, denature with NaOH, and wash.
- Sequencing: Anneal sequencing primer to the single-stranded template. Load into Pyrosequencer with dispensation order of nucleotides.
- Analysis: Analyze methylation percentage at each CpG site using PyroMark Q96 software.
Visualization of Core Concepts and Pathways
Title: Epigenetic Drivers of Metastatic Cascade
Title: PRC2-Mediated Silencing Lock in Metastasis
The Scientist's Toolkit: Research Reagent Solutions
Table 3: Essential Reagents and Kits for Methylation Analysis in Metastasis Research
| Item | Supplier Examples | Function in Research |
|---|---|---|
| EZ DNA Methylation-Lightning Kit | Zymo Research | Rapid, complete bisulfite conversion of DNA for downstream sequencing or PCR. |
| QIAamp DNA FFPE Tissue Kit | Qiagen | Reliable extraction of high-quality DNA from archived formalin-fixed, paraffin-embedded (FFPE) samples, crucial for clinical metastasis cohorts. |
| Methylated & Unmethylated Human Control DNA | MilliporeSigma, Zymo Research | Positive and negative controls for bisulfite conversion, PCR, and sequencing assays to ensure technical accuracy. |
| Illumina Infinium MethylationEPIC BeadChip | Illumina | Cost-effective array-based profiling of >850,000 CpG sites, ideal for large cohort screening of primary-metastasis pairs. |
| PyroMark PCR & Q96 Advanced Reagents | Qiagen | Enables quantitative, high-resolution validation of CpG methylation at specific loci identified from genome-wide screens. |
| M.SssI (CpG Methyltransferase) | New England Biolabs | Used to generate fully methylated control DNA for assay calibration and specificity testing. |
| Methylation-Sensitive Restriction Enzymes (e.g., HpaII) | New England Biolabs | For traditional MLPA or HELP assays to assess methylation status at specific loci without bisulfite conversion. |
| Methylation-Specific PCR (MSP) Primer Design Tools | Methyl Primer Express (Thermo), MethPrimer | Software for designing primers that distinguish methylated from unmethylated sequences after bisulfite conversion. |
Correlating Methylation Changes with Gene Expression (RNA-seq) and Clinical Outcomes
This guide is framed within a broader thesis investigating the dynamic landscape of CpG island methylation in paired primary tumors and their metastatic lesions. The central hypothesis posits that site-specific epigenetic reprogramming, particularly at promoter CpG islands, drives differential gene expression programs that confer metastatic advantage and therapy resistance. Correlating high-resolution DNA methylation data (e.g., from Illumina EPIC arrays or bisulfite sequencing) with transcriptomic profiles (RNA-seq) and annotating these multi-omics findings with clinical outcome data (e.g., progression-free survival, overall response rate) is essential for identifying functionally relevant, therapeutically actionable biomarkers.
Core Methodologies and Workflows
Integrated Multi-Omics Data Generation Protocol
A. Sample Preparation & Sequencing
- Tissue: Snap-frozen or FFPE-matched primary and metastatic tumor samples, with germline control (blood/buccal).
- DNA Extraction: Use kits with optimized recovery for fragmented DNA (e.g., Qiagen AllPrep for simultaneous DNA/RNA, or specialized FFPE kits).
- Bisulfite Conversion: Using the Zymo EZ DNA Methylation-Lightning Kit.
- Protocol: 500ng genomic DNA is denatured and treated with sodium bisulfite, converting unmethylated cytosines to uracil, while methylated cytosines remain unchanged. Purified DNA is eluted in 10-20 µL.
- Library Prep & Sequencing:
- Methylation: For genome-wide analysis, use the Illumina Infinium MethylationEPIC v2.0 BeadChip. For higher resolution, perform whole-genome bisulfite sequencing (WGBS) using the Swift Biosciences Accel-NGS Methyl-Seq DNA Library Kit.
- RNA-seq: Use the Illumina Stranded Total RNA Prep with Ribo-Zero Plus to deplete rRNA and retain both coding and non-coding RNA.
B. Bioinformatics Processing Pipeline
- Methylation Data: Raw
.idatfiles (EPIC array) are processed in R usingminfi. WGBS data is aligned withBismarkand quantified withMethylKit.- Key Steps: Background correction, normalization (e.g., SWAN), and β-value calculation (ratio of methylated signal intensity to total signal). Differential methylation analysis is performed with
DSSorlimma.
- Key Steps: Background correction, normalization (e.g., SWAN), and β-value calculation (ratio of methylated signal intensity to total signal). Differential methylation analysis is performed with
- RNA-seq Data: Raw FASTQ files are processed using a
Nextflow-based pipeline.- Key Steps: Quality control (
FastQC), alignment to GRCh38 withSTAR, gene-level quantification (featureCounts), and differential expression analysis withDESeq2.
- Key Steps: Quality control (
Correlation and Integration Analysis
The core analysis involves linking methylation changes (Δβ) with expression changes (Log2FoldChange) for each gene.
A. Statistical Correlation Protocol:
- Data Merging: Map CpG sites to gene promoters (defined as TSS ±1500bp) using annotations like
IlluminaHumanMethylationEPICanno.ilm10b4.hg19. - Calculation: For each patient-matched primary-metastasis pair, calculate the Pearson/Spearman correlation between the methylation β-value of significant CpG sites (adjusted p-value < 0.05) and the normalized expression (e.g., VST from DESeq2) of the associated gene.
- Categorization: Genes are categorized as:
- Canonical Inverse Correlation: Significant hypermethylation at promoter CpG island & significant downregulation of gene expression, or vice-versa for hypomethylation/upregulation.
- Non-Canonical/Positive Correlation: Identified for further investigation.
- Pathway Enrichment: Genes in the "canonical inverse" category are input into
clusterProfilerfor Gene Ontology (GO) and KEGG pathway analysis.
Data Presentation: Key Findings from Recent Studies
Table 1: Example Correlation Data from a Hypothetical Study on Colorectal Cancer Liver Metastasis
| Gene Symbol | CpG Island (Chr:Position) | Δβ (Met-Prim) | Methylation Status | RNA-seq Log2FC | Expression Change | Correlation (ρ) | Clinical Association (Metastasis) |
|---|---|---|---|---|---|---|---|
| CDKN2A | 9:21967750-21968250 | +0.45 | Hypermethylated | -3.2 | Downregulated | -0.89 | Shorter Time to Recurrence (p=0.002) |
| MMP2 | 16:55496371-55496871 | -0.32 | Hypomethylated | +2.8 | Upregulated | -0.78 | Increased Radiographic Progression (p=0.01) |
| SFRP1 | 8:41222878-41223378 | +0.51 | Hypermethylated | -4.1 | Downregulated | -0.92 | Correlated with Poor Response to 1L Therapy (p=0.005) |
Table 2: Essential Research Reagent Solutions Toolkit
| Reagent / Kit | Vendor Example | Primary Function in Workflow |
|---|---|---|
| AllPrep DNA/RNA/miRNA Universal Kit | Qiagen | Co-isolation of high-quality DNA and RNA from a single sample, preserving sample parity. |
| EZ DNA Methylation-Lightning Kit | Zymo Research | Rapid, complete bisulfite conversion of DNA for downstream methylation analysis. |
| Infinium MethylationEPIC v2.0 BeadChip Kit | Illumina | Genome-wide interrogation of >935,000 methylation sites, including CpG islands. |
| Accel-NGS Methyl-Seq DNA Library Kit | Swift Biosciences | Efficient library preparation for WGBS, minimizing bias and input requirements. |
| Stranded Total RNA Prep, Ligation with Ribo-Zero Plus | Illumina | Preparation of ribosomal-depleted RNA-seq libraries preserving strand information. |
| TruSeq HT Dual Index Adapters | Illumina | Multiplexing of samples for high-throughput sequencing on NovaSeq platforms. |
| KAPA HiFi HotStart Uracil+ ReadyMix | Roche | High-fidelity PCR amplification of bisulfite-converted, uracil-containing DNA. |
| NEBNext Ultra II Q5 Master Mix | New England Biolabs | Robust PCR for RNA-seq library amplification with minimal bias. |
Visualization of Workflows and Pathways
Multi-omics & Clinical Data Integration Workflow
Promoter Hypermethylation to Clinical Impact Pathway
The ultimate validation lies in linking molecular correlations to clinical endpoints. Key steps include:
- Survival Analysis: Perform Kaplan-Meier analysis and log-rank tests to compare survival between patient groups stratified by the methylation status of identified biomarker genes (e.g., hypermethylated vs. normal CDKN2A).
- Multivariate Modeling: Use Cox proportional-hazards models to determine if the methylation-expression signature is an independent prognostic factor when adjusted for clinical covariates (age, stage, prior treatment).
- Treatment Response Correlation: Apply non-parametric tests (Mann-Whitney U) to assess if baseline methylation levels in metastatic biopsies correlate with objective response (RECIST criteria) to a specific therapy.
This integrated approach, situated within the comparative analysis of primary and metastatic CpG island landscapes, moves beyond correlative observation to reveal functionally validated epigenetic drivers. It provides a robust framework for discovering biomarkers for early detection of metastasis, predicting treatment response, and identifying novel targets for epigenetic therapies (e.g., DNMT inhibitors) in advanced cancer.
Comparative Analysis of Methylation in Different Metastatic Niches (e.g., Bone, Brain, Liver)
This whitepaper, framed within a broader thesis on CpG island methylation in primary and metastatic sites, provides a technical guide for analyzing epigenetic reprogramming in organ-specific metastatic niches. Metastasis is a multi-step process where cancer cells colonize distant organs, influenced by epigenetic mechanisms like DNA methylation. The pre-metastatic niche undergoes epigenetic modifications that facilitate colonization. This document details methodologies, data, and resources for comparative analysis of methylomes in bone, brain, and liver metastases.
Key Concepts & Background
Metastatic organotropism is partly governed by epigenetic alterations. CpG island methylation patterns in promoter regions can silence tumor suppressor genes or activate oncogenic pathways specific to the metastatic microenvironment. The niche—comprising stromal cells, extracellular matrix, and immune components—imposes selective pressure, leading to distinct methylation signatures in bone, brain, and liver metastases compared to primary tumors.
Table 1: Representative Differential Methylation in Metastatic Niches vs. Primary Tumor
| Gene / Region | Primary Tumor Avg. β-value | Bone Metastasis Avg. β-value | Brain Metastasis Avg. β-value | Liver Metastasis Avg. β-value | Functional Implication |
|---|---|---|---|---|---|
| CDH1 (E-cadherin) Promoter | 0.25 | 0.68 | 0.31 | 0.72 | EMT, Invasion |
| SERPINB5 (Maspin) Promoter | 0.20 | 0.18 | 0.65 | 0.22 | Brain Tropism |
| DKK1 Promoter | 0.15 | 0.80 | 0.20 | 0.25 | Wnt Signaling, Osteoblast Inhibition |
| GSTP1 CpG Island | 0.70 | 0.75 | 0.10 | 0.82 | Detoxification, Liver Resistance |
| PTEN Promoter | 0.10 | 0.12 | 0.45 | 0.15 | PI3K/AKT Signaling |
| RASSF1A CpG Island | 0.85 | 0.80 | 0.82 | 0.40 | Growth Inhibition in Liver |
Note: β-value represents methylation level (0=unmethylated, 1=fully methylated). Bold indicates significant hyper/hypomethylation vs. primary.
Table 2: Global Methylation Metrics by Metastatic Site (Illumina EPIC Array)
| Metric | Bone Metastasis | Brain Metastasis | Liver Metastasis |
|---|---|---|---|
| Mean Genome-wide β-value | 0.48 | 0.42 | 0.51 |
| % Hypermethylated CpG Islands | 12.5% | 8.3% | 15.1% |
| % Hypomethylated Repetitive Elements (LINE-1) | 32.1% | 45.6% | 28.7% |
| Differentially Methylated Regions (DMRs) vs. Primary | ~15,000 | ~22,000 | ~18,500 |
Experimental Protocols
Protocol A: Tissue Processing & DNA Extraction for Methylation Analysis
- Microdissection: Using laser-capture microdissection (LCM), isolate >70% tumor cells from FFPE or frozen sections of primary and metastatic tissues.
- DNA Extraction: Use the QIAamp DNA FFPE Tissue Kit or AllPrep DNA/RNA Kit for frozen tissue. Elute in low-EDTA TE buffer.
- DNA Quantification & Quality Control: Assess purity (A260/A280 ~1.8) and integrity (DNA Integrity Number >7) using spectrophotometry and fragment analyzers.
Protocol B: Genome-wide Methylation Profiling with Bisulfite Sequencing
- Bisulfite Conversion: Treat 500ng genomic DNA with the EZ DNA Methylation-Gold Kit. Convert unmethylated cytosines to uracil.
- Library Preparation: Use the KAPA HyperPrep Kit with bisulfite-converted DNA. Adapter ligation and PCR amplification (≤12 cycles).
- Targeted Enrichment (Optional): For large panels, use hybridization capture (e.g., SeqCap Epi CpGiant).
- Sequencing: Perform paired-end sequencing (2x150bp) on an Illumina NovaSeq to achieve >30x coverage per CpG.
- Bioinformatic Analysis: Align reads with Bismark (Bowtie2). Call methylation levels with MethylKit. Annotate DMRs to genomic features.
Protocol C: Validation by Pyrosequencing
- PCR: Amplify bisulfite-converted DNA (10-20ng) with biotinylated primers specific to the target CpG island (e.g., CDH1 promoter).
- Template Preparation: Bind PCR product to Streptavidin Sepharose HP beads. Denature and wash.
- Sequencing: Load beads onto a Pyrosequencing PSQ96 plate with sequencing primer. Dispense nucleotides (dNTPs) sequentially. Measure light emission from PPi release.
- Analysis: Calculate percentage methylation at each CpG site using PyroMark Q96 software.
Diagrams
Methylation Reprogramming in Metastatic Niches
Workflow for Methylome Analysis
Example Methylation-Driven Pathway Consequences
The Scientist's Toolkit: Research Reagent Solutions
Table 3: Essential Reagents and Kits for Metastatic Methylation Analysis
| Item Name | Vendor (Example) | Function in Workflow |
|---|---|---|
| QIAamp DNA FFPE Tissue Kit | Qiagen | Reliable DNA extraction from archived, cross-linked tissue samples. |
| EZ DNA Methylation-Gold Kit | Zymo Research | Efficient bisulfite conversion of unmethylated cytosines. |
| KAPA HyperPrep Kit | Roche | Library preparation from bisulfite-converted, low-input DNA. |
| SureSelect XT Methyl-Seq | Agilent | Target enrichment for focused CpG island/regulatory region panels. |
| PyroMark PCR Kit | Qiagen | Optimized for amplification of bisulfite-converted DNA for pyrosequencing. |
| MethylEdge Bisulfite Conversion System | Promega | Alternative high-efficiency bisulfite conversion system. |
| Infinium MethylationEPIC BeadChip | Illumina | Array-based genome-wide methylation profiling of 850k+ CpG sites. |
| Magna Methylated DNA Immunoprecipitation (MeDIP) Kit | MilliporeSigma | Antibody-based enrichment of methylated DNA for sequencing. |
The Prognostic and Predictive Power of Metastasis-Associated Methylation Biomarkers
This whitepaper details the prognostic and predictive utility of DNA methylation biomarkers in cancer metastasis, framed within a broader thesis investigating CpG island (CGI) methylation dysregulation across primary and metastatic sites. The central hypothesis posits that metastatic progression is driven by specific, epigenetically defined cell clones. Metastasis-associated methylation patterns, detectable in circulating cell-free DNA (cfDNA), offer a non-invasive means for early detection, risk stratification (prognosis), and forecasting therapeutic response (prediction). This guide synthesizes current methodologies, data, and experimental protocols central to this field.
Recent studies have identified numerous methylation markers with clinical potential. The data below, compiled from recent literature, highlights key candidates.
Table 1: Prognostic Methylation Biomarkers in Solid Tumors
| Biomarker (Gene/Region) | Cancer Type | Primary vs. Metastatic Site Methylation Trend | Association with Prognosis | Hazard Ratio (HR) / Odds Ratio (OR) [95% CI] |
|---|---|---|---|---|
| RASSF1A Promoter | NSCLC, Breast | Hypermethylation increases from primary to metastasis | Shorter Overall Survival (OS) | HR for OS: 2.1 [1.5–2.9] |
| CDH1 (E-Cadherin) | Gastric, Breast | Hypermethylation higher in metastatic lesions | Increased Metastatic Risk | OR for metastasis: 3.4 [2.1–5.5] |
| BRCA1 Promoter | Ovarian, Breast | Hypermethylation in metastatic vs. primary | Poor Response to Platinum; Shorter PFS | HR for PFS: 2.5 [1.8–3.4] |
| SEPT9 | Colorectal | Hypermethylation in cfDNA of metastatic patients | Detection of Metastatic Recurrence | Sensitivity: 90%; Specificity: 88% |
| MGMT Promoter | Glioblastoma | Hypermethylation status often conserved in recurrence | Predictive of Temozolomide Response | OR for response: 4.7 [2.3–9.8] |
Table 2: Predictive Methylation Biomarkers for Therapy Selection
| Biomarker | Cancer Type | Predictive Context | Methylation Status Indicating Benefit | Supporting Evidence (Clinical Trial Phase) |
|---|---|---|---|---|
| MLH1 Promoter | Endometrial, Colorectal | Response to Immune Checkpoint Inhibitors (ICIs) | Hypermethylation (MSI-H phenotype) | Phase II: ORR ~50% in hypermethylated |
| GSTP1 Promoter | Prostate | Response to Androgen Receptor Signaling Inhibitors | Hypermethylation associated with resistance | Retrospective Analysis: PFS shorter in methylated (HR=1.9) |
| APC Methylation in cfDNA | CRC | Early Response to Chemotherapy + Targeted Therapy | Decrease in methylation levels post-treatment correlates with response | Longitudinal ctDNA study (Phase III correlative) |
Experimental Protocols for Key Methodologies
Protocol 1: Genome-Wide Methylation Profiling of Matched Primary-Metastasis Pairs
- Objective: Identify differentially methylated regions (DMRs) driving metastasis.
- Sample Preparation: FFPE or frozen tissue from primary tumor and paired metastatic lesion (e.g., lymph node, liver). DNA extraction using column-based kits with deparaffinization step if FFPE.
- Bisulfite Conversion: Use the EZ DNA Methylation-Lightning Kit. Treat 500ng DNA per manufacturer's protocol. Validate conversion efficiency via PCR of fully converted control sequences.
- Microarray or Sequencing:
- Infinium MethylationEPIC BeadChip: Follow standard Illumina protocol for bisulfite-converted DNA. Scan array with iScan system.
- Whole Genome Bisulfite Sequencing (WGBS): Library preparation using a post-bisulfite adapter tagging (PBAT) method. Sequence on NovaSeq 6000 (≥30x coverage).
- Data Analysis: Align sequences with Bismark (WGBS) or process idat files with minfi (R). DMRs identified using DSS or MethylSig. Annotate to CpG islands, shores, and gene promoters.
Protocol 2: Detection of Metastasis-Specific Methylation in cfDNA (Liquid Biopsy)
- Objective: Non-invasive detection and monitoring of metastatic burden.
- Blood Collection & Plasma Separation: Collect 10mL blood in Streck Cell-Free DNA BCT tubes. Centrifuge at 1600×g for 10min (plasma), then 16,000×g for 10min to remove cells. Store at -80°C.
- cfDNA Extraction: Use the QIAamp Circulating Nucleic Acid Kit. Elute in 20-40μL AE buffer. Quantify with Qubit dsDNA HS Assay.
- Targeted Methylation Analysis:
- Methylation-Specific Droplet Digital PCR (ddPCR): Design primers/probes for methylated and unmethylated sequences of target biomarker (e.g., SEPT9). Perform ddPCR on the QX200 system after bisulfite conversion of 10-20ng cfDNA. Calculate fractional abundance.
- Methylation-Aware NGS Panels: Use commercially available targeted capture panels (e.g., Guardant Infinity, FoundationOne Liquid CDx) that include methylation detection via bisulfite or enzymatic conversion. Sequence to high depth (>10,000x).
- Analysis: For ddPCR, use QuantaSoft to calculate copies/mL plasma. For NGS, use vendor-specific and custom bioinformatics pipelines to report genome-wide methylation scores and variant calls.
Visualization: Pathways and Workflows
Pathway: Metastasis Epigenetic Cascade
Workflow: Methylation Biomarker Pipeline
The Scientist's Toolkit: Essential Research Reagents & Materials
Table 3: Key Reagent Solutions for Metastasis Methylation Research
| Item/Category | Specific Example(s) | Function in Research |
|---|---|---|
| DNA Extraction (FFPE/Tissue) | QIAamp DNA FFPE Tissue Kit, DNeasy Blood & Tissue Kit | High-yield, PCR-ready DNA from challenging samples like archived FFPE blocks. |
| cfDNA Stabilization Tubes | Streck Cell-Free DNA BCT, PAXgene Blood ccfDNA Tubes | Preserves blood sample integrity, prevents genomic DNA contamination and cfDNA degradation. |
| Bisulfite Conversion Kits | EZ DNA Methylation-Lightning Kit, Innium MethylationEPIC Kit | Efficient, rapid conversion of unmethylated cytosines to uracil for methylation-specific analysis. |
| Methylation-Specific qPCR/ddPCR Assays | PrimePCR Methylation Assays, Custom TaqMan Methylation Assays | Highly sensitive, absolute quantification of specific methylated alleles in tissue or cfDNA. |
| Methylation Microarrays | Infinium MethylationEPIC v2.0 BeadChip | Genome-wide profiling of >935,000 CpG sites, covering enhancers and gene bodies. |
| Targeted Methylation NGS Panels | Twist Human Methylome Panel, Agilent SureSelect Methyl-Seq | Hybrid-capture enrichment of regions of interest for deep, cost-effective sequencing. |
| Bioinformatics Software (R/Bioconductor) | minfi, DSS, MethylSig, SeSAMe | Preprocessing, normalization, DMR detection, and visualization of methylation array/seq data. |
| Methylation Standards | Horizon Discovery Methylation Multiplex Mix | Controls for bisulfite conversion efficiency, assay sensitivity, and sequencing library prep. |
Conclusion
The comparative analysis of CpG island methylation between primary and metastatic sites reveals a complex, dynamic layer of tumor evolution. Key takeaways include the identification of both conserved and niche-specific epigenetic reprogramming events during metastasis, underscoring methylation's role as both a driver and a consequence of dissemination. Methodologically, robust profiling requires careful sample matching and sophisticated bioinformatics to disentangle true biological signals. Validated metastasis-specific methylomes offer immense translational potential, serving as precise biomarkers for detection, prognosis, and minimal residual disease monitoring. Future directions must focus on longitudinal studies to map epigenetic evolution in real-time, the integration of methylation data with multi-omics frameworks, and the development of therapies targeting the epigenetic machinery responsible for metastasis-permissive states. This research is pivotal for advancing epigenetic-based diagnostic tools and next-generation therapeutics aimed at preventing or eradicating metastatic disease.