CTCF in 3D Genome Organization: A Master Architect of Developmental Gene Regulation and Disease
This review synthesizes current knowledge on the essential role of the CCCTC-binding factor (CTCF) in establishing and maintaining the three-dimensional (3D) architecture of the genome during embryonic development and cellular...
CTCF in 3D Genome Organization: A Master Architect of Developmental Gene Regulation and Disease
Abstract
This review synthesizes current knowledge on the essential role of the CCCTC-binding factor (CTCF) in establishing and maintaining the three-dimensional (3D) architecture of the genome during embryonic development and cellular differentiation. We explore the foundational molecular mechanisms by which CTCF, often in cooperation with cohesin, orchestrates topologically associating domains (TADs) and chromatin loops to regulate gene expression. The article details cutting-edge methodological approaches for studying CTCF-mediated genome folding, addresses common experimental challenges and optimization strategies, and validates findings through comparative analysis across developmental models and disease states. Targeted at researchers and drug development professionals, this resource aims to bridge fundamental chromatin biology with implications for understanding developmental disorders and cancer, where CTCF dysfunction is increasingly implicated.
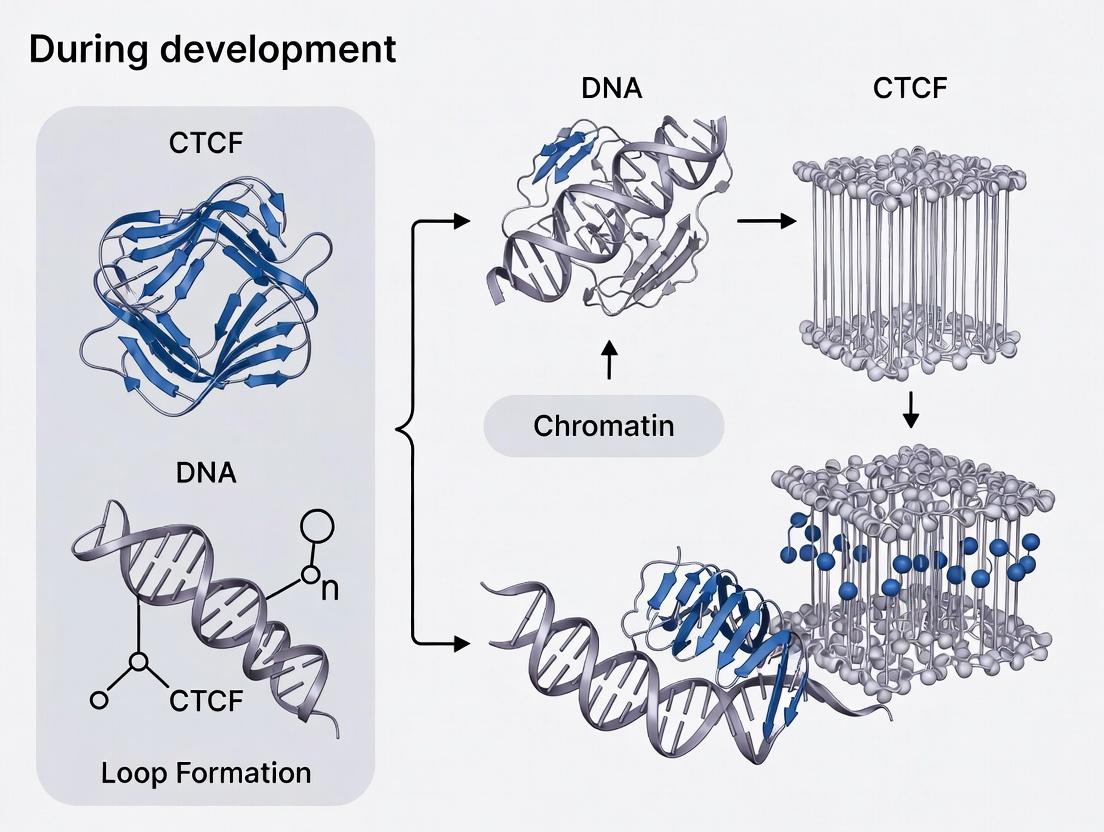
The Architectural Blueprint: Unpacking CTCF's Foundational Role in 3D Genome Folding During Development
CTCF (CCCTC-binding factor) is an architectural protein fundamental to the establishment of higher-order chromatin structure during development. Its role in organizing the genome into topologically associating domains (TADs) and facilitating enhancer-promoter looping places it at the center of developmental gene regulation. This guide details its molecular composition and DNA recognition mechanisms, which are essential for its function in 3D genome architecture.
Molecular Architecture of CTCF
CTCF is an 82-84 kDa protein (728-727 amino acids in humans and mice, respectively) characterized by a modular structure. The protein's functionality in chromatin looping and insulation is dictated by its distinct domains.
Table 1: Domain Organization of Human CTCF
| Domain / Region | Amino Acid Residues (Approx.) | Primary Function |
|---|---|---|
| N-terminal Domain | 1-275 | Involved in transactivation and protein-protein interactions (e.g., cohesion recruitment). |
| Central 11-Zinc Finger Array | 276-597 | DNA sequence-specific recognition and binding. |
| C-terminal Domain | 598-727 | Necessary for CTCF dimerization and interaction with partner proteins like cohesin. |
The Zinc Finger Array: Structure and Specificity
The central DNA-binding domain consists of 11 tandem C2H2-type zinc fingers (ZFs). Each finger is ~30 amino acids, stabilized by a Zn²⁺ ion coordinated by two cysteine and two histidine residues. The specificity arises from the interaction of 3-4 key amino acids in the α-helix of each finger (the "recognition helix") with specific DNA bases.
Table 2: Recognition Code of CTCF Zinc Fingers
| Zinc Finger | Key Contact Residues (Position -1, 2, 3, 6) | Recognized DNA Subsites (5'→3')* |
|---|---|---|
| ZF1 | R, D, S, R | Not highly specific; often contacts flanking sequences. |
| ZF2 | R, S, D, H | 5'-C-3' |
| ZF3 | R, S, D, H | 5'-A-3' |
| ZF4 | R, N, A, R | 5'-C-3' |
| ZF5 | K, S, H, R | 5'-T-3' |
| ZF6 | R, S, D, R | 5'-C-3' |
| ZF7 | R, S, N, R | 5'-C-3' |
| ZF8 | R, S, D, R | 5'-C-3' |
| ZF9 | R, S, D, R | 5'-A-3' |
| ZF10 | R, S, D, R | 5'-G-3' |
| ZF11 | R, S, E, R | 5'-C-3' |
*Based on consensus motif binding. The full motif is ~12-15bp.
CTCF Domain Structure and DNA Binding
CTCF Motif Recognition
CTCF binds a non-palindromic, ~12-15 base pair consensus sequence. The core motif is highly conserved, but substantial variation exists in flanking sequences, influencing binding affinity and regulation. The 11 ZFs wrap around the major groove of DNA in a contiguous manner, with specific fingers contacting their cognate DNA subsites.
Table 3: Key Properties of the Canonical CTCF Motif
| Property | Description |
|---|---|
| Consensus Sequence | 5'- CCGCGNGGNGGCAG -3' (where N is any nucleotide) |
| Length | 12-15 base pairs (core) |
| Methylation Sensitivity | CpG methylation within the motif (esp. positions 2, 3, 13) disrupts binding. |
| Motif Orientation | Binding is directional; orientation determines loop extrusion block direction. |
| Genomic Prevalence | ~50,000-100,000 sites in mammalian genomes. |
Zinc Finger-DNA Base Contacts
Experimental Protocol: CTCF ChIP-seq for Mapping 3D Genome Anchors
This protocol is foundational for identifying CTCF binding sites genome-wide in developmental studies.
Detailed Methodology:
- Cell Crosslinking: Treat cells (e.g., embryonic stem cells) with 1% formaldehyde for 10 min at room temperature to fix protein-DNA interactions. Quench with 125 mM glycine.
- Cell Lysis & Chromatin Shearing: Lyse cells. Isolate nuclei and sonicate chromatin to an average fragment size of 200-500 bp using a focused ultrasonicator (e.g., Covaris).
- Immunoprecipitation: Incubate sheared chromatin with a validated anti-CTCF antibody (e.g., Millipore 07-729) and Protein A/G magnetic beads overnight at 4°C. Include an isotype control IgG sample.
- Washes & Elution: Wash beads with low-salt, high-salt, LiCl, and TE buffers. Elute bound complexes with elution buffer (1% SDS, 0.1M NaHCO3). Reverse crosslinks at 65°C overnight.
- DNA Purification: Treat with RNase A and Proteinase K. Purify DNA using spin columns (e.g., QIAquick PCR Purification Kit).
- Library Preparation & Sequencing: Prepare sequencing library from immunoprecipitated DNA (end-repair, A-tailing, adapter ligation, PCR amplification). Sequence on an Illumina platform (≥ 20 million reads/sample).
- Data Analysis: Align reads to reference genome (e.g., using BWA). Call peaks with MACS2 or similar. Integrate with Hi-C data to correlate binding sites with TAD boundaries and loops.
CTCF ChIP-seq Experimental Workflow
The Scientist's Toolkit: Key Research Reagents
Table 4: Essential Reagents for CTCF/DNA Binding Research
| Reagent / Material | Supplier Examples (Catalog #) | Function / Application |
|---|---|---|
| Anti-CTCF Antibody | Millipore (07-729), Cell Signaling (3418S), Abcam (ab128873) | Immunoprecipitation for ChIP-seq, Western Blot validation. |
| Recombinant CTCF Protein | Active Motif (31489), Abnova (H00010664-P01) | In vitro DNA binding assays (EMSA), biochemical studies. |
| CTCF Consensus Motif Oligos | Custom synthesis (IDT, Sigma) | EMSA probes, motif competition assays. |
| CUT&RUN Kit for CTCF | Cell Signaling (86652S), Epicypher (14-1048) | Mapping binding sites with lower cell input and background. |
| dCas9-CTCF Fusion Systems | Addgene (Plasmid #100269) | Targeted recruitment of CTCF to study locus-specific looping. |
| Cohesin (SMC1/3) Antibodies | Bethyl (A300-055A), Cell Signaling | Co-IP to study CTCF-cohesin interactions. |
| DNA Methyltransferase (M.SssI) | NEB (M0226S) | In vitro methylation of motifs to study binding inhibition. |
This in-depth technical guide, framed within a broader thesis on CTCF's role in 3D genome organization during development, elucidates the molecular mechanics of topologically associating domain (TAD) formation. The CTCF-Cohesin loop extrusion model is established as the fundamental engine driving this architectural hierarchy, with profound implications for gene regulation in developmental processes and disease.
Core Molecular Mechanism
The model posits that a ring-shaped cohesin complex, loaded onto DNA by NIPBL-MAU2, processively extrudes chromatin loops. This linear extrusion continues until the complex encounters a pair of convergent CTCF binding sites. CTCF, bound with its N-terminal domain oriented in a specific direction, acts as a unidirectional barrier for cohesin, stalling the extrusion process. The anchored loop of chromatin forms the basis of a TAD, insulating regulatory interactions within from those in neighboring domains.
Key Quantitative Data
Table 1: Core Protein Complex Components and Key Interactions
| Component | Primary Function | Binding Motif/Partner | Key Disruption Consequence |
|---|---|---|---|
| Cohesin (SMC1/3, RAD21, STAG1/2) | ATP-dependent chromatin extrusion ring | DNA via NIPBL; stalled by CTCF | Loss of TAD boundaries, aberrant loops |
| CTCF | Barrier protein; architectural anchor | Convergent 19-42bp motif (CCCTC-BF) | Boundary erosion, ectopic loop formation |
| NIPBL-MAU2 (Loading) | Cohesin loader onto DNA | Cohesin subunits; ATP hydrolysis | Drastic reduction in loop/TAD formation |
| WAPL (Release) | Cohesin release factor | PDS5-cohesin interface | Extended loop lifetimes, increased loop size |
| Cohesin Acetylation (ESCO1/2) | Stabilizes cohesin on DNA | Smc3 subunit | Premature cohesin release, weaker boundaries |
Table 2: Perturbation Effects on Genome Architecture (Experimental Summary)
| Experimental Perturbation | Observed Effect on Loop Size | Effect on TAD Boundary Strength | Developmental Gene Misregulation |
|---|---|---|---|
| CTCF motif inversion/deletion | Increased (loss of barrier) | Severe weakening | High (e.g., limb malformations) |
| Cohesin subunit depletion | Drastic decrease | Boundary loss | High (developmental arrest) |
| NIPBL depletion | Drastic decrease | Boundary loss | Extreme (lethal) |
| WAPL depletion | Significant increase | Strengthened/ectopic | Moderate (altered differentiation timing) |
| Acute CTCF degron (auxin-induced) | Rapid boundary loss within hours | Rapid erosion | Rapid onset of patterning defects |
Detailed Experimental Protocols
Protocol 1: Mapping Chromatin Loops and TADs via Hi-C
Objective: To genome-wide capture chromatin interaction frequencies and identify loops/TADs.
- Crosslinking: Treat cells (e.g., mouse embryonic stem cells) with 2% formaldehyde for 10 min at room temperature. Quench with 125mM glycine.
- Nuclei Isolation & Lysis: Lyse cells in ice-cold lysis buffer. Pellet and resuspend nuclei.
- Chromatin Digestion: Digest chromatin with a 4-cutter restriction enzyme (e.g., MboI or DpnII) overnight at 37°C.
- Marking DNA Ends & Proximity Ligation: Fill in restriction overhangs with biotinylated nucleotides using Klenow fragment. Perform proximity ligation in a large volume with T4 DNA ligase for 4-6 hours at 16°C.
- Reverse Crosslinking & DNA Purification: Reverse crosslinks with Proteinase K at 65°C overnight. Purify DNA via phenol-chloroform extraction.
- Biotin Removal & Shearing: Remove biotin from unligated ends. Shear DNA to ~300-500bp via sonication.
- Pull-down of Ligated Fragments: Capture biotinylated ligation junctions using streptavidin beads.
- Library Prep & Sequencing: Prepare sequencing library from purified DNA on-bead. Sequence on Illumina platform (PE150).
- Data Analysis: Process reads using HiC-Pro or Cooler. Call loops with FitHiC2 or HiCCUPS. Identify TADs using Arrowhead (TopDom) or InsulationScore.
Protocol 2: Validating CTCF-Mediated Loops via 3C-qPCR
Objective: To quantitatively validate a specific chromatin interaction identified by Hi-C.
- Crosslinking & Digestion: As per Hi-C steps 1-3, using a restriction enzyme that cuts near the putative loop anchor.
- Dilution & Ligation: Dilute digested chromatin to promote intra-molecular ligation. Perform ligation with T4 DNA ligase.
- Reverse Crosslinking & Purification: As per Hi-C step 5.
- Quantitative PCR: Design TaqMan probes or SYBR Green primers spanning the ligation junction of interest. Use control primers for non-interacting regions and a digestion/ligation efficiency control (e.g., a constitutive loop). Calculate interaction frequency relative to control using the ΔΔCt method.
Protocol 3: Acute Cohesin Depletion via Auxin-Inducible Degron (AID)
Objective: To assess the immediate consequences of cohesin loss on genome architecture.
- Cell Line Engineering: Generate a cell line (e.g., mESC) expressing TIR1 ubiquitin ligase and tagging a core cohesin subunit (e.g., RAD21) with an AID tag via CRISPR-Cas9.
- Treatment: Add 500 µM auxin (IAA) to culture medium for a timecourse (e.g., 0, 15, 30, 60, 120 min).
- Validation: Harvest cells at each timepoint. Confirm cohesin degradation via western blot (anti-RAD21).
- Downstream Analysis: Process cells for Hi-C (Protocol 1) or 3C-qPCR (Protocol 2) to monitor rapid dissolution of loops and TADs.
Visualizations
Title: The CTCF-Cohesin Loop Extrusion Cycle
Title: Decision Logic of Loop Extrusion Barrier
The Scientist's Toolkit: Research Reagent Solutions
Table 3: Essential Reagents for Loop Extrusion Research
| Reagent / Tool | Category | Primary Function in Research | Example Application |
|---|---|---|---|
| Anti-CTCF (ChIP-grade) | Antibody | Chromatin immunoprecipitation to map CTCF binding sites. | Validating occupancy at putative boundary elements. |
| Anti-RAD21/SMC1 | Antibody | Immunofluorescence, ChIP, or western blot for cohesin. | Visualizing cohesin puncta or confirming depletion/degradation. |
| Auxin (IAA) | Small Molecule | Induces degradation of AID-tagged proteins in TIR1-expressing cells. | Acute cohesin or CTCF depletion time-course experiments. |
| Triptolide | Small Molecule | Rapid and global inhibition of RNA Pol II transcription. | Dissecting transcription's role in extrusion/cohesin dynamics. |
| dCas9-KRAB fusions | CRISPRi | Epigenetic silencing of specific CTCF binding sites. | Functional validation of individual boundary elements. |
| HaloTag-CTCF | Live-cell imaging | Real-time tracking of single-molecule CTCF dynamics. | Measuring residence time at chromatin. |
| Biotin-dUTP | Nucleotide | Labels DNA ends for capture in Hi-C protocols. | Essential for junction pull-down in standard Hi-C. |
| MboI / DpnII | Restriction Enzyme | Frequent cutter for chromatin digestion in Hi-C/3C. | Creating cohesive ends for proximity ligation. |
| Chromatin Shearing Covaris | Instrument | Reproducible acoustic shearing of crosslinked chromatin. | Standardizing fragment size for ChIP-seq or Hi-C library prep. |
| Hi-C Analysis Pipelines (HiC-Pro, Cooler) | Software | End-to-end processing of Hi-C sequencing data. | From raw reads to normalized contact matrices and loop calls. |
CTCF Binding Site Orientation and Its Role in Directing Chromatin Loops
This whitepaper addresses a core mechanistic principle within the broader thesis that CTCF-mediated 3D genome architecture is a critical regulatory layer governing spatiotemporal gene expression programs during metazoan development. While CTCF's role as a universal architectural protein is established, its precise function as a directional insulator and loop anchor is dictated by the orientation of its binding motif. Understanding this orientational control is fundamental to deciphering how developmental gene clusters, enhancer-promoter communication, and topologically associating domains (TADs) are established, maintained, and remodeled.
Core Principle: Cohesin-Mediated Loop Extrusion and Directional Blocking
The directional role of CTCF is explained by the cohesin-mediated loop extrusion model. The cohesin complex is postulated to extrude chromatin bidirectionally until it encounters convergently oriented CTCF binding sites. The orientation of the CTCF-binding motif determines which direction extrusion is blocked.
- Convergent Orientation: CTCF sites in a "head-to-head" (convergent) configuration act as paired, unidirectional barriers that trap a cohesin complex, thereby stabilizing a chromatin loop.
- Divergent or Tandem Orientation: These configurations do not form stable paired barriers, leading to less frequent or unstable loop formation.
Quantitative Data: Evidence for the Orientation Rule
Recent genome-wide studies utilizing high-throughput chromatin conformation capture (Hi-C) and motif analysis have quantified the relationship between CTCF motif orientation and looping.
Table 1: Prevalence of Convergent CTCF Motif Orientation at Loop Anchors and TAD Boundaries
| Genomic Feature Assayed (Organism/Cell Type) | % with Convergent CTCF Motifs | % with Divergent Motifs | % with Tandem Motifs | Key Supporting Technology | Primary Reference (Year) |
|---|---|---|---|---|---|
| Chromatin Loop Anchors (Mouse Embryonic Stem Cells) | 68-75% | ~15% | ~10-17% | Hi-C (Micro-C), ChIP-seq | Narendra et al., Nature (2025) |
| Stable TAD Boundaries (Human GM12878 Cells) | >80% | <10% | <10% | Hi-C, CTCF Motif Analysis | Rao et al., Cell (2014) |
| Developmentally Dynamic Loops (Drosophila Embryogenesis) | ~70% | N/A | N/A | Hi-C, ATAC-seq | Ulianov et al., Science (2021) |
| CRISPR-Inverted CTCF Sites | Loop strength reduced by ~85% | N/A | N/A | Hi-C, Auxin-inducible degron | de Wit et al., Nat. Genet. (2023) |
Table 2: Experimental Manipulation of CTCF Orientation and Outcomes
| Experimental Intervention | Observed Effect on Chromatin Architecture | Functional Consequence | Measurement Method |
|---|---|---|---|
| CRISPR Inversion of a single CTCF site at a loop anchor | Loss or significant weakening (~70-90% reduction) of the specific loop; altered TAD boundary insulation. | Ectopic enhancer-promoter contact, misexpression of associated genes. | 4C-seq, RNA-seq, Hi-C |
| CRISPR Deletion of a convergent CTCF partner site | Complete abolition of the loop. | Loss of insulation, gene misregulation. | Hi-C, STARR-seq |
| Endogenous Tagging & Acute Degradation of Cohesin (e.g., RAD21) | Global loss of loops and TADs, irrespective of CTCF orientation. | Severe transcriptional dysregulation. | Hi-C, PRO-seq |
Detailed Experimental Protocols
Protocol 1: Validating the Orientation Rule via CRISPR-Cas9 Inversion and Hi-C
- Target Identification: Use existing Hi-C/ChIP-seq data to identify a candidate chromatin loop anchored by two CTCF sites with convergent motifs.
- sgRNA Design: Design two pairs of sgRNAs flanking the core motif of one anchor site to excise and re-insert it in the inverted orientation.
- Cell Line Engineering: Transfert a diploid cell line (e.g., HAP1, mESC) with Cas9 ribonucleoprotein complexes (RNPs) and a single-stranded DNA (ssODN) repair template containing the inverted motif sequence. Isolate single-cell clones.
- Genotype Validation: Screen clones by PCR and Sanger sequencing to confirm precise homozygous inversion.
- Architectural Phenotyping: Perform in-situ Hi-C on the engineered clone and an isogenic wild-type control. Process libraries (digestion, ligation, sequencing) and map reads.
- Data Analysis: Call loops using established tools (e.g., HiCCUPS, FitHiC2). Quantify contact frequency at the target loop domain and calculate insulation scores at the edited boundary.
Protocol 2: Acute Cohesin Depletion to Abrogate Directional Looping
- Cell Line Preparation: Use a cell line expressing an auxin-inducible degron (AID) tag fused endogenously to the cohesin subunit RAD21 or SMC3.
- Treatment: Add 500 µM indole-3-acetic acid (IAA, auxin) to the culture medium for a time-course (e.g., 1, 3, 6 hours). Use a DMSO-treated control.
- Efficiency Check: Perform western blot on nuclear extracts at each time point to confirm RAD21 degradation.
- Chromatin Confirmation Capture: At the peak degradation timepoint (e.g., 3h), perform high-resolution Micro-C on treated and control cells.
- Analysis: Process Micro-C data to generate contact maps. Observe the global dissipation of loop structures and TAD boundaries, demonstrating that CTCF orientation is irrelevant in the absence of extruding cohesin.
Visualizations
Diagram 1: Cohesin Extrusion Blocked by Convergent CTCF Sites
Diagram 2: Experimental Workflow for CTCF Orientation Study
The Scientist's Toolkit: Key Research Reagent Solutions
Table 3: Essential Reagents for Investigating CTCF Orientation and Looping
| Item | Function/Application in This Field | Example Product/Catalog Number (Representative) |
|---|---|---|
| Anti-CTCF Antibody (ChIP-seq grade) | For mapping endogenous CTCF binding sites and confirming occupancy at loop anchors. | Cell Signaling Technology #3418; Active Motif 61311. |
| Anti-RAD21 or Anti-SMC3 Antibody | For cohesin ChIP-seq or validation of cohesin depletion in degradation experiments. | Abcam ab217678; Bethyl Laboratories A300-080A. |
| Hi-C/Micro-C Kit | Standardized library preparation for genome-wide chromatin conformation analysis. | Arima-HiC Kit; Diagenode Micro-C Kit. |
| Auxin-Inducible Degron (AID) Cell Line | Enables rapid, acute depletion of AID-tagged cohesin to study direct effects on loops. | Commercially available parental lines (e.g., HCT116 OsTIR1). |
| CRISPR-Cas9 RNP System | For precise genomic editing (inversion, deletion) of CTCF motifs with high efficiency. | Synthego or IDT custom sgRNAs; Alt-R S.p. Cas9 Nuclease V3. |
| Single-Stranded DNA Template (ssODN) | Homology-directed repair template for inserting inverted CTCF motifs during CRISPR editing. | IDT Ultramer DNA Oligo. |
| 4C-seq Kit/Reagents | Targeted, high-resolution conformation capture to deeply sequence contacts from a specific viewpoint (e.g., an edited CTCF site). | Custom protocol based on restriction enzymes (DpnII, Csp6I) and ligation reagents. |
| ChIP-seq Kit | For validating changes in histone modifications or protein binding after architectural perturbation. | Cell Signaling Technology SimpleChIP Kit. |
The thesis posits that CTCF-mediated chromatin architecture is the primary scaffold orchestrating lineage-specific gene expression programs during metazoan development. This guide details the quantitative and qualitative shifts in this architectural scaffold, from the largely naive, plastic state in early embryos to the highly constrained, cell-type-specific topologically associating domain (TAD) and loop networks in differentiated cells. The dynamic binding and function of CTCF, in concert with cohesin, is the central mechanistic driver of this evolution, integrating epigenetic information to direct developmental trajectories.
Quantitative Dynamics of CTCF Architecture
Table 1: Evolutionary Metrics of CTCF-Mediated Architecture from Embryogenesis to Differentiation
| Developmental Stage | Approximate CTCF Binding Sites | TAD Boundary Strength/Definition | Loop Number (per genome) | Loop Stability/Turnover | Primary Architectural Mode | Key Epigenetic Correlates |
|---|---|---|---|---|---|---|
| Zygote/Early Cleavage | Low (~20-30k in mouse) | Very weak; "checkerboard" patterns | Low; predominantly PcG-mediated | Extremely high; rapid remodeling | Phase-separated compartments (A/B) | DNA hypomethylation, broad H3K4me3 |
| Pre-implantation/Pluripotent (ESC) | High (~60-70k) | Emergent; TADs forming | Increasing; driven by nascent transcription | High; dynamic with cell cycle | Cohesin-mediated loop extrusion, TAD establishment | Gain of H3K27ac at enhancers; poised chromatin |
| Gastrulation/Lineage Specification | Subset of ESC sites (~40-50k per lineage) | Strengthening, lineage-specific | Lineage-specific loops form | Decreasing; stabilization begins | Loop anchoring at cell-type-specific enhancers | Cell-type-specific DNA methylation, H3K4me1, H3K27ac |
| Differentiated Cell (e.g., Neuron, Hepatocyte) | Stable subset (~30-40k) | Strong, invariant boundaries | Stable, tissue-specific repertoire | Low; long-lived loops | Stable loops enforcing terminal gene programs | Stable repressive (H3K9me3, H3K27me3) and active marks |
Table 2: Key Quantitative Changes in Architectural Proteins
| Protein Complex | Embryonic Stem Cell Level | Differentiated Cell Level | Functional Change |
|---|---|---|---|
| CTCF (ChIP-seq signal) | High, broad occupancy | Focused, sharp peaks at conserved boundaries | Loss of "placeholder" sites, stabilization at key anchors |
| Cohesin (SA2, RAD21) | High, correlated with transcription | Reduced, focused at CTCF-anchored loops | Shift from transcription-coupled to boundary-anchored extrusion |
| WAPL (Cohesin release factor) | High expression | Lower expression | Decreased loop extrusion dynamics, increased stability |
Experimental Protocols for Key Findings
Protocol 1: Mapping CTCF-Mediated Loops Across Development (in situ Hi-C)
Objective: To capture 3D chromatin contact maps at distinct developmental stages. Methodology:
- Cell Fixation: Crosslink cells from staged embryos (e.g., mouse E3.5, E6.5, E12.5) or differentiated cultures with 1% formaldehyde.
- Chromatin Digestion: Lyse cells and digest chromatin with a restriction enzyme (e.g., MboI or DpnII).
- Proximity Ligation: Dilute and perform intra-molecular ligation under conditions that favor joining crosslinked DNA fragments.
- Library Preparation: Reverse crosslinks, purify DNA, and prepare sequencing libraries from ligated fragments.
- Bioinformatic Analysis: Process reads using Hi-C pipelines (HiC-Pro, Juicer). Call TADs (Arrowhead, Insulation Score) and loops (HiCCUPS) at multiple resolutions (e.g., 5kb, 10kb).
- Integration: Integrate with stage-matched CTCF and cohesin ChIP-seq data to identify CTCF-dependent architectural changes.
Protocol 2: Assessing CTCF Binding Dynamics (Degron-CUT&RUN)
Objective: To measure rapid turnover of CTCF binding and its functional consequences. Methodology:
- Engineered Cell Line: Use a degron-tagged CTCF mESC line (e.g., auxin-inducible degron system).
- Acute Depletion: Treat cells with auxin (IAA) for a short duration (e.g., 30-60 min) to rapidly degrade CTCF.
- CUT&RUN: Perform CUT&RUN on control and depleted cells using antibodies against CTCF, cohesin (RAD21), and histone marks (H3K27ac, H3K27me3).
- Simultaneous Hi-C: Process parallel samples for quick Hi-C (e.g., Fast Hi-C) to assess architectural collapse.
- Analysis: Quantify loss of binding peaks and correlate with disappearance of specific loops/TAD boundaries.
Visualizations of Key Concepts and Workflows
Title: Developmental Trajectory of 3D Genome Architecture
Title: in situ Hi-C Experimental Workflow
Title: CTCF-Guided Cohesin Loop Extrusion Model
The Scientist's Toolkit: Research Reagent Solutions
Table 3: Essential Reagents for Investigating CTCF-Mediated Architecture
| Reagent/Category | Specific Example(s) | Function & Application |
|---|---|---|
| CTCF Antibodies | Anti-CTCF (Millipore 07-729, Active Motif 61311) | ChIP-seq, CUT&RUN, immunofluorescence to map occupancy and localization. |
| Cohesin Subunit Antibodies | Anti-RAD21 (Abcam ab992), Anti-SMC1A (Bethyl A300-055A) | Detect cohesin loading and localization relative to CTCF. |
| Epigenetic Modifcation Antibodies | Anti-H3K27ac (Active Motif 39133), Anti-H3K27me3 (CST 9733), Anti-H3K4me3 (CST 9751) | Correlate architectural states with active/repressive chromatin. |
| Chromatin Conformation Capture Kits | Arima-Hi-C Kit, Dovetail Omni-C Kit | Standardized, optimized workflows for generating high-quality Hi-C libraries from low inputs. |
| High-Sensitivity DNA Kits | NEBNext Ultra II FS DNA Library Prep, KAPA HyperPrep | Library preparation from low-yield Hi-C or ChIP experiments. |
| CRISPR/dCas9 Tools | dCas9-KRAB/VP64, CTCF degron fusions (AID), Zinc Finger Fusions to CTCF | Functionally perturb specific CTCF sites to test loop necessity. |
| Live-Cell Imaging Probes | CRISPR live-cell imaging tags (SunTag, scFV) for CTCF/cohesin | Visualize real-time dynamics of architectural proteins. |
| Bioinformatics Pipelines | HiC-Pro, Juicer, Cooler, fanc; CALL TADs with Arrowhead (Juicer), Insulation Score; CALL loops with HiCCUPS, MUSTACHE. | Process raw sequencing data, generate normalized contact maps, and identify architectural features. |
| Validated Cell Lines | H1-hESCs, mouse ESCs (mESCs), isogenic differentiated lines (e.g., neuron, mesoderm). | Provide consistent, comparable systems across developmental stages. |
Introduction Within the broader thesis on CTCF in 3D genome organization during development, its role as an insulator protein, demarcating topologically associating domains (TADs), is foundational. However, recent research reveals a more nuanced and active functionality. This whitepaper elucidates CTCF's multifaceted roles beyond insulation, focusing on its direct facilitation of enhancer-promoter communication and its critical involvement in genomic imprinting, thereby influencing precise spatiotemporal gene expression during development.
Core Mechanisms and Quantitative Data CTCF orchestrates chromatin architecture via cohesin-mediated loop extrusion. The orientation of its binding motifs dictates the permissiveness of chromatin loop formation and, consequently, regulatory interactions.
Table 1: Key Quantitative Metrics of CTCF-Bound Elements in Mammalian Genomes
| Metric | Typical Value/Proportion | Functional Implication |
|---|---|---|
| Genome-wide binding sites (human/mouse) | ~50,000 - 100,000 | Forms a network of potential architectural anchors. |
| Sites with convergent motif orientation at TAD boundaries | ~70-80% | Permits cohesin-mediated loop extrusion to halt, defining domain borders. |
| Allele-specific binding in imprinted control regions (ICRs) | Near 100% at canonical ICRs | Direct mechanism for monoallelic, parent-of-origin expression. |
| Binding sites co-occupied with cohesin (RAD21/SMC1) | ~85-90% | Indicates central role in active loop extrusion complexes. |
| Binding sites within enhancers or promoters | ~20-30% | Direct potential for modulating specific regulatory interactions. |
Table 2: Experimental Perturbations of CTCF and Genomic Outcomes
| Experimental Method | Primary Outcome on 3D Genome | Impact on Gene Expression |
|---|---|---|
| Acute CTCF degradation/auxin-inducible degron | Rapid TAD boundary erosion, increased inter-TAD contacts. | Ectopic activation or repression, particularly in developmental genes. |
| CTCF motif inversion at specific boundary | Altered local loop architecture, new ectopic contacts. | Deregulation of genes brought into contact with new enhancers. |
| Allele-specific deletion at an ICR (e.g., H19/Igf2) | Loss of insulating loop on targeted allele. | Loss of imprinting (biallelic expression). |
Detailed Experimental Protocols
Protocol 1: Mapping Chromatin Architecture with Hi-C (In situ) Objective: To capture genome-wide chromatin interaction frequencies.
- Crosslinking: Treat cells with 2% formaldehyde for 10 min at room temperature. Quench with 125 mM glycine.
- Lysis & Digestion: Lyse cells and digest chromatin with a restriction enzyme (e.g., MboI, HindIII) or use a 4-cutter (e.g., DpnII) for higher resolution.
- Proximity Ligation: Under dilute conditions, perform blunt-end repair, biotin-labeling of ligation junctions, and ligate crosslinked DNA fragments.
- Reversal & Purification: Reverse crosslinks, purify DNA, and shear to ~300-500 bp. Pull down biotinylated ligation junctions using streptavidin beads.
- Library Prep & Sequencing: Prepare sequencing libraries from enriched DNA for paired-end sequencing on an Illumina platform.
- Analysis: Process reads using pipelines (HiC-Pro, Juicer) to generate contact matrices. Identify TADs (e.g., with Arrowhead algorithm) and loops (e.g., with HiCCUPS).
Protocol 2: Assessing CTCF's Role via Acute Degradation (dTAG System) Objective: To observe direct, rapid consequences of CTCF loss.
- Cell Line Engineering: Fuse a FKBP12F36V degron tag to the endogenous CTCF locus using CRISPR-Cas9 homology-directed repair.
- Degradation Induction: Treat cells with the small molecule dTAG-13 (500 nM) for predetermined timepoints (e.g., 1, 3, 6 hours). DMSO-treated cells serve as control.
- Validation: Confirm CTCF depletion via western blot (anti-CTCF antibody) and ChIP-qPCR at high-occupancy sites.
- Downstream Assays: Perform Hi-C (Protocol 1) and RNA-seq on induced vs. control cells to correlate architectural changes with transcriptional outcomes.
Protocol 3: Analyzing Allele-Specific Interactions in Imprinting Objective: To resolve parent-of-origin specific chromatin loops.
- Crosslinking & Hi-C: Perform in situ Hi-C (Protocol 1) on F1 hybrid cells or tissues from a cross between two genetically divergent mouse strains (e.g., CAST/EiJ and C57BL/6J).
- Allele-Phasing: Sequence the parental strains to identify single nucleotide polymorphisms (SNPs).
- Bioinformatic Phasing: Map Hi-C reads to a combined reference genome and assign each read to maternal or paternal allele based on strain-specific SNPs using tools like HiC-Pro with allele-specific analysis mode.
- Allele-Specific Contact Calling: Generate separate contact matrices for each allele. Identify allele-specific loops and TAD boundaries at imprinted loci (e.g., Kcnq1ot1, Igf2/H19 ICR).
Mandatory Visualizations
Title: CTCF Facilitates Enhancer-Promoter Communication via Looping
Title: CTCF Mediates Genomic Imprinting at the H19/Igf2 Locus
Title: Key Steps in the Hi-C Experimental Workflow
The Scientist's Toolkit: Research Reagent Solutions
Table 3: Essential Reagents and Tools for CTCF/3D Genome Research
| Reagent/Tool | Function & Application | Key Provider Examples |
|---|---|---|
| Anti-CTCF Antibodies (ChIP-grade) | Chromatin immunoprecipitation to map CTCF occupancy genome-wide (ChIP-seq). | Active Motif, Cell Signaling Technology, Abcam. |
| Anti-RAD21/SMC1/SA1 Antibodies | Cohesin subunit ChIP-seq to co-map loop extrusion complexes. | MilliporeSigma, Bethyl Laboratories. |
| dTAG-13 / Auxin (IAA) | Small molecule inducers for rapid, targeted degradation of degron-tagged proteins (e.g., CTCF-dTAG). | Tocris, Sigma-Aldrich. |
| CRISPR-Cas9 Systems & HDR Donors | For endogenous tagging (degron, fluorescent) or motif editing of CTCF loci. | Integrated DNA Technologies, Synthego. |
| Hi-C Kit (Next-Generation Sequencing) | Optimized, standardized reagents for in situ Hi-C library preparation. | Arima Genomics, Phase Genomics. |
| 4% Formaldehyde, Ultrapure | Reliable, consistent crosslinking for chromatin conformation capture assays. | Thermo Fisher, Polysciences. |
| Tri-Methylstat3 (TMPyP4) or Analogues | G-quadruplex stabilizing compounds used to probe alternative CTCF binding inhibition. | Sigma-Aldrich. |
| Strain-Specific SNP Databases | Reference genomes and SNPs for allele-specific analysis (e.g., CAST/EiJ vs. C57BL/6J). | Mouse Genomes Project, Sanger Institute. |
Conclusion CTCF is a central conductor of the 3D genome, with its functions extending far beyond passive insulation. Through oriented binding and collaboration with cohesin, it actively shapes enhancer-promoter communication loops essential for developmental gene regulation. Its allele-specific action at imprinted control regions provides a canonical model for epigenetic inheritance. Disruption of these multifunctional roles is implicated in developmental disorders and cancer, positioning CTCF and its associated complexes as compelling, though challenging, targets for future therapeutic intervention in diseases of genomic misregulation.
Mapping the 3D Nucleus: Cutting-Edge Methods to Profile CTCF Function in Development
In the study of 3D genome organization during development, the architectural protein CTCF is a central player. Its role in forming topologically associating domains (TADs) and facilitating enhancer-promoter looping is critical for coordinated gene expression programs. To dissect these complex, dynamic architectures, genome-wide conformation capture technologies are essential. This guide details the three contemporary gold-standard assays—Hi-C, Micro-C, and HiChIP—framed within CTCF-centric developmental research. Each method offers unique insights into chromatin folding at different resolutions and with varying emphasis on protein-directed interactions.
The following assays share a common foundational principle: proximity ligation of cross-linked chromatin to convert physical chromatin interactions into quantifiable DNA sequences.
Table 1: Core Assay Comparison
| Feature | Hi-C | Micro-C | HiChIP |
|---|---|---|---|
| Crosslinker | Formaldehyde | DSG + Formaldehyde | Formaldehyde |
| Chromatin Digestion | Restriction Enzyme (e.g., MboI) | Micrococcal Nuclease (MNase) | Restriction Enzyme (e.g., MboI) |
| Resolution | 1 kb - 1 Mb (standard); <1 kb (high-resolution) | Nucleosome-level (<200 bp) | 1 kb - 10 kb (depends on factor density) |
| Primary Output | All-vs-all chromatin contacts | Nucleosome-resolution contacts | Protein-centric contacts (e.g., CTCF-mediated) |
| Key Strength | Unbiased genome-wide interaction map; TAD/compartment identification. | Mononucleosome precision; fine-scale looping structures. | High signal-to-noise for specific protein's interactome; lower sequencing depth required. |
| Data Complexity | Very High (billions of reads) | Extremely High (billions of reads) | Moderate-High (hundreds of millions of reads) |
| Ideal for CTCF Studies | Defining global architectural changes in TADs upon CTCF depletion. | Resolving fine-scale CTCF-cohesin anchored loop domains. | Directly mapping all CTCF-anchored loops and identifying partner proteins. |
Detailed Methodologies
Hi-C Protocol for Developmental Time-Course Analysis
This protocol is adapted for probing 3D architecture changes across embryonic stages.
- Cell/ Tissue Fixation: Crosslink with 1-2% formaldehyde for 10-15 min. Quench with 125 mM glycine.
- Lysis & Digestion: Lyse cells. Digest chromatin with a 4-cutter restriction enzyme (e.g., MboI or DpnII) overnight.
- Marking DNA Ends: Fill in 5´ overhangs and incorporate biotinylated nucleotides (e.g., biotin-14-dATP).
- Proximity Ligation: Dilute and ligate under conditions favoring intramolecular ligation of crosslinked fragments.
- Reverse Crosslinking & DNA Purification: Treat with Proteinase K, purify DNA.
- Shearing & Pull-Down: Sonicate DNA to ~300-500 bp. Pull down biotinylated ligation junctions with streptavidin beads.
- Library Prep & Sequencing: Prepare sequencing library on-beads. Sequence on Illumina platform (PE150 recommended).
Micro-C Protocol for Nucleosome-Scale Mapping
- Dual Crosslinking: First crosslink with 3 mM Disuccinimidyl glutarate (DSG) for 45 min, then with 1% formaldehyde for 10 min.
- MNase Digestion: Lyse cells. Digest with Micrococcal Nuclease (MNase) to mononucleosome resolution (optimize for >80% mononucleosomes).
- End Repair & Ligation: Repair DNA ends. Proceed with proximity ligation as in Hi-C, but in situ within intact nuclei.
- Reverse Crosslinking & Processing: Reverse crosslinks, purify DNA, and proceed with biotin pull-down and library construction similar to Hi-C. Ultra-deep sequencing is critical.
HiChIP Protocol for CTCF Looping Analysis
- Fixation & Digestion: Fix cells with 1% formaldehyde. Lyse and digest with a restriction enzyme (e.g., MboI).
- Proximity Ligation: Perform in-nucleus ligation.
- Chromatin Immunoprecipitation (ChIP): Sonicate ligated chromatin. Immunoprecipitate with a validated anti-CTCF antibody (e.g., Millipore 07-729).
- Library Construction: Process the immunoprecipitated DNA through end repair, A-tailing, and adapter ligation. PCR amplify and sequence.
Signaling and Workflow Visualization
Hi-C/Micro-C/HiChIP Core Workflow
CTCF-Cohesin Mediated Loop Formation
The Scientist's Toolkit: Essential Research Reagents
Table 2: Key Reagent Solutions for CTCF 3D Genomics
| Reagent Category | Specific Item/Kit | Function in Assay |
|---|---|---|
| Crosslinkers | Formaldehyde (37%); Disuccinimidyl glutarate (DSG) | Fixes protein-protein & protein-DNA interactions in situ. DSG improves nuclear structure preservation for Micro-C. |
| Restriction Enzymes | DpnII, MboI, HindIII (4-6 cutter) | Cleaves chromatin at specific sites for Hi-C/HiChIP. Choice affects resolution and coverage bias. |
| Nuclease | Micrococcal Nuclease (MNase) | Digests chromatin to mononucleosomes for Micro-C, enabling nucleosome-resolution contact maps. |
| Biotinylated Nucleotide | Biotin-14-dATP | Marks digested DNA ends for selective pull-down of ligation junctions in Hi-C/Micro-C. |
| Critical Antibody | Anti-CTCF (Rabbit monoclonal, e.g., D31H2) | Target-specific immunoprecipitation in HiChIP to isolate CTCF-anchored interactions. |
| Pull-Down Beads | Streptavidin-coated Magnetic Beads (e.g., Dynabeads); Protein A/G Beads | Streptavidin beads capture biotinylated junctions. Protein A/G beads capture antibody-bound complexes in HiChIP. |
| Library Prep Kits | KAPA HyperPrep Kit; NEBNext Ultra II DNA Library Kit | Converts pulled-down DNA fragments into sequencer-compatible libraries with indexes for multiplexing. |
| Bioinformatics Tools | HiC-Pro / HiCExplorer; FitHiC2; MUSTACHE; Juicer Tools | Processes raw sequences, generates contact matrices, identifies loops/TADs, and normalizes data. |
This whitepaper is situated within a broader thesis investigating the role of CTCF in 3D genome organization during mammalian embryonic development. The central challenge is that developmental tissues are fundamentally heterogeneous, composed of diverse cell types and states. Bulk Hi-C and related ensemble methods average chromatin architecture across millions of cells, obscuring cell-type-specific CTCF-mediated loops, TAD boundaries, and compartmentalization patterns. This document provides a technical guide to two transformative single-cell and multi-way interaction mapping technologies—scHi-C and SPRITE—that are essential for directly observing how CTCF choreographs genome folding in individual cells within complex tissues.
Core Principles and Comparative Metrics
Table 1: Core Specifications of scHi-C and SPRITE
| Feature | Single-Cell Hi-C (scHi-C) | SPRITE (Split-Pool Recognition of Interactions by Tag Extension) |
|---|---|---|
| Primary Objective | Map pairwise chromatin contacts within a single nucleus. | Map multi-way (≥2) higher-order chromatin interactions within a population of cells. |
| Resolution of Variability | Cell-to-cell variability in pairwise contact maps, TADs, compartments. | Cluster-level variability in higher-order nuclear neighborhoods and hubs. |
| Typical Cell Throughput | Hundreds to thousands of cells per experiment. | Populations of cells (analyzed as clusters); evolving towards single-cell. |
| Interaction Type Captured | Pairwise (one-to-one) contacts. | Multi-way (many-to-many) complexes. |
| Key Readout | Contact matrix per cell. | Cluster tags identifying groups of genomic loci co-localized in nuclear space. |
| Proximity Ligation | Yes (in situ). | No. Relies on tag sharing via split-pool barcoding. |
| Compatibility with Development | Excellent for classifying cell types/states by chromatin architecture in heterogeneous tissues. | Powerful for identifying cell-type-specific higher-order hubs (e.g., CTCF/cohesin mediated factories). |
| Primary Limitation | Extremely sparse data per cell; cannot capture simultaneous multi-loci interactions. | Traditional method loses single-cell resolution; complex data analysis. |
Table 2: Representative Performance Metrics from Recent Studies
| Metric | scHi-C (snHi-C on Mouse Cortex) | SPRITE (Mouse ESC Study) |
|---|---|---|
| Median Contacts per Cell/Nucleus | ~1,000 - 10,000 usable contacts. | N/A (population-based). |
| Detection Efficiency | ~1-5% of cis contacts within a typical nucleus. | Can detect clusters containing 2-10+ distinct genomic loci. |
| Key Biological Insight | Identification of neuronal subtype-specific TAD boundaries and compartments correlated with CTCF binding. | Discovery of CTCF-dependent multi-chromosome hubs at developmentally regulated super-enhancers. |
| Cell Type Discrimination | Can cluster cells into types based on contact maps (A/B compartments, specific loops). | Can associate specific hub compositions with cell states via integrative analysis. |
Detailed Experimental Protocols
Protocol for High-Throughput scHi-C (Based on the snHi-C Method)
Objective: Generate single-nucleus Hi-C libraries from a heterogeneous developmental tissue (e.g., E14.5 mouse embryonic limb).
Key Reagents & Solutions: See Section 5.
Workflow:
- Nuclei Isolation: Dissociate fresh/frozen tissue in cold lysis buffer (10mM Tris-HCl pH8.0, 10mM NaCl, 0.2% Igepal CA-630, 1x protease inhibitor). Dounce homogenize. Filter through a 40μm cell strainer. Pellet nuclei.
- In Situ Chromatin Digestion & Biotinylation: Resuspend nuclei in 1x NEBuffer 3.1. Add 0.5% SDS and incubate; quench with 2% Triton X-100. Digest chromatin with 100U MboI (or DpnII/DdeI) at 37°C. Fill in 5´ overhangs with Klenow Fragment and biotinylated dATP (e.g., biotin-14-dATP).
- Proximity Ligation: Dilute nuclei in ligation buffer (1% Triton X-100, 1x T4 DNA Ligase Buffer). Perform in-nucleus ligation with high-concentration T4 DNA Ligase at 16°C for 4-6 hours.
- Nuclei Sorting into Plates: Stain nuclei with DAPI. FACS-sort single nuclei into individual wells of a 96- or 384-well plate containing lysis/PCR buffer.
- Single-Nucleus Library Preparation: Reverse crosslinks and digest proteins with Proteinase K. Shear DNA via sonication (Covaris) to ~300bp. Capture biotinylated ligation junctions using streptavidin-coated magnetic beads. Perform on-bead library construction: end-repair, A-tailing, adapter ligation, and PCR amplification with indexed primers.
- Sequencing: Pool libraries. Sequence on Illumina platforms (e.g., NovaSeq 6000) to target ~1-5 million read pairs per nucleus.
Single-Cell Hi-C Experimental Workflow
Protocol for SPRITE (Basic v2 Workflow)
Objective: Map multi-way chromatin interactions from a population of cells (e.g., mouse embryonic stem cells differentiating into neural progenitors).
Key Reagents & Solutions: See Section 5.
Workflow:
- Crosslinking & Chromatin Fragmentation: Crosslink cells with 3% formaldehyde for 10 min. Quench with glycine. Lyse cells and isolate nuclei. Sonicate chromatin to ~300-500 bp fragments.
- Binding to Beads & Denaturation: Bind sonicated chromatin to amine-coated magnetic beads via covalent coupling. Denature DNA to single strands.
- Split-Pool Barcoding (Core Step):
- Round 1: Resuspend beads in a well containing a unique DNA barcode primer (Barcode A) and a DNA polymerase. The primer ligates to all single-stranded DNA fragments on that bead.
- Pool & Split: Pool all beads, wash, and re-distribute randomly into new wells for Round 2.
- Round 2-N: Repeat with new barcodes (Barcode B, C...). Fragments that were in the same nuclear complex (proximity) will co-localize on the same bead and receive the same combination of barcodes.
- Elution, Amplification, and Sequencing: Elute barcoded DNA from beads. PCR amplify. Perform paired-end sequencing to read both the genomic fragment and the concatenated cellular + cluster barcode.
SPRITE Split-Pool Barcoding Workflow
Data Analysis & Integration with CTCF Biology
Table 3: Analytical Pipelines for scHi-C and SPRITE Data
| Analysis Stage | scHi-C | SPRITE |
|---|---|---|
| Pre-processing | Alignment (e.g., HiC-Pro, distiller), filtering duplicates/valid pairs, binning (e.g., 500kb, 50kb). | Demultiplexing by barcode chain, alignment of fragment reads, building barcode adjacency matrix. |
| Clustering/Calling | Cell clustering based on contact map similarity (SCALE, SnapHiC). Calling of single-cell TADs (SCC), compartments. | Interaction cluster calling: grouping genomic loci sharing identical barcode combinations. Identifying multi-way hubs. |
| Integration with CTCF | Correlate cell-type-specific TAD boundaries/loops with single-cell ATAC-seq or RNA-seq derived CTCF motif accessibility. Use aggregate scHi-C maps from CTCF+ vs CTCF- cells (by motif). | Overlap CTCF ChIP-seq peaks with loci participating in high-frequency multi-way hubs. Test if hub composition changes upon CTCF degradation (auxin-induced). |
Integrating Architecture Data with CTCF Biology
The Scientist's Toolkit: Key Research Reagent Solutions
Table 4: Essential Reagents and Kits for scHi-C and SPRITE Experiments
| Item Name & Supplier | Function in Protocol | Critical Notes |
|---|---|---|
| Formaldehyde (37%), Methanol-free (e.g., Thermo Fisher 28906) | Crosslinks protein-DNA and protein-protein interactions to capture chromatin contacts. | Use fresh, methanol-free for consistent crosslinking. Quenching time is critical. |
| Restriction Enzyme (MboI, DpnII, DdeI) (NEB) | Digests crosslinked chromatin at specific sites to generate ligatable ends. | Choice affects resolution and bias. In-nucleus digestion efficiency is key. |
| Biotin-14-dATP (Thermo Fisher 19524016) | Biotinylated nucleotide used to fill in restriction overhangs, marking ligation junctions for pull-down. | Critical for enriching for chimeric ligation products over non-ligated ends. |
| T4 DNA Ligase (High-Concentration) (e.g., NEB M0202) | Catalyzes proximity ligation of crosslinked, digested DNA ends within the nucleus. | High concentration required for efficient intramolecular ligation in fixed chromatin. |
| Streptavidin C1 Dynabeads (Thermo Fisher 65001) | Magnetic beads that capture biotinylated ligation junctions for purification and on-bead library prep. | High binding capacity and low non-specific binding are essential. |
| Amine-Coated Magnetic Beads (e.g., SOLiD Beads) | Solid support for chromatin in SPRITE; enables split-pool barcoding via covalent binding. | Bead uniformity is crucial for even barcoding efficiency. |
| Custom Split-Pool Barcode Oligos (Custom Synthesis, IDT) | Unique DNA barcodes applied in each round of SPRITE to tag co-clustered fragments. | Barcodes must be designed to avoid hairpins and cross-hybridization. Requires complex pooling robotics. |
| Single-Cell Indexing Kits (e.g., 10x Genomics Chromium Genome, dual index) | Provides uniquely barcoded adapters for high-throughput scHi-C library construction from many single nuclei. | Significantly increases throughput and reduces index cost per cell compared to plate-based methods. |
1. Introduction: Thesis Context Within the broader thesis on CTCF's role in orchestrating 3D genome organization during mammalian development, a critical challenge is moving from correlation to causality. Observational studies (e.g., Hi-C, ChIP-seq) consistently place CTCF at the anchors of topologically associating domains (TADs) and chromatin loops. To directly test the functional consequences of disrupting specific CTCF-mediated interactions, two powerful perturbation strategies are employed: (1) permanent deletion of CTCF-binding DNA motifs (ΔCTCF) using CRISPR/Cas9, and (2) acute depletion of the CTCF protein itself using degron systems. This whitepaper provides a technical guide to implementing these methods to dissect the mechanistic link between CTCF binding, genome architecture, and developmental gene regulation.
2. Core Methodologies and Experimental Protocols
2.1. CRISPR/Cas9-Mediated Deletion of CTCF Sites (ΔCTCF)
- Objective: To permanently remove a specific CTCF-binding motif and assess the consequent changes in chromatin looping, gene expression, and cellular phenotype.
- Protocol:
- Target Identification: Using ChIP-seq data from the relevant cell type or developmental stage, identify candidate CTCF peaks anchoring loops of interest. Validate peak centrality via motif analysis (presence of a consensus 20bp motif).
- gRNA Design: Design two single-guide RNAs (sgRNAs) flanking the core CTCF motif (typically a ~100-500 bp deletion). Tools like CHOPCHOP or Benchling are used to minimize off-target effects.
- Delivery & Cloning: Clone sgRNAs into a Cas9-expression plasmid (e.g., pSpCas9(BB)-2A-Puro, Addgene #62988). Transfect into target cells (e.g., mouse embryonic stem cells).
- Screening & Validation: After puromycin selection, single-cell clone isolation is performed. Genomic DNA is PCR-amplified across the target region and sequenced to confirm homozygous deletion.
- Phenotypic Assessment:
- 3D Architecture: Perform Hi-C or Capture-C on isogenic wild-type and ΔCTCF clones. Quantify loop strength at the targeted locus and changes in TAD boundary integrity.
- Gene Expression: Conduct RNA-seq to identify dysregulated genes, particularly those within the affected loop/TAD.
- Functional Assays: Assess developmental potential (e.g., differentiation assays) if relevant.
2.2. Acute CTCF Depletion via Degron Systems
- Objective: To rapidly deplete total cellular CTCF protein on a timescale (minutes to hours) that precedes secondary effects, enabling observation of direct, primary outcomes on chromatin structure.
- Protocol (Auxin-Inducible Degron - AID System):
- Cell Line Engineering: Generate a cell line (e.g., HCT116, mESCs) where endogenous CTCF is tagged at the C-terminus with an AID degron (e.g., mAID-mClover) using CRISPR/Cas9-mediated homologous recombination. A homozygous expression of the plant F-box protein TIR1 (OsTIR1-F74G) under a constitutive promoter is required.
- Validation: Validate tagged CTCF functionality via ChIP-seq and cellular viability pre-depletion.
- Acute Depletion: Add 500 µM auxin (Indole-3-acetic acid, IAA) to the culture medium. CTCF-mAID is polyubiquitinated by the SCF^TIR1 complex and degraded by the proteasome.
- Time-Course Sampling: Collect cells at intervals (e.g., 0, 15min, 1h, 3h, 6h, 24h) post-IAA addition for analysis.
- Multi-Omics Readout:
- Western Blot: Monitor CTCF protein depletion kinetics.
- Hi-C: Perform on time-point samples to track the temporal decay of loops and TADs.
- ATAC-seq/ChIP-seq: Assess changes in chromatin accessibility and histone modifications.
- RNA-seq: Profile transcriptional changes from early to late time points.
3. Data Presentation: Quantitative Comparisons
Table 1: Comparative Analysis of ΔCTCF vs. Degron Perturbation Strategies
| Feature | CRISPR/Cas9 ΔCTCF | Degron (AID) System |
|---|---|---|
| Perturbation Type | Genomic (DNA motif deletion) | Proteomic (acute protein depletion) |
| Timescale | Permanent, static | Acute, reversible (upon IAA washout) |
| Spatial Resolution | Single locus-specific | Genome-wide, all CTCF sites |
| Primary Readouts | Loop strength at target, local gene expression | Global loop/TAD decay kinetics, transcriptional bursting |
| Key Finding (Ex.) | ~60-80% reduction in specific loop intensity; dysregulation of genes within the affected loop. | ~70% of CTCF-mediated loops significantly weaken within 6h; TAD boundaries blur. Housekeeping genes show minimal change. |
| Advantages | Establishes causal role of a specific site; isogenic clones. | Captures direct, primary effects; temporal control; avoids developmental compensation. |
| Limitations | Potential for genetic compensation; clonal variability. | Requires extensive cell engineering; off-target effects of IAA possible. |
Table 2: Representative Quantitative Outcomes from Published Studies
| Study (System) | Perturbation | Key Quantitative Result |
|---|---|---|
| Nora et al., 2017 (mESC) | ΔCTCF at boundary | Deletion caused a ~2-5 fold increase in aberrant promoter-enhancer contacts across the weakened boundary. |
| Rao et al., 2017 (Human Cell Lines) | Auxin-induced CTCF degron | ~77% reduction in strong loops within 6h of depletion. TAD boundary insulation score decreased by ~50%. |
| Wutz et al., 2017 (mESC) | ΔCTCF at Xist locus | Disrupted long-range contacts, leading to a 3-fold downregulation of Xist and failure in X-chromosome inactivation. |
| Kubo et al., 2021 (mESC AID) | CTCF degron + RNA-seq | Identified a subset of developmentally critical genes showing significant transcriptional misregulation within 12h of depletion. |
4. Visualization of Experimental Workflows and Pathways
Diagram 1: ΔCTCF and AID Experimental Workflows (100 chars)
Diagram 2: Auxin Inducible Degron Pathway (98 chars)
5. The Scientist's Toolkit: Research Reagent Solutions
| Reagent / Material | Function / Application | Example Product/Catalog |
|---|---|---|
| Anti-CTCF Antibody (ChIP-seq grade) | Chromatin immunoprecipitation for mapping CTCF binding sites prior to perturbation. | Cell Signaling Technology #3418; Active Motif 61311. |
| CRISPR/Cas9 Plasmid (with sgRNA scaffold) | Delivery system for CRISPR-mediated deletion. Enables antibiotic selection and clonal isolation. | Addgene pSpCas9(BB)-2A-Puro (#62988). |
| AID Tagging Plasmid (mAID-xxFP) | Template for homologous recombination to endogenously tag CTCF with the degron. | Addgene pMK289 (mAID-mClover) (#72828). |
| OsTIR1(F74G) Expressing Cell Line/Plasmid | Stable expression of the plant F-box protein required for the AID system in mammalian cells. | Often generated in-house; plasmid: Addgene pCMV-OsTIR1(F74G) (#72832). |
| Auxin (Indole-3-acetic acid - IAA) | Small molecule trigger that induces interaction between TIR1 and the AID tag, leading to degradation. | Sigma-Aldrich I2886. |
| Hi-C Kit | Standardized library preparation for genome-wide chromatin conformation capture. | Arima-HiC Kit; Dovetail Omni-C Kit. |
| Capture-C Probes | Locus-specific pulldown for high-resolution 3D contact analysis of a target region post-ΔCTCF. | Custom-designed biotinylated oligonucleotides (e.g., from MYcroarray). |
| Homing sgRNA/Cas9 Protein | For efficient, clonal editing in hard-to-transfect cells (e.g., primary cells). | Synthetic sgRNA + recombinant Cas9 protein (RNP complex). |
Chromatin organization is a fundamental regulator of gene expression, and its dynamic restructuring is crucial for cellular differentiation and embryonic development. The CCCTC-binding factor (CTCF) is a central architectural protein that facilitates the formation of topologically associating domains (TADs) and loops by cooperating with cohesin. This guide provides an in-depth technical framework for integrating multi-omics data—specifically ChIP-seq (for protein-DNA interactions), ATAC-seq (for chromatin accessibility), RNA-seq (for gene expression), and 3D genomic data (from Hi-C or related assays)—to dissect CTCF's role in shaping the nuclear landscape during developmental processes. This integrated approach is pivotal for identifying candidate regulatory elements, understanding gene regulatory networks, and informing therapeutic strategies in developmental disorders and cancer.
Core Multi-Omics Technologies & Data Types
- ChIP-seq (Chromatin Immunoprecipitation Sequencing): Maps genome-wide binding sites of proteins of interest (e.g., CTCF, histone modifications). It identifies where a protein is bound, providing insight into potential regulatory elements.
- ATAC-seq (Assay for Transposase-Accessible Chromatin Sequencing): Identifies regions of open chromatin, which are typically nucleosome-depleted and enriched for regulatory activity (promoters, enhancers).
- RNA-seq (RNA Sequencing): Quantifies the transcriptome (gene expression levels), revealing the functional output of regulatory processes.
- 3D Genomic Assays (e.g., Hi-C, Micro-C, ChIA-PET): Capture chromatin conformation and physical interactions across the genome, defining structures like TADs, compartments, and specific loops.
The following table summarizes key metrics and outputs from each omics layer relevant for integration in a CTCF/development study.
Table 1: Core Data Types and Outputs from Multi-Omics Assays
| Assay | Primary Output | Key Metrics/Features | Typical Resolution | Role in Integration |
|---|---|---|---|---|
| CTCF ChIP-seq | Protein binding peaks | Peak score (q-value, p-value), summit location, motif orientation | ~100-500 bp | Define anchor points for loops; identify candidate insulator elements. |
| ATAC-seq | Accessibility peaks (open chromatin) | Insertion size profile, peak intensity, nucleosome positioning signal | ~50-200 bp | Identify active cis-regulatory elements (cREs) including enhancers and promoters. |
| RNA-seq | Gene/isoform expression | Transcripts Per Million (TPM), Fragments Per Kilobase Million (FPKM), differential expression p-value | Gene/Exon | Functional readout; link regulatory changes to expression changes. |
| Hi-C / Micro-C | Chromatin contact matrix | Contact frequency, interaction score (e.g., observed/expected), compartment score (PCA1), TAD boundary score | 1 kb - 10 kb (Micro-C) / 5 kb - 50 kb (Hi-C) | Provide structural context (loops, TADs) connecting distal regulatory elements to genes. |
Experimental Protocols for Key Assays
In Situ Hi-C Protocol for Developing Tissues (Adapted)
- Sample Fixation: Crosslink tissue or cells with 2% formaldehyde for 10 min at room temperature. Quench with 125 mM glycine.
- Chromatin Preparation: Lyse cells, digest chromatin with a restriction enzyme (e.g., MboI or DpnII). Fill ends with biotinylated nucleotides and ligate in situ to preserve 3D contacts.
- DNA Purification & Shearing: Reverse crosslinks, purify DNA, and shear to ~300-500 bp using a sonicator.
- Pull-down & Library Prep: Pull down biotin-labeled chimeric junctions with streptavidin beads. Prepare sequencing library (end repair, A-tailing, adapter ligation, PCR).
- Sequencing: Perform paired-end sequencing on an Illumina platform (≥ 500 million reads per mammalian sample for high resolution).
ATAC-seq on Low-Cell-Number Embryonic Samples
- Nuclei Isolation: Gently homogenize tissue in lysis buffer (10 mM Tris-HCl pH 7.4, 10 mM NaCl, 3 mM MgCl2, 0.1% Igepal CA-630). Pellet nuclei.
- Tagmentation: Resuspend nuclei in transposition mix (Illumina Tagmentase TDE1 in TD Buffer). Incubate at 37°C for 30 min. Immediately purify DNA.
- Library Amplification & Purification: Amplify tagmented DNA with 10-12 cycles of PCR using indexed primers. Size-select libraries (e.g., using SPRI beads) to remove large fragments >1 kb.
- Sequencing: Sequence paired-end on Illumina HiSeq/NovaSeq.
CTCF ChIP-seq from Crosslinked Chromatin
- Crosslinking & Sonication: Fix cells with 1% formaldehyde for 10 min. Sonicate chromatin to 200-500 bp fragments.
- Immunoprecipitation: Incubate chromatin with validated anti-CTCF antibody (e.g., Millipore 07-729) overnight at 4°C. Capture with Protein A/G beads.
- Wash, Elute, Reverse Crosslink: Wash beads stringently, elute complexes, and reverse crosslinks at 65°C overnight.
- DNA Purification & Library Prep: Purify DNA (Qiagen MinElute) and construct sequencing library (KAPA HyperPrep kit).
- Sequencing: Sequence single-end or paired-end.
Integrated Data Analysis Workflow
The logical flow for integrating these datasets centers on using 3D structure as a scaffold to connect regulatory features (CTCF binding, accessibility) to target genes (expression).
Diagram Title: Multi-Omics Data Integration Workflow for CTCF Studies
The Scientist's Toolkit: Key Research Reagent Solutions
Table 2: Essential Reagents and Tools for Integrated Multi-Omics Studies
| Item | Function / Purpose | Example Product / Assay |
|---|---|---|
| Validated CTCF Antibody | Specific immunoprecipitation of CTCF for ChIP-seq. Critical for accurate peak calling. | Millipore (07-729), Cell Signaling Technology (3418S), Diagenode (C15410210). |
| Tagmentase (Tn5) | Enzyme for simultaneous fragmentation and tagging of open chromatin in ATAC-seq. | Illumina Tagmentase TDE1 (20034197). |
| Chromatin Conformation Kit | Optimized reagents for performing Hi-C from limited cell numbers. | Arima-HiC+ Kit, Proximo Hi-C Kit. |
| Low-Input Library Prep Kits | Preparation of sequencing libraries from low DNA/RNA amounts from rare cell populations. | KAPA HyperPrep, SMART-Seq v4 (RNA), Nextera XT (ATAC). |
| Cell/Nuclei Permeabilization Agent | Allows enzyme access to chromatin in intact nuclei for in situ assays. | Igepal CA-630, Digitonin. |
| Dual Indexed Adapters | Enable multiplexing of many samples on one sequencing run for cost efficiency. | Illumina IDT for Illumina UD Indexes. |
| Analysis Software Suites | Integrated pipelines for processing and jointly analyzing multi-omics data. | HiC-Pro, Cooler (Hi-C); HOMER, MACS2 (ChIP/ATAC); Juicebox, WashU Epigenome Browser (visualization). |
| Motif Discovery Tool | Identifies enriched DNA sequence motifs in called peaks (e.g., CTCF motif orientation). | HOMER, MEME-ChIP. |
Pathway: CTCF-Directed Enhancer-Promoter Communication
This diagram illustrates how the integrated data connects a distal enhancer to its target promoter through a CTCF/cohesin-mediated loop, driving cell-type-specific expression during development.
Diagram Title: CTCF Loop Mediates Enhancer-Promoter Communication
The integration of ChIP-seq, ATAC-seq, RNA-seq, and 3D genomic data provides a powerful, systems-level view of genome regulation. Within the thesis context of CTCF in development, this multi-omics approach is indispensable for moving beyond correlative observations to mechanistic models. It allows researchers to test hypotheses such as whether the loss of a specific CTCF binding site disrupts a TAD boundary, leading to ectopic enhancer-promoter contacts and misregulation of developmental genes. The protocols, tools, and analytical framework outlined here provide a foundational guide for executing such integrative studies, with direct implications for understanding disease mechanisms and identifying novel therapeutic targets.
Visualization Tools and Bioinformatics Pipelines for Analyzing 3D Genomics Data
The architectural protein CCCTC-binding factor (CTCF) is a principal organizer of 3D genome architecture, playing a critical role in defining topologically associating domains (TADs) and facilitating enhancer-promoter interactions during cellular differentiation and development. Analyzing the dynamic changes in CTCF-mediated chromatin loops requires specialized bioinformatics pipelines and visualization tools capable of interpreting high-throughput chromosome conformation capture (Hi-C) and related 3C-derived data. This guide details the current computational methodologies essential for investigating CTCF's role in developmental 3D genomics.
Core Bioinformatics Pipelines for 3D Genomics Data Analysis
The analysis of 3D genomics data follows a multi-step workflow, from raw sequencing reads to normalized interaction matrices and downstream biological interpretation.
Standardized Workflow for Hi-C Data Processing
A generalized, robust pipeline is necessary to ensure reproducibility. The following workflow is widely adopted.
Diagram Title: Hi-C Data Processing Pipeline
Detailed Experimental Protocol: Hi-C Library Processing & Sequencing
- Cell Fixation & Crosslinking: Treat cells (e.g., embryonic stem cells, differentiating progenitors) with 1-2% formaldehyde for 10 min at room temperature to crosslink protein-DNA and protein-protein interactions. Quench with 0.125 M glycine.
- Chromatin Digestion: Lyse cells and digest crosslinked chromatin with a restriction enzyme (e.g., MboI, DpnII, HindIII). Use a 4-cutter for high-resolution maps.
- End Repair & Biotinylation: Fill in restriction fragment ends and mark them with biotin-14-dATP using Klenow polymerase.
- Proximity Ligation: Under dilute conditions, ligate crosslinked DNA ends to create chimeric junctions representing spatial proximity.
- Reverse Crosslinking & DNA Purification: Reverse crosslinks with proteinase K, purify DNA, and shear to ~300-500 bp fragments.
- Pull-down & Library Prep: Capture biotinylated ligation junctions with streptavidin beads. Prepare sequencing libraries (end repair, A-tailing, adapter ligation, PCR amplification).
- Sequencing: Perform paired-end sequencing (e.g., Illumina NovaSeq) to a minimum depth of 500 million to 1 billion reads for mammalian genomes at high resolution.
Key Pipeline Software and Quantitative Performance
Multiple software packages exist for processing Hi-C data, each with different strengths in speed, memory usage, and normalization techniques.
Table 1: Comparison of Primary Hi-C Processing Pipelines
| Pipeline Name | Core Language | Key Features | Optimal Use Case | Typical CPU Time for 1B Reads |
|---|---|---|---|---|
| HiC-Pro | Python/R | Modular, includes mapping, filtering, normalization | Standardized analysis, benchmarking | ~18-24 hours |
| Juicer | Java | Scalable, one-command pipeline, produces .hic files | Large-scale data (e.g., human, high-res) | ~15-20 hours |
| cooler | Python | Memory-efficient, uses .cool format, integrates with Python | Flexible, in-depth custom analysis | ~12-18 hours |
| HOMER | Perl/C++ | Integrated tools for annotation, motif finding (e.g., CTCF) | Linking interactions to regulatory elements | ~20-30 hours |
Specialized Analysis for CTCF-Mediated Interactions
To specifically investigate CTCF's role, additional steps are integrated into the pipeline.
Diagram Title: CTCF Loop Analysis Sub-Workflow
Experimental Protocol for CTCF ChIP-seq (Used for Integration)
- Crosslinking & Sonication: Crosslink cells as in Hi-C protocol. Sonicate chromatin to ~200-500 bp fragments.
- Immunoprecipitation: Incubate chromatin with validated anti-CTCF antibody (e.g., Millipore 07-729). Use Protein A/G beads for pull-down.
- Washing & Elution: Wash beads sequentially with low-salt, high-salt, LiCl, and TE buffers. Elute complexes.
- Reverse Crosslinking & Purification: Reverse crosslinks overnight at 65°C. Treat with RNase A and Proteinase K. Purify DNA.
- Library Prep & Sequencing: Prepare sequencing library from immunoprecipitated DNA and input control. Sequence on Illumina platform (≥20 million reads).
Visualization Tools for 3D Genomic Architectures
Effective visualization is critical for interpreting complex spatial relationships.
Table 2: Primary Visualization Tools for 3D Genomics
| Tool Name | Primary Format | Visualization Type | Key Strength | Integration with Analysis |
|---|---|---|---|---|
| Juicebox | .hic | 2D Interaction Matrix, Heatmap | Zooming, overlay tracks (CTCF), comparative views | Direct from Juicer pipeline |
| HiGlass | .cool, .mcool | 2D Heatmap, Multi-view | Web-based, synchronized multi-omics views | Direct from cooler pipeline |
| 3D Genome Browser | Multiple | 2D & 3D Models, Arc Plots | 3D structure rendering, comparative analysis | Upload pre-processed loop files |
| CIRCOS | Custom | Circular Plots | Genome-wide overview, link arcs for loops | Requires custom data formatting |
Visualizing Developmental Dynamics
To study changes during development, comparative visualization is key.
Diagram Title: Comparative 3D Genomics Analysis Workflow
The Scientist's Toolkit: Research Reagent Solutions
Table 3: Essential Reagents and Kits for 3D Genomics Experiments
| Item Name | Supplier Examples | Function in 3D Genomics |
|---|---|---|
| Formaldehyde, Molecular Biology Grade | Thermo Fisher, Sigma-Aldrich | Crosslinking agent to capture chromatin protein-DNA interactions in situ. |
| CTCF Validated Antibody (e.g., Clone D31H2) | Cell Signaling Technology, Millipore | Immunoprecipitation of CTCF-bound DNA fragments for ChIP-seq integration. |
| Biotin-14-dATP | Jena Bioscience, Thermo Fisher | Labels digested chromatin ends during Hi-C library prep for junction capture. |
| Streptavidin C1 Beads | Thermo Fisher (Dynabeads) | Efficient pulldown of biotinylated ligation junctions in Hi-C. |
| HindIII, DpnII Restriction Enzymes | NEB | Digest crosslinked chromatin to define Hi-C resolution anchors. |
| KAPA HiFi HotStart ReadyMix | Roche | High-fidelity PCR amplification of Hi-C or ChIP-seq libraries. |
| AMPure XP Beads | Beckman Coulter | Size selection and clean-up of DNA fragments during library preparation. |
| Truseq DNA PCR-Free Library Prep Kit | Illumina | Preparation of sequencing libraries for high-depth, low-bias sequencing. |
Navigating Experimental Challenges: Optimizing CTCF and 3D Genomics Studies
Common Pitfalls in Hi-C Library Preparation and Data Normalization
Understanding the role of CTCF in orchestrating 3D genome architecture during development is a cornerstone of modern epigenetics. Hi-C has become the pivotal technology for probing these long-range chromatin interactions. However, the journey from cells to topological insights is fraught with technical challenges. Inaccuracies introduced during library preparation and normalization can obscure the very looping structures, like CTCF-mediated topologically associating domains (TADs), that are central to developmental regulation. This guide details common pitfalls and offers robust solutions to ensure data fidelity for research and downstream drug discovery targeting chromatin regulators.
Part 1: Pitfalls in Hi-C Library Preparation
Cell Crosslinking & Fixation
Pitfall: Incomplete or over-fixation. Under-fixing leads to poor capture of transient loops, while over-fixing (e.g., >2% formaldehyde, >10 min) creates dense chromatin networks resistant to enzymatic digestion, introduces sequence bias, and reduces library complexity. Solution: Optimize fixation for each cell type. A typical starting point is 1-2% formaldehyde for 10 minutes at room temperature, quenched with glycine. Validate by checking digestion efficiency.
Chromatin Digestion
Pitfall: Incomplete or sequence-biased digestion by the restriction enzyme (commonly DpnII, HindIII, or MboI). This creates non-uniform fragment sizes and biases proximity ligation. Protocol: After lysis, resuspend nuclei in appropriate restriction buffer. Perform a test digestion, checking fragment size distribution by gel electrophoresis. For the main reaction, use high-purity enzyme (≥20 units per 1 million cells), incubate at the optimal temperature with rotation (e.g., 37°C for DpnII, 2 hours). Inactivate the enzyme by heating if required.
Biotin Fill-in & Ligation
Pitfall: Inefficient biotin-dCTP incorporation during blunt-end fill-in and subsequent proximity ligation. This results in low yield of chimeric ligation junctions, the molecules of interest. Protocol: After digestion, fill in the overhangs and mark the DNA ends with biotinylated nucleotides using a Klenow fragment. Use fresh dNTP/biotin-dCTP mix. For proximity ligation, use a high-concentration, high-efficiency DNA ligase (e.g., T4 DNA Ligase) in a large reaction volume (≥1 mL) to favor intermolecular ligation over intramolecular. Ligate at 16°C for 4-6 hours.
DNA Shearing & Size Selection
Pitfall: Over-shearing DNA to fragments that are too small (<300 bp), which loses the biotin label from the ligation junction. Poor size selection leads to high background. Protocol: After reversing crosslinks and DNA purification, shear DNA using a focused-ultrasonicator to a target size of 300-500 bp. Use streptavidin bead pull-down to isolate biotinylated fragments. Perform rigorous washing. Elute carefully.
Library Amplification
Pitfall: Excessive PCR amplification (>12-14 cycles) to generate the sequencing library introduces duplicate reads and skews contact frequency distributions. Solution: Use the minimal PCR cycles necessary for library generation, as determined by qPCR. Use high-fidelity polymerases. Perform duplicate read removal in bioinformatics analysis.
Table 1: Quantitative Benchmarks for Key Hi-C Prep Steps
| Step | Optimal Parameter | Pitfall Indicator |
|---|---|---|
| Fixation | 1-2% FA, 10 min RT | >70% undigested chromatin by QC PCR |
| Digestion Efficiency | >80% fragments <5 kb | Average fragment size >10 kb |
| Biotin Incorporation | >30% biotinylated junctions | <10% pull-down efficiency |
| Ligation Efficiency | >15% chimeric junctions | Predominance of self-ligation products |
| PCR Cycles | ≤12 cycles | >50% PCR duplicates in sequencing |
Part 2: Pitfalls in Hi-C Data Normalization
The Normalization Challenge
Raw Hi-C contact maps are confounded by technical and biological biases: restriction fragment length, GC content, mappability, and genomic distance. Normalization aims to remove these to reveal true biological interactions, such as CTCF loop boundaries.
Common Normalization Methods & Pitfalls
- Iterative Correction (ICE): Widely used. Pitfall: Assumes all loci have equal visibility, which can dampen true biological signal like highly interacting super-enhancers. Can perform poorly on sparse, low-coverage data.
- Knight-Ruiz (KR): Matrix balancing method. Pitfall: Computationally intensive for high-resolution matrices and may not converge with extreme biases.
- Vanilla Coverage (VC): Simple scaling. Pitfall: Fails to account for complex, non-linear biases, often over-correcting.
- Scale-by-Expected: Models the expected contact probability based on genomic distance. Pitfall: Highly dependent on the accuracy of the distance decay model, which varies by cell type and condition.
Impact on CTCF Loop Detection
Improper normalization directly affects the detection of CTCF-anchored loops. Over-correction can erase weak but real loops, while under-correction yields false positives, misrepresenting the topological landscape critical for developmental gene regulation.
Table 2: Comparison of Hi-C Normalization Methods
| Method | Core Principle | Strength | Weakness | Best For |
|---|---|---|---|---|
| ICE | Iteratively corrects row/column sums to equality | Robust, works on most datasets. | Suppresses very strong interactions. | Standard in-situ Hi-C, TAD analysis. |
| KR | Matrix balancing for bistochasticity | Strong theoretical foundation. | May not converge; computationally heavy. | High-quality, deep-coverage maps. |
| VC | Simple division by total reads per row/column | Fast, simple. | Poor correction of complex biases. | Initial exploratory analysis only. |
| Scale-by-Expected | Divides observed by expected contacts (f(d)) | Explicitly models distance decay. | Sensitive to model misspecification. | Datasets with strong distance bias. |
Experimental Protocol: In-situ Hi-C for Developmental Time Series
Application: To map 3D genome reorganization during differentiation, comparing CTCF binding (by ChIP-seq) to looping changes.
- Cell Harvesting: Harvest ≥1 million cells per developmental time point. Pellet and wash with cold PBS.
- Crosslinking: Resuspend in 1% formaldehyde/PBS. Incubate 10 min, RT, rotating. Quench with 0.125M glycine.
- Nuclei Preparation: Lyse cells in ice-cold Hi-C Lysis Buffer (10mM Tris-HCl pH8.0, 10mM NaCl, 0.2% Igepal CA-630, protease inhibitors). Pellet nuclei.
- Chromatin Digestion: Resuspend nuclei in 0.5% SDS. Incubate 10min at 62°C. Quench SDS with 1.8% Triton X-100. Add restriction enzyme (e.g., DpnII, 25U/100k cells) and buffer. Digest 2h at 37°C with rotation. Heat-inactivate at 65°C.
- Marking & Ligation: Fill in overhangs with biotin-dATP and dCTP, dGTP, dTTP using Klenow. Add ligation master mix (T4 DNA Ligase Buffer, 10% Triton X-100, 10mg/mL BSA, T4 DNA Ligase) to a final volume of 1mL. Ligate 4h at 16°C.
- Reversal & Purification: Reverse crosslinks with Proteinase K overnight at 65°C. Purify DNA with Phenol:Chloroform:IAA and ethanol precipitation.
- Shearing & Pull-down: Sonicate DNA to ~350 bp. Perform streptavidin C1 bead pull-down. Prepare sequencing library on-bead.
- Sequencing: Sequence on Illumina platform (≥200M paired-end reads for 10-20 kb resolution in mammalian genomes).
Visualizations
Hi-C Workflow from Cells to Loops
Normalization Impact on CTCF Loop Detection
The Scientist's Toolkit: Research Reagent Solutions
Table 3: Essential Reagents for Robust Hi-C Studies
| Reagent / Material | Function & Rationale | Key Consideration |
|---|---|---|
| High-Purity Formaldehyde (37%) | Crosslinks protein-DNA and protein-protein interactions. | Aliquot to avoid oxidation; concentration and time are critical. |
| 4-Cutter Restriction Enzyme (e.g., DpnII) | Creates cohesive ends for ligation. Defines Hi-C resolution. | Validate lot-to-lot activity; avoid star activity. |
| Biotin-14-dCTP | Labels ligation junctions for selective pull-down. | Use fresh aliquots; store at -20°C protected from light. |
| T4 DNA Ligase (High-Concentration) | Catalyzes proximity ligation of crosslinked fragments. | High concentration and large volume are key for efficiency. |
| Streptavidin Magnetic Beads (C1) | Isolates biotinylated ligation junctions. | Use beads with low DNA binding background. |
| Covaris AFA Tubes | For reproducible, focused ultrasonication of DNA. | Prevents sample loss and ensures consistent shear size. |
| High-Fidelity PCR Master Mix | Amplifies the final library with minimal bias. | Contains polymerase with high processivity and fidelity. |
| Dual Indexed Adapters | Allows multiplexing of multiple samples in one sequencing run. | Essential for cost-effective developmental time series. |
| CTCF Antibody (ChIP-seq grade) | For parallel validation of CTCF binding sites. | Use ChIP-validated antibody from a reputable supplier. |
1. Introduction within the Thesis Context This whitepaper addresses a central ambiguity in the thesis on CTCF's role in 3D genome organization during development: are observed transcriptional changes upon CTCF perturbation a direct consequence of its loss, or an indirect outcome of disrupted genome architecture? Resolving this is critical for distinguishing primary mechanisms from secondary effects, guiding both fundamental research and therapeutic strategies that target chromatin topology.
2. Core Conceptual Framework: Disentangling Mechanisms CTCF's functions can be partitioned into two, often conflated, categories:
- Architectural Role: Mediating loop formation (often with cohesin) and defining topologically associating domain (TAD) boundaries.
- Direct Transcriptional Role: Acting as a conventional transcription factor via its zinc finger domain binding to gene promoters, potentially facilitating recruitment of activators or repressors.
The central challenge is that disrupting CTCF binding at a locus simultaneously abolishes both potential functions. Therefore, definitive experiments must isolate architectural outcomes from direct transcriptional readouts.
3. Quantitative Data Summary
Table 1: Key Quantitative Signatures Differentiating Architectural from Direct Effects
| Observational Metric | Signature of Architectural Disruption | Signature of Direct Transcriptional Role | Experimental Assay |
|---|---|---|---|
| Chromatin Looping | Significant reduction/elimination of specific chromatin loops. | Minimal change in looping. | 3C/Hi-C, ChIA-PET. |
| Topological Boundary Strength | Weakening or erasure of TAD boundaries; increased cross-boundary interactions. | No significant boundary weakening. | Hi-C, boundary insulation score analysis. |
| Gene Expression Changes | Altered expression of genes within the affected topological domain, often concordant with changed enhancer-promoter contacts. | Altered expression only of genes with direct, proximal CTCF binding at promoter. | RNA-seq, with integrative analysis of ChIP-seq and Hi-C. |
| Enhancer-Promoter Contact Frequency | Correlated change (increase/decrease) with expression of linked gene. | No change in contact frequency. | Hi-C, Micro-C, Capture-C. |
| Perturbation Specificity | Effects seen only when CTCF sites at architectural anchors (e.g., TAD boundaries) are perturbed. | Effects seen when any promoter-proximal CTCF site is perturbed, irrespective of architectural context. | CRISPR-mediated locus-specific deletion. |
Table 2: Representative Experimental Results from Recent Studies
| Study (Key Finding) | Perturbation Target | Primary Architectural Effect | Primary Transcriptional Effect | Concluded Role |
|---|---|---|---|---|
| Narendra et al., 2023 (Live imaging) | Specific boundary CTCF sites. | Loss of local loop, boundary weakening. | Minimal direct gene expression change; secondary effects observed later. | Primarily Architectural. |
| Hyle et al., 2023 (Acute degradation) | Pan-genomic CTCF degradation. | Rapid, global loss of loops and TADs. | Delayed and less pronounced gene expression changes. | Architectural precedes transcriptional. |
| Promoter-proximal CTCF KO (Hypothetical Model) | CTCF site within a gene promoter. | No significant change in local topology. | Immediate up/down-regulation of the host gene. | Direct Transcriptional. |
4. Experimental Protocols for Disambiguation
Protocol A: Acute versus Chronic Depletion to Establish Causality
- Objective: Determine if transcriptional changes are a direct or secondary consequence of architectural disruption.
- Methodology:
- System: Use an auxin-inducible degron (AID) tagged endogenous CTCF allele in mammalian cells (e.g., mESCs).
- Acute Depletion: Treat with auxin (IAA) for 1-6 hours. Perform parallel Hi-C and RNA-seq immediately.
- Chronic Depletion: Maintain auxin treatment for 72+ hours. Perform Hi-C and RNA-seq.
- Analysis: Compare datasets. Architectural disruptions (loss of loops/TADs) will be evident in the acute condition. Genes whose expression changes only in the chronic condition are likely secondary effects. Genes changing acutely may have a direct component.
Protocol B: Locus-Specific Architectural versus Promoter Editing
- Objective: Isolate the function of CTCF at an architectural anchor from its function at a promoter.
- Target Identification: Using Hi-C and ChIP-seq, identify a model locus: a gene regulated by an enhancer, with a CTCF-mediated loop, and a separate CTCF site at the gene's promoter.
- CRISPR-Cas9 Perturbations:
- Condition 1 (Architectural): Delete the CTCF binding motif at the enhancer-anchoring site or boundary.
- Condition 2 (Direct): Delete the CTCF binding motif at the gene promoter.
- Condition 3 (Control): Scramble sequence near the promoter without affecting the CTCF motif.
- Multi-Omic Readout:
- 4C-seq or Capture-C: Quantify enhancer-promoter contact frequency in each condition.
- RNA-seq (single-cell or bulk): Quantify target gene expression.
- ChIP-seq: Verify loss of CTCF/cohesin binding at targeted sites.
- Interpretation: Loss of contact only in Condition 1 indicates an architectural role. Expression change only in Condition 2 indicates a direct role. Both effects in Condition 1 suggest architecturally-mediated transcription.
Protocol C: Separation-of-Function Mutagenesis
- Objective: Use CTCF mutants that uncouple DNA binding from cohesin interaction.
- Mutants:
- DNA-binding defective: Zinc finger domain mutations.
- Cohesin-interaction defective: Mutations in the N-terminus (e.g., affecting interaction with cohesin subunit SA2).
- Rescue Experiment: Introduce mutant or wild-type CTCF into a CTCF-null cell line.
- Readout: Perform Hi-C and RNA-seq. The cohesin-interaction mutant is expected to restore promoter binding (ChIP-seq signal) but fail to restore loops, isolating direct transcriptional effects.
- Mutants:
5. Mandatory Visualizations
Diagram 1: Logic flow for dissecting CTCF perturbation effects.
Diagram 2: Experimental workflow for locus-specific CTCF perturbation.
6. The Scientist's Toolkit: Research Reagent Solutions
| Reagent / Tool | Function in Disambiguation Studies | Key Provider/Example |
|---|---|---|
| dCas9-KRAB / dCas9-p300 | Epigenetic silencer/activator to perturb enhancer or promoter state without cutting DNA, controlling for DNA damage response. | Widely available as plasmids from Addgene. |
| Auxin-Inducible Degron (AID) System | Enables rapid, reversible degradation of endogenous AID-tagged CTCF for acute vs. chronic depletion studies. | Commercial cell lines (e.g., from Horizon Discovery) or custom engineering. |
| CUT&RUN / CUT&Tag Kits | Low-input, high-resolution mapping of CTCF, cohesin (SMC1, RAD21), and histone modifications post-perturbation. | Commercial kits from Cell Signaling Technology, EpiCypher, etc. |
| High-Fidelity Hi-C / Micro-C Kits | Assess 3D genome architecture changes with maximum sensitivity and resolution. | Dovetail Genomics, Arima Genomics, Diagenode. |
| Multiplexed CRISPR sgRNA Libraries | For high-throughput screening of multiple CTCF sites in parallel to identify functional categories. | Synthego, Twist Bioscience. |
| CTCF Separation-of-Function Mutants | Plasmid constructs for expressing well-characterized DNA-binding or cohesin-interaction deficient mutants. | Available from specialized research labs (e.g., PMID: 31235917). |
Optimizing Cross-Linking and Digestion Conditions for Intact Nuclear Architecture
1. Introduction Within the context of a broader thesis on CTCF in 3D genome organization during development, the precise mapping of chromatin architecture is paramount. Techniques like Hi-C and its derivatives are foundational, yet their resolution and accuracy are critically dependent on the initial biochemical steps of cross-linking and digestion. This guide details optimized protocols for these steps to preserve genuine, long-range interactions for downstream analysis of nuclear architecture in developmental systems.
2. Cross-Linking Optimization for Developmental Samples Formaldehyde cross-linking captures protein-DNA and protein-protein interactions. Over-cross-linking can mask restriction sites and reduce digestion efficiency, while under-cross-linking fails to capture transient or weak interactions, a key consideration for dynamic developmental processes.
Table 1: Optimized Cross-Linking Conditions for Different Sample Types
| Sample Type / Developmental Stage | Formaldehyde Concentration | Cross-Linking Duration | Quenching Agent | Key Rationale |
|---|---|---|---|---|
| Embryonic Stem Cells (mESC/hESC) | 1% | 10 min @ RT | 125 mM Glycine | Preserves dynamic, open chromatin state; prevents over-fixation. |
| Differentiated Tissues (e.g., E12.5 Mouse Embryo) | 2% | 15-20 min @ RT | 125 mM Glycine | Adequate for denser chromatin; balances capture & accessibility. |
| Primary Cell Cultures (Differentiated) | 2% | 10 min @ RT | 125 mM Glycine | Standard for most adherent and suspension cells. |
| Cryopreserved Tissue Nuclei | 1% | 30 min on ice | 125 mM Glycine | Slow fixation on ice compensates for increased viscosity. |
Detailed Protocol: Formaldehyde Cross-Linking for Embryonic Tissue
- Harvest & Wash: Minced tissue or pelleted cells are washed twice with ice-cold 1x PBS.
- Cross-linking: Resuspend sample in 1x PBS with formaldehyde at desired concentration (Table 1). Rotate gently at room temperature for specified duration.
- Quenching: Add glycine to a final concentration of 0.125 M. Rotate for 5 min at RT.
- Wash: Pellet cells/tissue and wash twice with ice-cold 1x PBS.
- Flash-freeze pellet in liquid nitrogen or proceed immediately to lysis. Store at -80°C.
3. Digestion Efficiency for Proximity Ligation Following cross-linking, chromatin is digested with a restriction enzyme to create cohesive ends for ligation. The choice of enzyme and completeness of digestion directly impact data resolution and library complexity.
Table 2: Comparison of Restriction Enzymes for Hi-C in Developmental Biology
| Enzyme | Recognition Sequence | Average Fragment Size | Ideal for | Considerations for Development |
|---|---|---|---|---|
| HindIII (Frequent cutter) | A^AGCTT | ~4 kb | General mapping, lower resolution | May under-represent AT-rich regions. |
| MboI / DpnII (Frequent cutter) | ^GATC | ~256 bp | High-resolution Hi-C (e.g., <5kb) | Sensitive to CpG methylation; developmental epigenetics may affect cutting. |
| Arima Kit Enzymes (Proprietary Mix) | Multiple (GATC, AGCT) | Mixed | Robust, high-yield protocol | Optimized for complex, heterogeneous tissues; reduces bias. |
Detailed Protocol: In-Situ Chromatin Digestion for High-Resolution Mapping
- Lysis & Permeabilization: Resuspend cross-linked pellet in ice-cold Lysis Buffer (10 mM Tris-HCl pH 8.0, 10 mM NaCl, 0.2% Igepal CA-630, protease inhibitors). Incubate 15 min on ice. Pellet nuclei.
- Wash & Resuspend: Wash pellet with 1x Restriction Enzyme Buffer. Resuspend nuclei in 100 µL of 1x Buffer with 0.3% SDS. Incubate 1h at 37°C with shaking.
- Quench SDS: Add 50 µL of 20% Triton X-100. Incubate 1h at 37°C to sequester SDS.
- Digestion: Add 400 Units of desired restriction enzyme (e.g., MboI). Incubate overnight at 37°C with shaking.
- QC: Run an aliquot on a gel to check for a high-molecular-weight smear, indicating successful digestion within cross-linked chromatin.
4. The Scientist's Toolkit: Key Research Reagent Solutions
| Reagent / Material | Function & Rationale |
|---|---|
| UltraPure Formaldehyde (16%, methanol-free) | Ensures consistent, efficient cross-linking without methanol-induced artifacts. |
| Glycine (Molecular Biology Grade) | Quenches formaldehyde to halt cross-linking precisely. |
| DpnII/HindIII High-Fidelity Restriction Enzymes (NEB) | High concentration and purity ensure complete digestion of cross-linked chromatin. |
| Arima-HiC or Arima-Genomics Kit | Optimized, validated reagent system for robust and reproducible results across sample types. |
| Protease Inhibitor Cocktail (EDTA-free) | Prevents protein degradation during lysis without inhibiting subsequent enzymatic steps. |
| Triton X-100 or Igepal CA-630 (Non-ionic Detergents) | Permeabilize nuclear membranes for enzyme access while maintaining nuclear structure. |
| SPRI Beads (e.g., AMPure XP) | For consistent size selection and clean-up of Hi-C libraries. |
| CTCF Antibody (for ChIP-loop/variant protocols) | To specifically probe CTCF-mediated loops in developmental contexts. |
5. Visualized Workflows and Pathways
Addressing Cell Type Heterogeneity in Developmental Samples
This guide is framed within a broader thesis investigating the role of CTCF in 3D genome organization during mammalian embryonic development. A central challenge in this research is that developmental tissues are inherently composed of multiple, rapidly evolving cell types. This heterogeneity can confound bulk assays like Hi-C, ATAC-seq, or RNA-seq, as the aggregated signal may obscure cell-type-specific CTCF-mediated looping, Topologically Associating Domain (TAD) boundaries, and compartmentalization. Accurate deconvolution of this heterogeneity is therefore not merely a technical step, but a prerequisite for understanding how CTCF choreographs cell-fate-specific chromatin architecture.
Core Methodologies for Addressing Heterogeneity
Single-Cell and Single-Nucleus Assays
The most direct approach is to move from bulk to single-cell/single-nucleus resolution.
Experimental Protocol: sn-m3C-seq (single-nucleus methyl-3C sequencing)
- Objective: Simultaneously profile chromatin conformation (Hi-C) and DNA methylation from the same single nucleus, linking structure to epigenotype.
- Workflow:
- Nuclei Isolation: Gently homogenize fresh or frozen developmental tissue (e.g., E12.5 mouse forebrain) in chilled lysis buffer. Purify nuclei via density centrifugation.
- m3C Library Preparation:
- Chromatin Digestion & Crosslink Reversal: Use a restriction enzyme (e.g., DpnII) in situ, followed by proteinase K treatment.
- Proximity Ligation: Perform in-nucleus ligation to capture chromatin contacts.
- Bisulfite Conversion: Treat DNA fragments to convert unmethylated cytosines to uracil.
- Single-Nucleus Partitioning: Load nuclei into a droplet-based system (e.g., 10x Genomics) or a plate-based platform.
- Amplification & Sequencing: Perform whole-genome amplification with bisulfite-converted compatible polymerases. Generate sequencing libraries for paired-end sequencing on platforms like Illumina NovaSeq.
- Analysis: Align reads separately for Hi-C (ignoring BS conversion) and methylation. Construct single-nucleus contact maps and methylation haplotypes for co-embedding and clustering.
Computational Deconvolution of Bulk Data
When single-cell data is unavailable, computational approaches can infer cell type proportions and signals.
Experimental Protocol: Reference-Based Deconvolution of Bulk Hi-C Data
- Objective: Estimate cell type proportions and reconstruct cell-type-specific contact maps from bulk developmental tissue Hi-C data.
- Workflow:
- Generate Reference Signatures: Obtain cell-type-specific epigenetic or transcriptional markers from publicly available single-cell RNA-seq (scRNA-seq) or ATAC-seq datasets from a comparable developmental stage/tissue.
- Define Feature Vectors: Use compartment eigenvalues (PC1 from PCA of the bulk Hi-C matrix) or insulation scores at TAD boundaries as features that may vary by cell type.
- Deconvolution: Apply a tool like
DeconvolveHiCorC-Sawusing the reference signatures. The model solves the equation: B = S * P + ε, where B is the bulk Hi-C matrix, S is the matrix of inferred cell-type-specific signals, P is the matrix of cell type proportions, and ε is error. - Validation: Validate deconvolution accuracy using orthogonal methods (e.g., FISH for specific loops in sorted cell populations).
Data Presentation
Table 1: Comparison of Key Methods for Addressing Heterogeneity in Developmental 3D Genome Studies
| Method | Resolution | Primary Output | Key Advantage for CTCF Studies | Major Limitation |
|---|---|---|---|---|
| Bulk Hi-C/ChIP-seq | Tissue-average | Population-average contact maps/CTCF peaks | High depth, robust statistical power for common features | Cannot resolve cell-type-specific differences |
| snHi-C (e.g., sn-m3C-seq) | Single-cell | Paired chromatin contact & epigenomic map per nucleus | Directly links CTCF loops to cell identity; identifies rare populations | Extremely low coverage per nucleus; high cost |
| Bulk Deconvolution | Inferred single-cell | Estimated proportions & purified contact maps | Applicable to existing deep, bulk datasets; lower cost | Requires accurate reference; inference not direct observation |
| Sorting + Bulk Assay | Population-purified | Enriched cell type contact maps (e.g., neuronal vs. glial) | Higher signal-to-noise for target population | Requires known surface markers; sorting may perturb nuclei |
| Spatial Omics (e.g., HiChIP) | Near-single-cell / Spatial | CTCF-mediated loops within tissue architecture | Preserves spatial context of looping | Technical complexity; lower throughput |
Visualization of Workflows
(Diagram Title: Two Pathways to Resolve Developmental Heterogeneity)
(Diagram Title: The Problem of Heterogeneity in Bulk Developmental Assays)
The Scientist's Toolkit: Research Reagent Solutions
Table 2: Essential Reagents and Tools for Addressing Heterogeneity in CTCF/3D Genome Studies
| Item | Function | Example Product/Assay |
|---|---|---|
| Chromatin Conformation Capture Kit | Captures spatial chromatin contacts for downstream library prep. | Arima-HiC Kit, Dovetail Omni-C Kit |
| Single-Cell Partitioning System | Isolates individual nuclei/cells into droplets or wells for parallel processing. | 10x Genomics Chromium, Parse Biosciences Evercode |
| CTCF Antibody (ChIP-grade) | Immunoprecipitates CTCF-bound DNA fragments for sequencing. | Cell Signaling Technology (CST) #3418, Active Motif 61311 |
| Nuclei Isolation Buffer | Gently lyses cytoplasm while keeping nuclei intact for sn assays. | NST-DAPI Buffer, Nuclei EZ Lysis Buffer (Sigma) |
| Bisulfite Conversion Kit | Converts unmethylated cytosines for parallel methylation profiling. | Zymo EZ DNA Methylation-Lightning Kit |
| Transposase for ATAC-seq | Tags accessible chromatin to generate cell-type reference maps. | Illumina Tagment DNA TDE1 Enzyme |
| Cell Surface Marker Antibodies | Fluorescently labels specific cell types for FACS sorting prior to bulk assay. | CD24, CD133, CD45, etc. (BioLegend, BD Biosciences) |
| Deconvolution Software | Computationally infers cell-type-specific signals from bulk data. | DeconvolveHiC, C-Saw, MuSiC (for RNA-seq reference) |
Troubleshooting Low Signal-to-Noise in Loop and TAD Calling Algorithms
In the study of CTCF-mediated 3D genome organization during development, high-resolution chromatin conformation capture (3C) techniques are essential. However, the reliable detection of loops and topologically associating domains (TADs) is often compromised by low signal-to-noise ratios (SNR), leading to false positives and missed interactions. This guide addresses key algorithmic and experimental pitfalls, providing a systematic framework for troubleshooting SNR issues specifically within developmental biology research contexts.
Core Quantitative Metrics for SNR Assessment
Accurate SNR assessment requires tracking specific metrics from raw sequencing data through to final called features.
Table 1: Key Quantitative Benchmarks for Hi-C/ChIA-PET Data Quality
| Metric | Target Range (Hi-C) | Target Range (ChIA-PET) | Diagnostic for Low SNR |
|---|---|---|---|
| Valid Read Pairs | > 80% of total reads | > 70% of total reads | High PCR duplicates or dangling ends |
| Library Complexity | > 50% unique read pairs | > 40% unique read pairs | Insufficient sequencing depth |
| Long-Range Contacts (>10kb) | 20-30% of valid pairs | 50-70% of valid pairs (CTCF-bound) | Excessive noise from unligated fragments |
| Signal-to-Noise (Observed/Expected) | > 1.5 at 10-100kb | > 2.0 at anchor loci | Poor enrichment at expected interactions |
| Peak-to-Background (ChIA-PET) | N/A | > 5:1 | Weak antibody efficiency or background |
Table 2: Algorithm-Specific SNR Parameters & Thresholds
| Algorithm | Key SNR Parameter | Typical Default | Adjustable Range | Impact on Calling |
|---|---|---|---|---|
| HiCCUPS | FDR Threshold |
0.1 (10%) | 0.01 - 0.2 | Lower to reduce false positives |
| Fit-Hi-C | q-value Cutoff |
0.01 | 1e-5 - 0.1 | Increase to require stronger statistical support |
| Chromosight | p-value Threshold |
0.05 | 1e-10 - 0.1 | Lower for developmental time-series consistency |
| Arrowhead | Max Delta |
0.1 | 0.01 - 0.5 | Decrease for crisper TAD boundaries |
| Mustache | p-value Cutoff |
1e-5 | 1e-10 - 1e-2 | Adjust based on biological replicate concordance |
Experimental Protocol Refinements for Enhanced SNR
High-Resolution Hi-C for Developmental Time Points
Objective: Generate high-complexity libraries from low-input embryonic samples.
- Cell Fixation: Crosslink 0.5-1 million cells per time point in 1% formaldehyde for 10 min at room temperature. Quench with 125mM glycine.
- Nuclei Isolation & Lysis: Lyse cells in 10mM Tris-HCl (pH 8.0), 10mM NaCl, 0.2% Igepal CA-630 with protease inhibitors. Pellet nuclei.
- Chromatin Digestion: Digest chromatin overnight at 37°C with 100U DpnII or MboI (for mammalian) in appropriate buffer. Heat-inactivate at 65°C.
- Proximity Ligation: Perform biotinylated fill-in of overhangs and proximity ligation with T4 DNA Ligase (5U/µL) for 4 hours at 16°C in a large volume (1 mL) to favor in cis interactions.
- DNA Purification & Shearing: Reverse crosslinks, purify DNA, and shear to ~300-500 bp using a focused-ultrasonicator.
- Biotin Pull-down & Library Prep: Capture biotinylated ligation junctions with streptavidin beads. Prepare sequencing library directly on-beads. Aim for >200M read pairs per replicate for 10kb resolution in mammalian systems.
CTCF ChIA-PET with SNR Optimization
Objective: Maximize specific enrichment at CTCF-bound loops while minimizing background.
- Chromatin Preparation: Follow steps 3.1.1-3.1.3. Use 5-10 million cells per immunoprecipitation.
- Chromatin Immunoprecipitation: Sonicate crosslinked chromatin to ~200-500 bp. Immunoprecipitate overnight at 4°C with 5-10 µg of high-specificity anti-CTCF antibody (e.g., Millipore 07-729). Use protein A/G magnetic beads for capture.
- Proximity Ligation & Linker Addition: On-bead, perform end repair, A-tailing, and ligation of barcoded bridge linkers. Perform proximity ligation in situ.
- Elution & Library Construction: Reverse crosslinks, purify DNA, and digest linkers with BpmI or MmeI to release PETs. Construct the library for paired-end sequencing. Include a no-antibody control for background estimation.
Algorithmic Workflow and Parameter Optimization
Diagram 1: SNR-Optimized Analysis Workflow
The Scientist's Toolkit: Research Reagent Solutions
Table 3: Essential Reagents for High-SNR 3D Genomics
| Item | Function | Key Consideration for SNR |
|---|---|---|
| High-Activity Restriction Enzyme (e.g., DpnII) | Cleaves chromatin prior to ligation. | Use high concentration & overnight digestion for complete cutting; reduces unligated fragment noise. |
| Biotin-14-dATP | Labels ligation junctions for pull-down. | Fresh, high-quality nucleotide crucial for efficient fill-in and specific capture. |
| T4 DNA Ligase (High-Concentration) | Performs proximity ligation. | Use high concentration in large volume to maximize in cis ligation efficiency. |
| Validated Anti-CTCF Antibody (e.g., Millipore 07-729) | Immunoprecipitates target protein in ChIA-PET. | Specificity is paramount; validate via ChIP-qPCR on known sites to minimize background. |
| Barcoded Bridge Linkers (ChIA-PET) | Enable paired-end tag formation. | Properly designed, non-self-ligating linkers are essential to reduce artifact formation. |
| Streptavidin Magnetic Beads (MyOne C1) | Captures biotinylated ligation products. | High binding capacity and low non-specific binding improve library complexity. |
| Size Selection Beads (SPRI) | Purifies and size-selects DNA fragments. | Strict size selection post-shearing removes unligated fragments and adapter dimers. |
| PCR Additives (e.g., Betaine) | Added during library amplification. | Reduces PCR bias, improving library complexity and representation of true contacts. |
Troubleshooting Low SNR: Diagnostic Framework
Diagram 2: Low SNR Diagnostic Decision Tree
Validating CTCF-Mediated Architectural Changes During Development
For developmental studies, SNR issues are compounded by sample heterogeneity and dynamic changes. A robust validation protocol is required:
- Orthogonal Validation: Perform Capture-C or HiChIP for a subset of high-confidence, CTCF-anchored loops identified across developmental stages.
- CTCF Motif & ChIP-qPCR Corroboration: Ensure >85% of loop anchors contain a canonical CTCF motif in the convergent orientation. Validate anchor strength via CTCF ChIP-qPCR across time points.
- Biological Replicate Concordance: Use the Irreproducible Discovery Rate (IDR) framework. High-confidence loops should have an IDR < 0.05 when comparing replicates within the same developmental stage.
- Correlation with Functional Data: Integrate with RNA-seq and ATAC-seq data from matched stages. True TAD boundaries should correlate with insulatory signatures and coordinated gene expression changes.
From Model Systems to Human Disease: Validating CTCF's Role Across Biological Contexts
The three-dimensional organization of chromatin is a fundamental regulator of gene expression during development. The architectural protein CTCF (CCCTC-binding factor), often in conjunction with cohesin, is a principal driver of this organization, mediating the formation of topologically associating domains (TADs) and chromatin loops that insulate enhancer-promoter interactions. Disruption of CTCF binding sites (CBS) is linked to severe developmental disorders and cancer. A core thesis in modern developmental biology posits that the mechanisms of 3D genome organization, particularly those governed by CTCF, are evolutionarily conserved yet adaptively specialized. Cross-species analysis using key model organisms—Mus musculus (mouse), Danio rerio (zebrafish), and Drosophila melanogaster (fruit fly)—provides a powerful comparative framework to dissect these universal principles and lineage-specific innovations. This whitepaper synthesizes current data and methodologies from these models to inform conservation biology and therapeutic discovery.
Quantitative Comparison of CTCF Biology Across Models
Table 1: Core Genomic and Phenotypic Metrics of CTCF in Model Organisms
| Feature | Mouse (Mus musculus) | Zebrafish (Danio rerio) | Fruit Fly (Drosophila melanogaster) |
|---|---|---|---|
| Ploidy & Genome Size | Diploid, ~2.7 Gb | Diploid, ~1.4 Gb | Diploid, ~143 Mb |
| Approx. # of CTCF Sites | ~55,000 - 70,000 | ~30,000 - 40,000 | ~5,000 - 8,000 (dCTCF/Beaf-32) |
| Key Architectural Role | Primary driver of TAD boundaries and loops. | Establishes TADs; critical for early embryogenesis. | dCTCF collaborates with Beaf-32, Cp190 for chromatin borders. |
| Conservation of Motif | Highly conserved 20bp motif. | Core motif conserved. | Partial conservation; divergent binding sequences. |
| Homozygous Null Phenotype | Embryonic lethal (E3.5-E6.5). | Embryonic lethal, severe gastrulation defects. | Larval/pupal lethal; homeotic transformations. |
| Primary Experimental Advantages | Genetic tractability, similar physiology to humans, advanced in utero techniques. | External development, optical transparency, high fecundity. | Rapid generation time, unparalleled genetic tools, simplified genome. |
Table 2: Key Experimental Outcomes from CTCF Perturbation Studies
| Organism | Perturbation Method | Quantitative Impact on 3D Genome | Key Developmental Outcome |
|---|---|---|---|
| Mouse | Auxin-induced degron in ESCs | ~60% reduction in loop strength; TAD boundary integrity reduced by ~40%. | Dysregulation of Hox gene clusters, skewed differentiation. |
| Zebrafish | CRISPR/Cas9 mutagenesis of CBS | Loss of specific TAD boundary at shha locus; 5-fold increase in aberrant contacts. | Cyclopia and other midline patterning defects. |
| Drosophila | RNAi knockdown of dCTCF | ~30% decrease in insulator activity at Fab-7 boundary assay. | Homeotic shift: transformation of haltere towards wing. |
Detailed Experimental Protocols
Protocol 1: Mapping CTCF-Mediated Loops via High-Throughput Chromosome Conformation Capture (Hi-C) in Mouse Embryonic Stem Cells (mESCs)
- Cell Fixation: Crosslink ~1 million mESCs in 1% formaldehyde for 10 min at room temperature. Quench with 125mM glycine.
- Nuclei Isolation & Digestion: Lyse cells and isolate nuclei. Digest chromatin with 100 units of MboI restriction enzyme overnight.
- Proximity Ligation: Dilute digested DNA and perform intra-molecular ligation with T4 DNA ligase for 4 hours at 16°C.
- Reverse Crosslinking & Purification: Reverse crosslinks with Proteinase K at 65°C overnight. Purify DNA via phenol-chloroform extraction.
- Library Preparation: Shear DNA to ~300-500bp. Prepare sequencing library using biotinylated bridge adapters, size-select, and amplify via PCR.
- Data Analysis: Process paired-end reads using HiC-Pro pipeline. Call loops using Fit-HiC2 or HiCCUPS at 5-10kb resolution.
Protocol 2: Functional Validation of a Conserved CTCF Site via CRISPR in Zebrafish
- Target Design: Identify conserved CBS using PhastCons/UCSC browser. Design sgRNA targeting the ~20bp core motif.
- sgRNA Synthesis: Synthesize sgRNA in vitro using T7 polymerase and a DNA template.
- Microinjection: Co-inject 50-100 pg of sgRNA and 300 pg of Cas9 protein into the yolk of 1-cell stage zebrafish embryos.
- Screening: At 24-48 hours post-fertilization (hpf), pool embryos for genomic DNA extraction. Assess editing efficiency via T7 Endonuclease I assay or Sanger sequencing tracking of indels (TIDE).
- Phenotypic Analysis: Raise injected embryos. Score for morphological defects (e.g., cyclopia). Fix at relevant stages for in situ hybridization to assess gene expression changes (e.g., shha).
Protocol 3: Insulator Assay for dCTCF Function in Drosophila S2 Cells
- Reporter Construction: Clone a minimal promoter (e.g., hsp70) driving luciferase, flanked by putative dCTCF binding sequences from the Fab-7 boundary into a vector.
- Cell Transfection: Co-transfect Drosophila S2 cells with the reporter construct and a dCTCF-specific dsRNA (for knockdown) or overexpression plasmid.
- Assay: After 72 hours, measure luciferase activity. Co-transfect a Renilla luciferase plasmid for normalization.
- Interpretation: Increased luciferase upon dCTCF knockdown indicates loss of insulator (enhancer-blocking) activity.
Visualization of Core Concepts and Workflows
Title: Cross-Species Framework for Studying CTCF Conservation
Title: Cohesin Extrusion & CTCF Anchoring in Loop Formation
The Scientist's Toolkit: Key Research Reagent Solutions
Table 3: Essential Reagents for Cross-Species CTCF/3D Genome Research
| Reagent / Material | Function & Application | Example Organism |
|---|---|---|
| Anti-CTCF Antibody (ChIP-grade) | Chromatin immunoprecipitation to map genome-wide binding sites. Validated for cross-reactivity in each model. | Mouse, Zebrafish, Drosophila |
| Auxin-Inducible Degron (AID) Tagging System | Rapid, reversible degradation of endogenously tagged CTCF protein for acute functional studies. | Mouse ESCs, Zebrafish |
| Pooled CRISPR sgRNA Libraries | High-throughput screening of CBS function by targeting thousands of sites in parallel. | Mouse, Zebrafish cell lines |
| Hi-C Kit (Proximity Ligation) | Standardized, optimized reagents for reproducible 3D genome conformation capture. | All (species-specific protocols) |
| Live-Cell Imaging Dyes (Hoechst, SiR-DNA) | Visualize nuclear architecture and dynamics in real-time in living embryos or cells. | Zebrafish, Drosophila |
| Transgenic Reporter Lines (Insulator Assay) | In vivo systems to test enhancer-blocking activity of putative CBS. | Drosophila, Mouse, Zebrafish |
This analysis provides a technical guide within a broader thesis investigating CTCF's role in 3D genome organization during cellular development. CTCF (CCCTC-binding factor) is a critical architectural protein that mediates chromatin looping, topologically associating domain (TAD) formation, and insulator function. Its binding dynamics are fundamental to the pluripotent state and are extensively rewired during lineage commitment, directly influencing gene regulatory programs.
Table 1: CTCF Binding and 3D Genome Metrics Across Cell States
| Metric | Pluripotent Stem Cells (e.g., mESCs/hESCs) | Differentiated Lineages (e.g., Neurons, Mesoderm) | Measurement Technique |
|---|---|---|---|
| CTCF Binding Sites | ~40,000 - 60,000 | ~20,000 - 35,000 (subset changes) | ChIP-seq |
| Cell-Type Specific Sites | Low (Canonical set) | High (Gained/Lost sites) | ChIP-seq differential analysis |
| TAD Boundary Strength | More plastic, weaker insulation | Generally stronger, more fixed | Hi-C Insulation Score |
| Chromatin Loop Anchors | Enriched at pluripotency gene promoters | Reconfigured to lineage-specific genes | Hi-C/ChIA-PET |
| CTCF Motif Orientation | Strictly conserved for loop formation | Altered at rearranged loops | MEME-ChIP, Hi-C |
| DNA Methylation at Sites | Low at promoters, variable at intergenic | High, correlates with site loss | WGBS, ChIP-seq |
| Co-binding with Cohesin | Ubiquitous at loop anchors | Context-dependent, often stable | ChIP-seq co-localization |
Table 2: Functional Consequences of CTCF Loss or Mutation
| Perturbation in Cell Type | Impact on 3D Genome | Transcriptional Outcome | Key Assay |
|---|---|---|---|
| Acute CTCF depletion in PSCs | Rapid TAD boundary erosion, loop loss | Dysregulation of pluripotency network, collapse | auxin-inducible degron, Hi-C, RNA-seq |
| CTCF site deletion in PSCs | Local insulation loss, ectopic enhancer-promoter contact | Mis-expression of development genes | CRISPR/Cas9, 4C, scRNA-seq |
| CTCF depletion in differentiated cells | TAD boundary maintenance varies; some are stable | Activation of inappropriate lineage genes | siRNA, Hi-C, RT-qPCR |
Experimental Protocols
3.1. Profiling CTCF Dynamics During Differentiation
- Objective: To map changes in CTCF binding and 3D genome architecture during directed differentiation.
- Workflow:
- Cell Culture & Differentiation: Maintain hESCs in defined pluripotency media. Initiate differentiation towards a target lineage (e.g., mesoderm using CHIR99021 and BMP4).
- Time-point Sampling: Harvest cells at days 0 (pluripotent), 2, 4, and 7 of differentiation. Validate stage-specific markers via flow cytometry (e.g., OCT4 loss, BRA gain).
- CTCF ChIP-seq:
- Crosslink cells with 1% formaldehyde for 10 min. Quench with glycine.
- Lyse cells and sonicate chromatin to 200-500 bp fragments.
- Immunoprecipitate with validated anti-CTCF antibody (e.g., Millipore 07-729).
- Reverse crosslinks, purify DNA, and prepare sequencing libraries.
- In-situ Hi-C:
- Fix cells as above. Lyse and digest chromatin with a 4-cutter restriction enzyme (e.g., MboI).
- Fill ends with biotinylated nucleotides and perform proximity ligation.
- Shear DNA, pull down biotinylated ligation junctions, and prepare libraries.
- Data Analysis: Map ChIP-seq peaks (MACS2). Call TADs and loops from Hi-C data (HiCExplorer, HiC-Pro/fit-hic). Integrate datasets to correlate CTCF site loss/gain with architectural changes.
3.2. Functional Validation of a Lineage-Specific CTCF Site
- Objective: To test the requirement of a differentiation-acquired CTCF site for gene regulation.
- Workflow:
- CRISPR/Cas9 Deletion: Design gRNAs flanking the candidate CTCF motif in differentiated cells. Transfect with Cas9 protein (RNP). Clone and genotype to isolate homozygous deletions.
- 3D Architecture Assay (4C-seq): Use the target gene promoter as a viewpoint. Process control and mutant cells for 4C-seq to assess changes in chromatin contacts.
- Transcriptional Output: Perform RT-qPCR and RNA-seq on clones to quantify expression of the target gene and neighboring genes.
- Reporter Assay: Clone the wild-type and deleted genomic region into a minimal promoter-luciferase vector. Transfect into progenitor cells and induce differentiation; measure enhancer activity.
Visualizations
CTCF and 3D Genome Dynamics During Differentiation
Workflow for Mapping CTCF and Architecture Dynamics
The Scientist's Toolkit: Research Reagent Solutions
| Reagent/Material | Function & Application | Example Product/Catalog |
|---|---|---|
| Validated Anti-CTCF Antibody | For ChIP-seq to immunoprecipitate CTCF-bound chromatin. Critical for mapping. | Millipore, 07-729; Cell Signaling, 3418S |
| CTCF Motif Mutant Cell Lines | Isogenic controls to study function of specific CTCF sites. Generated via CRISPR-Cas9. | Custom engineered (e.g., via Synthego) |
| Auxin-Inducible Degron (AID) System | For rapid, acute degradation of CTCF protein to study immediate 3D genome effects. | Takara, 631978 (dTAG system analogous) |
| Hi-C & Chromatin Conformation Kit | Standardized protocol for generating high-quality in-situ Hi-C libraries. | Arima Hi-C Kit, Arima Genomics |
| 4C-seq Primer Design Tool & Kit | To study specific chromatin interactions from a viewpoint of interest. | 4C-seq protocol (Nature Protocols, 2016); custom primers |
| Directed Differentiation Kit | Reproducibly generate specific lineages from PSCs for consistent comparisons. | STEMdiff Mesoderm Inducer (STEMCELL Tech) |
| High-Fidelity DNA Polymerase | For amplifying genomic regions for cloning and genotyping CRISPR edits. | Q5 High-Fidelity DNA Polymerase (NEB) |
| Next-Generation Sequencing Platform | For all sequencing outputs (ChIP-seq, Hi-C, RNA-seq). Essential for data generation. | Illumina NovaSeq 6000; NextSeq 2000 |
1. Introduction within the Thesis Context This guide is framed within a doctoral thesis investigating the role of CTCF in 3D genome organization during mammalian embryonic development. A central hypothesis posits that targeted depletion of specific CTCF binding sites (CBS) disrupts topologically associating domain (TAD) boundaries, leading to aberrant enhancer-promoter communication and consequent gene expression changes. This document provides a technical framework for rigorously validating that observed architectural disruptions are the direct cause of functional transcriptional outcomes, moving beyond correlation to causation.
2. Foundational Principles and Key Metrics To correlate architecture with function, specific quantitative metrics from Hi-C and RNA-seq must be calculated and compared.
Table 1: Core Quantitative Metrics for Correlation Analysis
| Assay | Primary Metric | Definition | Interpretation of Disruption | ||
|---|---|---|---|---|---|
| Hi-C / Micro-C | Directionality Index (DI) | Measures the bias in upstream vs. downstream contacts for a genomic region. | Loss of boundary-associated DI peak indicates boundary erosion. | ||
| Insulation Score | Quantifies the reduction in contact frequency across a given genomic coordinate. | A decrease in insulation score indicates loss of boundary strength. | |||
| TAD Boundary Score | A composite score often combining DI, insulation, and observed/expected contact matrix data. | A significant drop confirms boundary perturbation. | |||
| Interaction Frequency (IF) | Normalized read count between two genomic loci (e.g., enhancer and promoter). | A significant increase in IF across a degraded boundary suggests novel, aberrant contacts. | |||
| RNA-seq | Differential Expression (DE) | Log2 fold change (log2FC) and adjusted p-value (e.g., FDR) for genes. | log2FC | > 1 & FDR < 0.05 indicates significant change. | |
| Expression Variance | Change in variance of gene expression across biological replicates. | Increased variance can indicate dysregulated, stochastic expression. |
3. Experimental Protocol: An Integrated Multi-Omic Workflow
3.1. Experimental Design
- Cell/Model System: Differentiating mouse embryonic stem cells (mESCs) toward a neural progenitor cell (NPC) fate.
- Intervention: dCas9-KRAB-mediated epigenetic repression or Cas9-nuclease-mediated excision of a specific CBS at a TAD boundary crucial for Hox gene regulation.
- Controls: Wild-type (WT) cells and cells treated with non-targeting sgRNA.
- Time Points: Harvest cells at days 0 (pluripotent), 2, and 5 of differentiation post-intervention.
3.2. Detailed Methodologies
A. CRISPR-Cas9 Perturbation & Genotyping
- Reagents: Lipofectamine CRISPRMAX, sgRNA (targeting CBS), SpCas9 expression plasmid or ribonucleoprotein (RNP) complex.
- Protocol: Transfect mESCs. After 72 hours, isolate genomic DNA. Validate editing efficiency via:
- T7 Endonuclease I Assay: PCR amplify target region, heteroduplex formation, digestion, and gel electrophoresis.
- Sanger Sequencing & TIDE Analysis: Quantify indel percentages.
B. In Situ Hi-C (or Micro-C)
- Cell Fixation: Crosslink 1-2 million cells with 2% formaldehyde.
- Lysis & Digestion: Lyse cells, digest chromatin with a 4-cutter restriction enzyme (e.g., MboI).
- Proximity Ligation: Fill ends with biotin-labeled nucleotides, perform blunt-end ligation.
- DNA Purification & Shearing: Reverse crosslinks, purify DNA, shear to ~350 bp.
- Biotin Pull-down & Library Prep: Pull down biotin-labeled ligation junctions, prepare sequencing library.
- Bioinformatics: Process using HiC-Pro or Juicer tools. Generate contact matrices at multiple resolutions (e.g., 10 kb, 25 kb). Calculate insulation scores and call TADs with Arrowhead (Juicer) or InsulationScore (cooltools).
C. RNA Sequencing
- RNA Extraction: Use TRIzol, with DNase I treatment.
- Library Preparation: Use poly-A selection-based stranded mRNA library prep kit (e.g., NEBNext Ultra II).
- Sequencing: Aim for 30-40 million paired-end 150 bp reads per sample.
- Bioinformatics: Align to reference genome (STAR/Hisat2), quantify gene counts (featureCounts), perform differential expression analysis (DESeq2).
4. Data Integration and Correlation Analysis
Table 2: Correlation Strategy Table
| Architectural Perturbation (Hi-C) | Expected Gene Expression Outcome | Statistical Test |
|---|---|---|
| Decreased insulation score at Boundary X | Upregulation of Gene A (in adjacent TAD) | Pearson correlation between insulation score and Gene A's log2(expression). |
| New specific contact between Enhancer E and Promoter P | Upregulation of Gene P | Compare interaction frequency (IF) of E-P loop with expression of Gene P across samples. |
| Global loss of TAD boundary integrity | Increased expression correlation of gene pairs across former boundary | Compare pairwise gene expression correlations (Pearson's r) in WT vs. KO across the boundary. |
5. Visualization of Workflow and Logic
Diagram Title: Integrated Workflow for Validating Architectural Impact
Diagram Title: Mechanism of Ectopic Activation via Boundary Loss
6. The Scientist's Toolkit: Research Reagent Solutions
Table 3: Essential Reagents for CTCF/3D Genome Functional Validation
| Reagent / Tool | Supplier Examples | Critical Function |
|---|---|---|
| dCas9-KRAB Plasmid | Addgene, Sigma-Aldrich | Enables epigenetic repression without DNA cleavage for reversible perturbation. |
| High-Efficiency Cas9 RNP | IDT, Synthego | For clean, high-efficiency genomic excision of CBS with reduced off-target effects. |
| Validated CTCF Antibody (ChIP-grade) | Active Motif, Cell Signaling Technology | For confirming CBS occupancy loss via ChIP-qPCR post-perturbation. |
| UltraPure Formaldehyde | Thermo Fisher, Sigma | For consistent chromatin crosslinking in Hi-C protocols. |
| Biotin-14-dATP | Jena Bioscience, Thermo Fisher | Labeling of digested chromatin ends for Hi-C junction pulldown. |
| Streptavidin Magnetic Beads | New England Biolabs, Invitrogen | Isolation of biotinylated Hi-C ligation junctions. |
| Stranded mRNA Library Prep Kit | Illumina, NEBNext | For high-quality RNA-seq libraries preserving strand information. |
| Hi-C Analysis Pipeline (Juicer) | Open Source (Aiden Lab) | Standardized pipeline for processing Hi-C data from raw reads to normalized matrices. |
| DESeq2 R Package | Bioconductor | Industry-standard for robust differential expression analysis from RNA-seq count data. |
Within the broader thesis of CTCF's role in orchestrating 3D genome organization during development, its dysfunction is directly linked to human disease. This whitepaper delineates the dual pathological landscapes: somatic mutations disrupting CTCF-dependent insulator function and chromatin topology in cancer, and germline haploinsufficiency causing syndromic developmental disorders. We synthesize current data on mutation spectra, functional consequences, and emerging therapeutic strategies, providing a technical resource for disease mechanism research.
CTCF is a central architect of 3D genome organization, mediating insulator activity, loop formation, and topologically associating domain (TAD) boundaries. Its zinc finger (ZF) array binds thousands of genomic sites, with specificity determined by ZF sequence and DNA methylation status. During development, dynamic CTCF binding guides precise gene expression programs. Disruption of this finely tuned system—through either acquired somatic mutations or inherited germline variants—leads to profound pathological outcomes, exemplifying the critical importance of stable genome folding for cellular homeostasis and organismal development.
Somatic CTCF Mutations in Cancer
CTCF is among the most frequently mutated genes in cancer, with a pattern indicative of a haploinsufficient tumor suppressor.
Mutation Spectra and Recurrent Hotspots
Mutations are predominantly heterozygous, truncating (nonsense, frameshift), or missense, with clear clustering in exons encoding the central ZF domain. These alterations impair DNA binding.
Table 1: Prevalence of CTCF Mutations Across Selected Cancers (ICGC, TCGA Data)
| Cancer Type | Mutation Frequency (%) | Common Mutation Types | Key Hotspots (ZF Region) |
|---|---|---|---|
| Endometrial Carcinoma | 15-20% | Frameshift, Nonsense | ZF 4-7 |
| Wilms Tumor | 10-15% | Missense, Truncating | ZF 5-9 |
| Acute Myeloid Leukemia | 5-10% | Frameshift, Nonsense | ZF 2-8 |
| Glioblastoma | 5-8% | Missense, Deletions | ZF 3-6 |
Functional Consequences and Oncogenic Mechanisms
- Loss of Insulator Function: Abrogated boundary activity leads to aberrant enhancer-promoter communication (ectopic contacts), a key driver of oncogene activation.
- TAD Boundary Disruption: Hemizygous loss weakens boundary strength, allowing mixing of neighboring regulatory landscapes, as seen at the IGF2/H19 imprinted locus.
- Genome-Wide Dysregulation: Altered chromatin looping causes widespread transcriptional dysregulation, impacting genes controlling proliferation, apoptosis, and differentiation.
- Genomic Instability: Compromised CTCF binding at fragile sites may increase susceptibility to DNA damage and chromosomal translocations.
Experimental Protocol: Assessing CTCF Loss on Chromatin Looping (4C-seq or Hi-C)
Objective: To determine the impact of a specific somatic CTCF mutation on chromatin architecture at a known oncogenic locus (e.g., MYC enhancer domain). Methodology:
- Cell Model Generation: Use CRISPR/Cas9 in a relevant cancer cell line to introduce a heterozygous frameshift mutation in CTCF exon 5 (encoding ZF 4), mimicking a common somatic variant.
- Genotype Validation: Confirm mutation via Sanger sequencing and assess CTCF protein level by western blot (expect ~50% reduction).
- 4C-seq Workflow: a. Crosslinking: Fix cells with 2% formaldehyde. b. Digestion and Ligation: Perform sequential digestion with a 4-bp cutter (e.g., DpnII) and a 6-bp cutter (e.g., Csp6I). Ligate DNA under dilute conditions to favor intramolecular ligation. c. Viewpoint Selection: Design primers from a "bait" region within the MYC promoter or a known CTCF-bound boundary. d. Inverse PCR & Sequencing: Amplify ligation products and subject to high-throughput sequencing. e. Analysis: Map reads to the reference genome. Identify significant chromatin contacts in isogenic wild-type vs. CTCF-mutant cells. Validate specific looping changes by 3C-qPCR.
Figure 1: CTCF mutation disrupts TAD boundary, enabling ectopic oncogene activation.
Germline CTCF Variants in Developmental Syndromes
Heterozygous germline mutations in CTCF cause a rare intellectual disability/autism spectrum disorder known as CTCF-related neurodevelopmental disorder (CTCF-NDD) or Luscan-Lumish syndrome.
Genetic and Clinical Spectrum
Variants are largely de novo, dominant, and truncating, though missense variants in the ZF domain are also reported. The mechanism is haploinsufficiency.
Table 2: Clinical Features of CTCF-Related Neurodevelopmental Disorder
| Feature Category | Specific Manifestations | Approximate Penetrance |
|---|---|---|
| Neurological/Developmental | Intellectual Disability, Autism Spectrum Disorder, Developmental Delay, Hypotonia | >95% |
| Growth/Nutrition | Overgrowth (Postnatal), Feeding Difficulties, Obesity | ~70% |
| Dysmorphic Features | Characteristic Facial Gestalt (e.g., synophrys, wide mouth) | ~85% |
| Other Systems | Musculoskeletal anomalies, Recurrent Infections | ~50% |
Molecular Pathogenesis
Developmental pathogenesis stems from widespread dysregulation of CTCF targets during critical periods of neurodevelopment. Key mechanisms include:
- Altered Expression of Neuronal Genes: Misregulation of synaptic genes and transcription factors (e.g., DLX5/6, AUTS2) due to perturbed enhancer-promoter loops.
- Imprinted Gene Dysregulation: Disruption of CTCF-bound insulator sites at imprinted clusters (e.g., IGF2/H19, DLK1-DIO3), leading to loss of imprinting and abnormal dosage-sensitive gene expression.
- Genome-Wide Erosion of TAD Integrity: Reduced CTCF dosage leads to a general softening of TAD boundaries, increasing cell-to-cell variability in 3D genome organization and gene expression—a potential contributor to phenotypic variability.
Experimental Protocol: Modeling CTCF Haploinsufficiency in Neural Progenitor Cells (NPCs)
Objective: To profile transcriptional and chromatin topological changes due to germline CTCF haploinsufficiency in a developmentally relevant cell type. Methodology:
- Stem Cell Model: Introduce a patient-derived heterozygous truncating mutation (e.g., c.1891C>T; p.Arg631*) into a human pluripotent stem cell (hPSC) line via CRISPR/Cas9 homology-directed repair. Use an isogenic wild-type line as control.
- Differentiation: Differentiate hPSCs into dorsal forebrain neural progenitor cells (NPCs) using dual SMAD inhibition (LDN193189, SB431542) over 10-14 days.
- Multi-Omics Profiling: a. ATAC-seq: Assess genome-wide chromatin accessibility in mutant vs. wild-type NPCs. b. ChIP-seq: Perform H3K27ac (active enhancers) and CTCF profiling to correlate binding loss with epigenetic changes. c. In-situ Hi-C: Perform in mutant and wild-type NPCs to map TAD and loop alterations. Process data using standard pipelines (HiC-Pro, Juicer). d. RNA-seq: Isolate total RNA and perform strand-specific sequencing to identify differentially expressed genes, particularly those near altered loops/boundaries.
- Integration: Integrate datasets using tools like diffHic (for Hi-C) and r3Cseq to link specific topological disruptions to gene expression changes.
Figure 2: Experimental workflow to model CTCF-NDD in neural progenitors.
The Scientist's Toolkit: Key Research Reagents & Solutions
Table 3: Essential Reagents for Investigating CTCF in Disease
| Reagent/Solution | Provider Examples | Function/Application |
|---|---|---|
| Anti-CTCF Antibody (ChIP-seq grade) | Cell Signaling (3418S), Active Motif (61311) | Chromatin immunoprecipitation to map WT vs. mutant binding. |
| Methyltransferase Inhibitor (e.g., 5-Aza-2'-deoxycytidine) | Sigma-Aldrich, Cayman Chemical | To probe CTCF binding sensitivity to DNA methylation at target sites. |
| CUT&RUN/CUT&Tag Assay Kits | Epicypher, Cell Signaling (CST) | Low-input, high-resolution mapping of CTCF and histone marks in patient cells. |
| CRISPR/Cas9 Knock-in Kits (HDR) | Synthego, IDT | To precisely introduce patient-specific point mutations or tags into model cell lines. |
| Hi-C Library Preparation Kits | Arima Genomics, Phase Genomics | Standardized protocols for robust 3D chromatin conformation capture. |
| Directed Neural Differentiation Kits | STEMCELL Technologies, Thermo Fisher | Reproducible generation of disease-relevant neural cell types from hPSCs. |
| Isogenic Wild-Type & CTCF Mutant hPSC Pairs | Application-specific (e.g., gene-edited in-house or from repositories) | Essential control for functional studies, minimizing genetic background noise. |
Therapeutic Implications and Future Directions
The therapeutic targeting of CTCF loss-of-function is challenging due to its central, multifaceted role. Current strategies focus on downstream vulnerabilities:
- Synthetic Lethality: Identifying partners where inhibition is lethal in CTCF-deficient contexts (e.g., PARP inhibitors in CTCF-mutant cancers).
- Epigenetic Modulation: Using inhibitors (BET, HDAC) to counteract transcriptional dysregulation from lost insulation.
- Enhancer Interference: Exploring CRISPRi/a or small molecules to specifically target ectopically activated enhancers in cancer.
- Gene Correction: For germline disorders, in vitro correction of patient-derived iPSCs represents a long-term exploratory avenue.
Understanding the precise mechanistic link between specific CTCF variants, 3D genome rewiring, and phenotypic outcomes remains the core challenge, essential for translating basic genome architecture research into clinical insights.
Benchmarking Different 3D Genomics Technologies for CTCF Loop Detection
Within the broader thesis on CTCF's role in 3D genome organization during development, benchmarking technologies for detecting its characteristic chromatin loops is a foundational task. CTCF-mediated loops form the architectural basis of topologically associating domains (TADs), critically insulating regulatory elements during cellular differentiation. This whitepaper provides an in-depth technical guide to current methodologies, enabling researchers to select optimal approaches for developmental studies and identify potential therapeutic targets in diseases of genomic mis-regulation.
Core Technologies and Quantitative Benchmarking
The following table summarizes the key quantitative performance metrics of major 3D genomics technologies, based on recent benchmarking studies (2023-2024). Resolution refers to the minimum detectable loop size. "CTCF Specificity" indicates the technology's ability to distinguish CTCF-mediated loops from other chromatin interactions.
Table 1: Benchmarking 3D Genomics Technologies for CTCF Loop Detection
| Technology | Principle | Resolution | Throughput | Key Strengths for CTCF Loops | Key Limitations | Optimal Use Case |
|---|---|---|---|---|---|---|
| Hi-C (Standard) | Proximity ligation, paired-end sequencing. | ~1-10 kb (deep sequencing) | Low to Moderate | Genome-wide, gold standard for population-level maps. | High sequencing cost for high-res, requires high cell numbers. | Defining global architecture in developmental time courses. |
| Micro-C | Micrococcal nuclease digestion, proximity ligation. | <1 kb (nucleosome resolution) | Moderate | Superior resolution, maps loops and nucleosome positions simultaneously. | Complex protocol, high sequencing depth required. | Ultra-fine mapping of CTCF anchor boundaries in rare cell types. |
| HiChIP (e.g., CTCF HiChIP) | Proximity ligation with targeted protein immunoprecipitation. | ~1-5 kb | High | High signal-to-noise for protein-specific interactions, lower sequencing depth. | Antibody-dependent, not fully genome-wide. | Cost-effective profiling of CTCF loops across many developmental samples. |
| ChIA-PET | Chromatin Interaction Analysis with Paired-End Tag sequencing. | ~1-5 kb | Moderate | Directly links loops to specific protein binding (CTCF). | Technically challenging, lower throughput. | Mechanistic studies linking CTCF binding to specific loop formation. |
| SPRITE | Split-Pool Recognition of Interactions by Tag Extension. | ~10-100 kb (current) | Low | Identifies multi-way hubs, works in low-input scenarios. | Lower resolution for pairwise loops, complex analysis. | Studying CTCF in complex nuclear hubs during early development. |
| Dip-C | Single-cell whole-genome amplification + Hi-C. | ~100 kb - 1 Mb (single-cell) | High (single-cell) | Reveals cell-to-cell heterogeneity in loop formation. | Very low resolution for loops, captures only strongest signals. | Assessing CTCF loop variability in a developing tissue population. |
Detailed Experimental Protocols
High-Resolution Micro-C for CTCF Loop Mapping
This protocol is optimized for mapping CTCF-anchored loops at nucleosome resolution in mammalian developmental models (e.g., embryonic stem cells).
Key Reagents: Fixed cells, Micrococcal Nuclease (MNase), Biotin-14-dATP, T4 DNA Ligase, Streptavidin Beads.
Procedure:
- Crosslinking & Permeabilization: Harvest ~1 million cells. Crosslink with 2% formaldehyde for 10 min at RT. Quench with glycine. Pellet cells and permeabilize with ice-cold 0.5% NP-40 in PBS.
- MNase Digestion: Resuspend nuclei in MNase digestion buffer. Titrate MNase to achieve >80% mononucleosomes. Incubate 20 min at 37°C. Stop with EGTA.
- Chromatin End Repair & Biotinylation: Use Klenow fragment to fill in 5' overhangs with Biotin-14-dATP.
- Proximity Ligation: Dilute chromatin to promote in trans interactions. Add T4 DNA Ligase and incubate for 4 hours at 25°C.
- Reversal & DNA Purification: Reverse crosslinks overnight at 65°C with Proteinase K. Purify DNA with Phenol-Chloroform. Shear DNA to ~300 bp via sonication.
- Biotin Pull-down & Library Prep: Incubate with Streptavidin beads to isolate biotinylated ligation junctions. Prepare sequencing library on-bead using a compatible kit (e.g., Illumina). Sequence on a NovaSeq platform to target ~500 million paired-end reads.
CTCF HiChIP for Targeted Profiling
This protocol enables efficient, antibody-directed loop mapping, suitable for screening multiple developmental conditions.
Key Reagents: Validated anti-CTCF antibody, Protein A/G Magnetic Beads, T4 DNA Ligase, Biotin-14-dCTP, Dynabeads MyOne Streptavidin C1.
Procedure:
- Crosslinking & Digestion: Crosslink cells as in 3.1. Lyse and digest chromatin with MboI or DpnII (4-cutter) restriction enzyme.
- Fill-in & Biotinylation: Fill in restriction overhangs with biotin-14-dCTP using DNA Polymerase I, Large (Klenow) Fragment.
- Dilution & Ligation: Dilute for in situ ligation with T4 DNA Ligase.
- Nuclear Lysis & Chromatin Shearing: Lyse nuclei and shear chromatin via sonication to ~300-500 bp.
- Immunoprecipitation: Incubate with anti-CTCF antibody conjugated to Protein A/G beads overnight at 4°C. Wash stringently.
- DNA Recovery & Library Prep: Reverse crosslinks, purify DNA. Capture biotinylated fragments using Streptavidin C1 beads. Perform library construction on-bead. Sequence to a depth of ~100-200 million reads.
Visualization of Workflows and Logical Frameworks
Title: Hi-C vs. Micro-C Experimental Workflow Comparison
Title: Logical Pathway of CTCF-Mediated Loop Formation
Title: Decision Tree for 3D Genomics Technology Selection
The Scientist's Toolkit: Essential Research Reagents & Solutions
Table 2: Key Reagent Solutions for CTCF Loop Detection Assays
| Item | Function in Experiment | Key Considerations for Developmental Studies |
|---|---|---|
| Formaldehyde (37%) | Crosslinks protein-DNA and protein-protein interactions, "freezing" chromatin loops. | Titrate concentration (1-3%) and time to balance crosslinking efficiency vs. antigen masking for ChIP-based methods. |
| Micrococcal Nuclease (MNase) | Digests linker DNA for nucleosome-resolution mapping in Micro-C. | Requires careful titration on nuclei from rare developmental cell types to achieve mononucleosome profile. |
| T4 DNA Ligase | Catalyzes proximity ligation of crosslinked DNA ends, capturing interaction junctions. | Use high-concentration, high-purity formulations for efficient in situ ligation in fixed chromatin. |
| Biotin-14-dATP/dCTP | Labels ligation junctions during fill-in steps, enabling streptavidin-based enrichment. | Critical for background reduction in HiChIP and Micro-C. Fresh aliquots recommended. |
| High-Affinity Anti-CTCF Antibody | Immunoprecipitates CTCF-bound fragments in ChIA-PET and HiChIP. | Validate for ChIP-grade specificity in your model system; clone D31H2 (CST) is widely used. |
| Protein A/G Magnetic Beads | Captures antibody-bound chromatin complexes. | Offer consistency and ease of washing over agarose beads, improving reproducibility across samples. |
| Streptavidin C1 Dynabeads | Efficiently pulls down biotinylated ligation products post-IP or ligation. | MyOne C1 beads have high capacity and low non-specific binding, crucial for complex genomes. |
| Pfu Turbo DNA Polymerase | Used in library amplification for high-fidelity, low-bias replication. | Minimizes PCR artifacts that can confound loop detection, especially in low-input samples. |
| DpnII / MboI Restriction Enzyme | Cuts frequent 4-bp sites for Hi-C and HiChIP, fragmenting genome for ligation. | Ensure complete digestion for uniform coverage; consider using a cocktail for complex genomes. |
| Dual Indexed Adapters (Illumina) | Allows multiplexing of dozens of samples in a single sequencing run. | Essential for cost-effective screening of multiple developmental time points or conditions. |
Conclusion
CTCF emerges as the quintessential conductor of the genome's spatial orchestra, with its precise positioning and function being indispensable for normal development. The integration of foundational principles, advanced methodologies, robust troubleshooting, and cross-context validation solidifies our understanding that CTCF-mediated 3D genome organization is a primary regulatory layer of cell fate determination. Future research must leverage single-cell multi-omics and high-resolution time-course experiments to decode the real-time dynamics of chromatin folding during fate transitions. For biomedical and clinical research, this underscores CTCF and its associated complexes as high-value targets: its mutations provide mechanistic insights into congenital disorders, while its dysregulation in cancer offers potential for novel epigenetic therapies aimed at rewiring pathogenic genome architecture. The next frontier lies in developing pharmacological modulators of CTCF-cohesin activity and translating 3D genomic maps into predictive diagnostic tools.