Single-Cell ATAC-Seq: A Comprehensive Guide to Chromatin Accessibility Profiling in Biomedical Research
Single-cell Assay for Transposase-Accessible Chromatin using sequencing (scATAC-seq) has emerged as a transformative technology for mapping the epigenetic landscape of individual cells within complex tissues.
Single-Cell ATAC-Seq: A Comprehensive Guide to Chromatin Accessibility Profiling in Biomedical Research
Abstract
Single-cell Assay for Transposase-Accessible Chromatin using sequencing (scATAC-seq) has emerged as a transformative technology for mapping the epigenetic landscape of individual cells within complex tissues. This article provides a comprehensive overview for researchers and drug development professionals, covering the foundational principles of chromatin accessibility, current methodological approaches and their diverse applications in disease research, key challenges in data analysis and experimental optimization, and a comparative evaluation of established protocols. By synthesizing the latest technological advances and benchmarking studies, this resource aims to equip scientists with the knowledge to effectively implement scATAC-seq in their research programs, from basic discovery to clinical translation.
The Epigenomic Frontier: Understanding Chromatin Accessibility and scATAC-seq Fundamentals
Chromatin accessibility describes the physical degree to which regional DNA is open and accessible to protein interactions, rather than tightly wound around nucleosomes. This accessibility is a fundamental prerequisite for gene regulation, as it governs the interaction between transcription factors (TFs) and DNA [1] [2]. At the core of epigenetic regulation, chromatin accessibility modulates essential processes such as transcription factor binding, enhancer activation, and ultimately, gene expression [1] [3]. The development of the Assay for Transposase-Accessible Chromatin using sequencing (ATAC-seq) and its single-cell counterpart (scATAC-seq) has provided powerful tools to map this accessible genome, offering unprecedented insights into cellular heterogeneity and the regulatory logic that underpins cellular identity and function [3] [2].
Core Principles Linking Accessibility to Regulation
The relationship between an open chromatin landscape and gene regulation is governed by several key principles, which have been elucidated through single-cell technologies.
- Principle 1: Accessibility Defines Functional Regulatory Elements. Open chromatin regions are not randomly distributed; they systematically mark functional regulatory elements, including promoters, enhancers, and insulators. The binding of transcription factors to these accessible sites is a primary step in initiating gene expression programs [2].
- Principle 2: Cell-to-Cell Variation in Accessibility Underlies Heterogeneity. Single-cell analysis has revealed that chromatin accessibility is not uniform across cell populations. This variation is a universal feature that impacts biological phenomena from developmental plasticity to tumor heterogeneity, and it is systematically associated with specific trans-factors and cis-elements [3].
- Principle 3: Combinatorial TF Binding Drives Variability and Specificity. The variation in accessibility at regulatory elements is often driven by the synergistic or competitive binding of specific transcription factors. For example, in K562 cells, competitive binding between GATA1 and GATA2 to identical consensus sequences can induce significant cell-to-cell variability in accessibility, whereas factors like CTCF often suppress variability and promote stable chromatin states [3].
- Principle 4: Chromatin Accessibility Connects Genetic Variation to Phenotype. Genetic variants, such as single nucleotide polymorphisms (SNPs), can alter chromatin accessibility. These chromatin accessibility quantitative trait loci (caQTLs) provide a mechanistic link between non-coding genetic associations and gene expression, helping to explain the molecular basis of complex traits and diseases [4] [5].
Table 1: Key Regulatory Elements Identified by Chromatin Accessibility
| Element Type | Primary Function | Characteristic scATAC-seq Signal |
|---|---|---|
| Promoter | Initiation of transcription | Strong enrichment of fragments at transcription start sites (TSS) |
| Enhancer | Enhancement of transcription frequency | Accessible regions distal to TSS, often cell-type-specific |
| Insulator | Organization of chromatin domains | Binding sites for factors like CTCF; can define topological domain boundaries |
Key Methodologies and Experimental Protocols
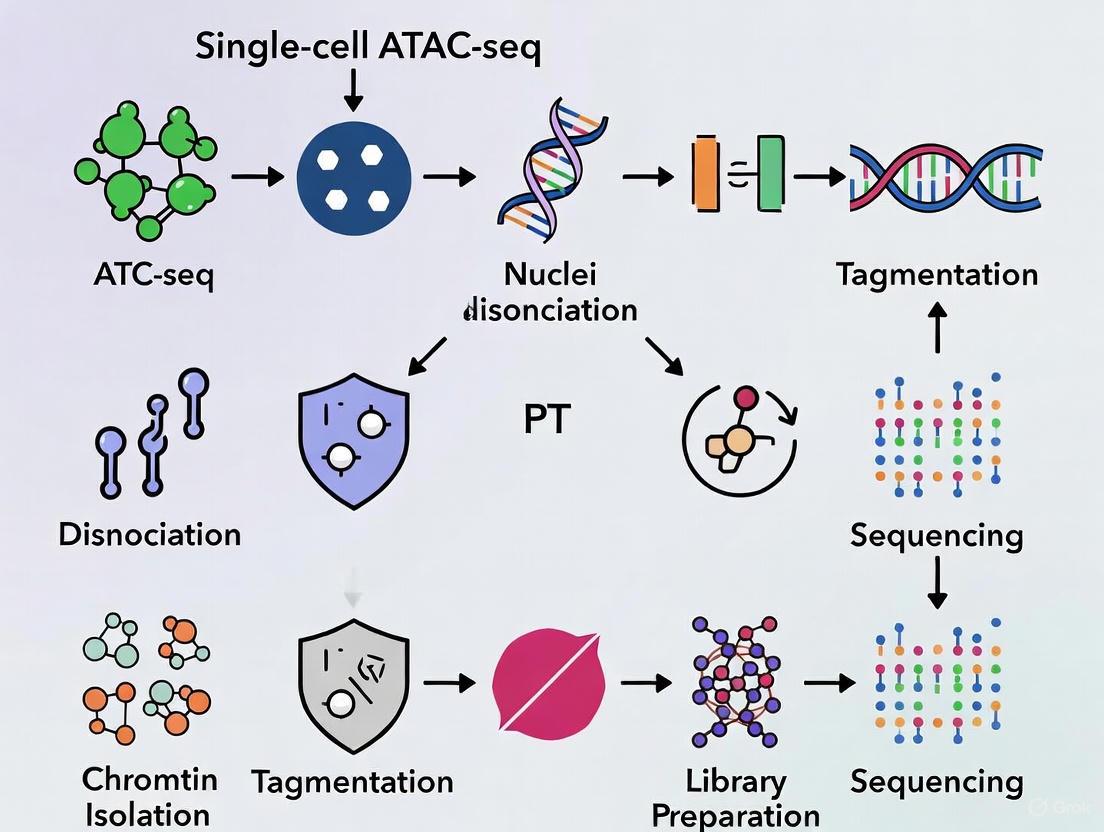
Single-Cell ATAC-seq Wet-Lab Workflow
The foundational protocol for profiling chromatin accessibility at single-cell resolution involves several critical steps to ensure high-quality data.
- Cell Nuclei Preparation. For fresh tissues or cells, nuclei are isolated using standard lysis buffers. For clinically archived Formalin-Fixed Paraffin-Embedded (FFPE) samples, this requires a specialized nuclei isolation protocol involving deparaffinization, rehydration, and antigen retrieval, followed by optimized density gradient centrifugation (e.g., 25%/36%/48% layers) to separate pure nuclei from cellular debris [1].
- Tagmentation with Tn5 Transposase. Isolated nuclei are tagmented using a hyperactive Tn5 transposase. This enzyme simultaneously fragments accessible DNA and inserts sequencing adapters. For challenging samples like FFPE tissues, an FFPE-adapted Tn5 transposase has been developed to handle extensive DNA damage [1] [2].
- Single-Cell Barcoding and Library Preparation. Tagmented nuclei are loaded onto a microfluidic device (e.g., the Fluidigm C1 system) or a droplet-based system for single-cell partitioning. Within each partition, the DNA fragments undergo barcoding with a unique cellular barcode during PCR amplification. Modern methods can generate over 56 million unique barcodes per run [1] [3].
- Sequencing. The pooled, barcoded libraries are sequenced on a high-throughput platform, typically using paired-end sequencing to facilitate higher unique alignment rates [2].
Computational Analysis of scATAC-seq Data
The analysis of scATAC-seq data requires a specialized computational pipeline to transform raw sequencing data into biological insights.
- Pre-analysis: Quality Control and Alignment.
- Pre-alignment QC: Use FastQC to visualize base quality, GC content, and adapter contamination. Trim adapters (e.g., Trimmomatic for Nextera adapters) and low-quality bases [2].
- Alignment: Map trimmed reads to a reference genome using a memory-efficient aligner like BWA-MEM or Bowtie2. A unique mapping rate of over 80% is expected for a successful experiment [2].
- Post-alignment QC and Processing: Remove reads mapping to the mitochondrial genome and ENCODE blacklisted regions. Mark and remove PCR duplicates. Assess ATAC-seq-specific quality metrics, including fragment size distribution (showing periodicity for nucleosome-free, mono-, and di-nucleosome fragments) and enrichment of fragments at transcription start sites (TSS). Shift reads +4 bp (positive strand) and -5 bp (negative strand) to account for the 9-bp duplication created by Tn5 [2].
- Core Analysis: Peak Calling and Matrix Generation. Identify accessible genomic regions (peaks) using a peak caller such as MACS2, which is the default in the ENCODE pipeline. A cell-by-peak binary count matrix is then generated, which is characteristically sparse [2].
- Advanced Analysis:
- Dimensionality Reduction and Clustering: Use methods like Latent Semantic Indexing (LSI) or regularized non-negative matrix factorization (as in scOpen) to reduce dimensions. Cells can then be clustered based on their accessibility profiles to identify putative cell types [6] [2].
- Imputation: Overcome data sparsity with imputation tools designed for scATAC-seq data, such as scOpen, which has been shown to improve downstream clustering and visualization [6].
- Motif and Footprint Analysis: Identify transcription factor binding motifs that are enriched in accessible regions. Footprinting analysis can infer TF binding by looking for characteristic "footprints" of protection from Tn5 cleavage within an accessible region [2].
Diagram 1: scATAC-seq Wet-Lab and Computational Workflow
The Scientist's Toolkit: Essential Reagents and Materials
Successful execution of a single-cell chromatin accessibility study relies on a suite of specialized reagents and tools.
Table 2: Key Research Reagent Solutions for scATAC-seq
| Reagent / Material | Function | Example Application Notes |
|---|---|---|
| Hyperactive Tn5 Transposase | Enzymatically fragments and tags accessible genomic DNA. | Commercial kits are available; an FFPE-adapted Tn5 is critical for archived clinical samples [1]. |
| Microfluidic Partitioning System | Isolates individual cells/nuclei for barcoding. | Systems like the 10x Genomics Chromium Controller or Fluidigm C1 IFCs are widely used [3]. |
| Nuclei Isolation Kit | Releases intact nuclei from tissue or cells. | Optimized protocols and kits are essential for FFPE samples to remove debris and reverse cross-links [1]. |
| Single-Cell Barcoded Primers | Uniquely labels DNA from each cell during PCR. | Enables pooling of thousands of cells into a single sequencing library while retaining cell-of-origin information [1] [3]. |
| Density Gradient Media | Purifies nuclei away from cellular debris. | Critical for FFPE samples; a finer gradient (e.g., 25%/36%/48%) is required compared to fresh samples [1]. |
| Computational Tools (e.g., scOpen) | Imputes and denoises sparse scATAC-seq data. | Improves downstream clustering, visualization, and identification of regulatory features [6]. |
| Nialamide | Nialamide, CAS:51-12-7, MF:C16H18N4O2, MW:298.34 g/mol | Chemical Reagent |
| Naphthoquine phosphate | Naphthoquine Phosphate|CAS 173531-58-3|Antimalarial Reagent | Naphthoquine phosphate is an antimalarial research reagent. It is for Research Use Only (RUO). Not for human or veterinary use. |
Applications in Disease Research and Drug Development
Chromatin accessibility profiling has become indispensable for understanding disease mechanisms and informing drug discovery, particularly through the lens of cellular heterogeneity.
- Uncovering Tumor Heterogeneity and Progression: scATAC-seq has been applied to FFPE tumor tissues to dissect the epigenetic heterogeneity within the tumor microenvironment. For example, in human lung cancer, comparing epithelial cells from the tumor center versus the invasive edge revealed distinct regulatory trajectories and unique epigenetic drivers of cancer invasion [1]. Similarly, analysis of paired primary and relapsed follicular lymphoma samples has identified patient-specific epigenetic regulators of tumor relapse and transformation [1].
- Linking Genetic Variants to Disease Mechanisms through caQTLs: Mapping chromatin accessibility quantitative trait loci (caQTLs) provides a powerful approach to annotate non-coding disease-risk variants from genome-wide association studies (GWAS). A key finding is that caQTLs can detect regulatory mechanisms missed by expression QTLs (eQTLs). For instance, in liver tissue, caQTLs identified threefold more colocalizations with GWAS signals for metabolic traits than eQTLs from a larger sample size, highlighting their sensitivity for uncovering regulatory mechanisms [5]. In immune-mediated diseases, caQTLs in lymphoblastoid cell lines have helped explain disease heritability not captured by eQTLs alone, pointing to cell-type-specific regulatory effects [4].
- Dissecting Cellular Responses in Drug Screening: Single-cell multiomics technologies, which combine ATAC-seq with other assays like transcriptomics, are increasingly used in drug screening. These approaches can link cellular-level insights with individualized drug responses, enabling the identification of specific cell types or states that are sensitive or resistant to therapy, and uncovering the underlying regulatory networks involved [7].
Diagram 2: Gene Regulation Path from Genetic Variant to Disease
The core principles of chromatin accessibility provide a foundational framework for understanding the dynamic control of the genome. The advent of single-cell ATAC-seq has transformed this field, moving from population-level averages to a high-resolution view of cellular diversity. By revealing the cell-type-specific regulatory elements, the combinatorial logic of transcription factor binding, and the impact of genetic variation on the epigenetic landscape, this technology offers profound insights into normal development, disease etiology, and therapeutic intervention. As protocols for challenging sample types like FFPE continue to improve and computational methods become more sophisticated, the integration of chromatin accessibility profiling into biomedical research will undoubtedly yield deeper mechanistic discoveries and accelerate the development of novel targeted therapies.
The Assay for Transposase-Accessible Chromatin using sequencing (ATAC-seq) has fundamentally transformed our ability to map the regulatory landscape of the genome. By leveraging a hyperactive Tn5 transposase that simultaneously fragments and tags accessible DNA regions, it provides a simple, rapid, and sensitive method to identify active regulatory elements such as enhancers, promoters, and insulators [8]. The more recent advent of single-cell ATAC-seq (scATAC-seq) represents a pivotal revolution, shifting the paradigm from analyzing population averages to dissecting epigenetic heterogeneity at the resolution of individual cells. This shift is crucial for understanding complex biological systems, where cellular diversity underpins development, disease progression, and treatment response [9] [10].
Applications of scATAC-seq in Research and Drug Discovery
The move from bulk to single-cell resolution has unlocked new applications across biomedical research, providing unprecedented insights into cellular identity, heterogeneity, and dynamic processes.
- Dissecting Tumor Heterogeneity and Evolution: scATAC-seq profiles chromatin accessibility in individual cells within a tumor, revealing distinct subpopulations of cancer cells and their unique regulatory states. This has been instrumental in identifying relapse- and transformation-associated epigenetic dynamics in lymphomas and in uncovering distinct regulatory trajectories between the center and invasive edge of lung cancer tumors [1].
- Mapping Cellular Trajectories in Development: During processes like embryogenesis or cellular differentiation, scATAC-seq can trace the sequential opening and closing of chromatin regions, helping to identify master transcription factors that drive lineage commitment and cellular fate [10].
- Deconvoluting the Tumor Microenvironment and Immune Response: In immuno-oncology and autoimmune disease research, scATAC-seq can profile the epigenetic states of diverse immune cells (e.g., T cells, B cells) within a tissue. This helps in understanding how chromatin landscapes in immune cells change in response to stimulation or within the tumor microenvironment, identifying key regulators of immune activation and exhaustion [11] [10].
- Accelerating Drug Discovery and Target Identification: scATAC-seq is used in high-throughput chemical screens to map compound- and dose-dependent effects on the chromatin landscape. By exposing cells to various drugs and concentrations, researchers can identify drug-altered distal regulatory sites and link them to transcriptional outcomes, thereby credentialing and prioritizing therapeutic targets [11].
Table 1: Key Applications of scATAC-seq Across Biological Fields
| Field | Application | Key Insight Enabled by scATAC-seq |
|---|---|---|
| Cancer Biology | Tumor Heterogeneity | Identification of epigenetic subclones and rare cell populations driving resistance [1] [10]. |
| Developmental Biology | Lineage Tracing | Mapping of regulatory trajectories and identification of master transcription factors during differentiation [10]. |
| Neurobiology | Brain Disorders | Discovery of cell-type-specific chromatin changes in neurons and glia in Alzheimer's, autism, and schizophrenia [10]. |
| Immunology & Autoimmunity | Immune Cell Profiling | Characterization of chromatin states underlying T-cell and B-cell activation, exhaustion, and dysregulation in disease [11] [10]. |
| Drug Discovery | Chemical Screens | Evaluation of drug mechanisms of action and epigenetic perturbations at single-cell resolution [11]. |
Quantitative Performance: scATAC-seq vs. Bulk ATAC-seq
A critical comparison reveals that while bulk and scATAC-seq capture the same fundamental chromatin architecture, scATAC-seq offers superior data quality and sensitivity when analyzing heterogeneous samples [9].
Table 2: Comparison of Bulk and Single-Cell ATAC-Seq Performance
| Feature | Bulk ATAC-seq | Single-Cell ATAC-seq (scATAC-seq) |
|---|---|---|
| Resolution | Population average | Individual cells |
| Data Quality on Homogeneous Samples | Robust and established | Generates substantially higher quality signal with improved sensitivity for weak signals [9]. |
| Analysis of Heterogeneous Samples | Requires prior cell sorting; obscures cellular diversity | Identifies sub-groups and rare cell types within mixed populations computationally [9]. |
| Key Challenge | Cannot resolve cellular heterogeneity | High data sparsity (>90% zeros); requires specialized computational methods [12]. |
| Typical Input | 50,000+ cells [8] | 5,000 - 10,000+ cells per run |
| Primary Output | Genome-wide accessibility profile | Cell-by-peak matrix for clustering and trajectory analysis |
Detailed Experimental Protocols
Protocol 1: High-Throughput scATAC-seq with Sample Multiplexing (sciPlex-ATAC-seq)
This protocol enables the concurrent profiling of chromatin accessibility from virtually unlimited specimens, significantly reducing batch effects and costs [11].
- Nuclei Isolation and Permeabilization: Isolate nuclei from your samples (e.g., cell cultures or tissues). Distribute them to a 96-well plate and permeabilize them.
- Hash Labeling: Incubate nuclei in each well with a unique, sample-specific unmodified DNA "hash" oligo. The oligos are absorbed and stabilized within the nuclei via fixation.
- Indexed Primer Extension: Perform an indexed primer extension reaction to incorporate well-specific barcodes onto the hash oligos.
- Indexed Transposition: In the same well, perform tagmentation using Tn5 transposase. This step creates a known pairing between the well barcodes on the hash oligos and the tagmented chromatin fragments.
- Nuclei Pooling and Sorting: Pool all nuclei from different wells. Stain with DAPI and flow-sort into a new 96-well plate.
- Library Preparation and Sequencing: Reverse crosslinks, then perform PCR to amplify both the hash tags and the tagmented DNA fragments. The resulting libraries are sequenced on a high-throughput platform.
- Bioinformatic Demultiplexing: Use computational tools to assign each cell to its original sample based on the enriched hash tag, correcting for barcode hopping based on fragment ratios [11] [13].
Protocol 2: scATAC-seq for Archived FFPE Samples (scFFPE-ATAC)
This protocol overcomes the challenge of extensive DNA damage in formalin-fixed paraffin-embedded (FFPE) samples, enabling epigenetic studies of vast clinical archives [1].
- Nuclei Extraction from FFPE Tissue: Deparaffinize and rehydrate FFPE tissue sections or punch cores. Perform optimized enzymatic and mechanical digestion to extract nuclei.
- Debris Removal via Density Gradient Centrifugation: Purify nuclei using a customized density gradient centrifugation (e.g., 25%/36%/48% layers). For FFPE samples, pure nuclei are recovered from the top layer (25%/36% interface), distinct from fresh samples [1].
- FFPE-Tn5 Transposition: Tagment the purified nuclei using a specially designed FFPE-adapted Tn5 transposase.
- DNA Damage Rescue and In Vitro Transcription: Employ T7 promoter-mediated DNA damage rescue and in vitro transcription to overcome fragmentation issues and amplify the signal.
- High-Throughput DNA Barcoding: Use a split-and-pool strategy to barcode fragments from individual nuclei with over 56 million unique barcodes.
- Library Preparation and Sequencing: Construct sequencing libraries and sequence on an Illumina platform.
Visualizing the Experimental Workflows
High-Throughput Multiplexing (sciPlex-ATAC-seq)
High-Throughput Multiplexing Workflow
Epigenetic Analysis of Archived FFPE Samples
FFPE Sample Analysis Workflow
The Scientist's Toolkit: Essential Reagents and Materials
Table 3: Key Research Reagent Solutions for scATAC-seq
| Reagent / Material | Function | Example Use-Case |
|---|---|---|
| Hyperactive Tn5 Transposase | Fragments and tags accessible genomic DNA with sequencing adapters. | Core enzyme in all ATAC-seq protocols [8]. |
| FFPE-adapted Tn5 Transposase | A specially engineered transposase optimized for handling formalin-induced DNA damage and crosslinking. | Enables chromatin accessibility profiling from long-term archived FFPE samples [1]. |
| Hash Oligos (Unmodified DNA) | Sample-specific nuclear labels for multiplexing. | Allows pooling of up to hundreds of samples in a single sciPlex-ATAC-seq run, reducing costs and batch effects [11]. |
| Custom Tn5 Barcodes | Sample barcodes pre-loaded onto Tn5 enzymes. | Enables sample multiplexing at the tagmentation step, simplifying library prep [13]. |
| Formaldehyde (Low Concentration) | Mild fixation agent for sample preservation. | Stabilizes chromatin structure in cells for cryopreservation, maintaining high data quality comparable to fresh samples [13]. |
| Density Gradient Media | Separates intact nuclei from cellular debris and extracellular matrix. | Critical for obtaining high-quality nuclei from challenging samples like FFPE tissues [1]. |
| bisindolylmaleimide II | bisindolylmaleimide II, CAS:137592-45-1, MF:C27H26N4O2, MW:438.5 g/mol | Chemical Reagent |
| (Z)-Oleyloxyethyl phosphorylcholine | (Z)-Oleyloxyethyl phosphorylcholine, CAS:84601-19-4, MF:C25H52NO5P, MW:477.7 g/mol | Chemical Reagent |
Challenges and Future Directions
Despite its transformative potential, scATAC-seq faces significant challenges. A primary issue is extreme data sparsity, where over 90% of the data matrix entries are zeros, complicating normalization and analysis [12]. Current normalization methods like TF-IDF can be inefficient at removing library size effects [12]. Furthermore, while scATAC-seq provides physical single-cell resolution, data sparsity can limit the ability to infer true chromatin accessibility states at the level of individual loci in individual cells [12]. Sample preservation and handling also remain critical; while new fixation and cryopreservation strategies show promise [13], and methods like scFFPE-ATAC unlock archival tissues [1], protocol optimization is essential for high-quality data. The future of the field lies in developing more sensitive assays to reduce sparsity, improved computational models to extract finer-resolution information [12], and the continued integration of scATAC-seq with other single-cell modalities to build a comprehensive picture of cellular identity and function.
Single-cell Assay for Transposase-Accessible Chromatin using sequencing (scATAC-seq) has emerged as a powerful tool for dissecting regulatory landscapes and cellular heterogeneity in complex tissues. This application note details three principal technological workflows—microfluidics, combinatorial indexing, and nano-well platforms—that enable chromatin accessibility profiling at single-cell resolution. The ability to map cell-type-specific cis-regulatory elements is essential for understanding gene regulatory mechanisms underlying development, disease, and cellular differentiation [14]. As the field advances, each technological approach offers distinct advantages in scalability, cost-effectiveness, and data quality, presenting researchers with multiple pathways for experimental design. This document provides a comprehensive technical overview of these methodologies, including quantitative performance comparisons, detailed protocols, and essential reagent solutions to guide researchers in selecting and implementing appropriate scATAC-seq workflows for their specific research needs.
Technology Comparison and Performance Metrics
The three main technological platforms for scATAC-seq offer complementary strengths in throughput, cost, and data quality. Understanding these trade-offs is crucial for experimental planning and technology selection.
Table 1: Comparative Analysis of scATAC-seq Technological Platforms
| Platform | Maximum Cell Throughput | Cost Efficiency | Key Quality Metrics | Primary Applications | Technical Considerations |
|---|---|---|---|---|---|
| Microfluidics (e.g., 10x Genomics) | ~10,000 cells per run [15] | Moderate (commercial pricing) | Median FRiP: 0.66-0.71 [15] [16]; TSS enrichment: 5.28-6.26 [16] | Atlas-scale studies, multiomics, clinical samples | High library complexity, excellent tagmentation specificity [15] |
| Combinatorial Indexing (e.g., sciATAC, UDA-seq) | >100,000 cells [17] [16] | High (low per-cell cost) | FRiP: ~0.59-0.66 [16]; Cell recovery: 37-62% [17] | Large-scale profiling, biobank samples, method development | Requires specialized computational demultiplexing [17] |
| Nano-well Platforms (e.g., ICELL8) | 5,184 reactions per chip [16] | Moderate to high | Median unique fragments: 12,784 per cell [18]; Cross-contamination: ~6% [16] | Targeted studies, low-input samples, protocol optimization | Lower multiplexing capacity, requires cell sorting |
Table 2: Quantitative Performance Metrics Across scATAC-seq Methods
| Method | Unique Fragments per Cell | Fraction of Reads in Peaks (FRiP) | TSS Enrichment Score | Doublet/Collision Rate | Sequencing Saturation |
|---|---|---|---|---|---|
| 10x Genomics Multiome | Varies by protocol | 0.66 [16] | 5.28 (median) [16] | Standard droplet-based rates | Protocol-dependent |
| sciATAC-v2 | 9360 (median) [16] | 0.66 (median) [16] | 4.88 (mean) [16] | ~6% cross-contamination [16] | 3.8% [16] |
| UDA-seq | Species-mixing validated [17] | Comparable to standard methods [17] | Similar to standard procedures [17] | 0.67-2.11% [17] | Not specified |
| Plate-based | 31,808 (median) [19] | 0.50-0.60 (median) [19] | Strong TSS enrichment [19] | ~1.3% doublets [19] | ~95% duplication rate [19] |
Figure 1: Decision Framework for scATAC-seq Technology Selection
Detailed Experimental Protocols
Microfluidics-based scATAC-seq (10x Genomics Platform)
Principle: Single cells/nuclei are co-encapsulated with barcoded beads in microdroplets using specialized microfluidic chips, enabling high-throughput parallel processing [20]. This approach leverages precise fluid control at microscale to isolate individual cells and perform molecular tagging in nanoliter-scale reactions.
Step-by-Step Protocol:
Sample Preparation and Nuclei Isolation
- Begin with fresh or cryopreserved cells (PBMCs, tissue dissociates, or cell cultures). For frozen samples, employ a fixation protocol with 0.1% formaldehyde followed by DMSO cryopreservation to maintain chromatin architecture [13].
- Isolate nuclei using lysis buffer (10 mM Tris-HCl, pH 7.4, 10 mM NaCl, 3 mM MgCl₂, 0.1% Tween-20, 0.1% Nonidet P-40, 0.01% Digitonin, 1% BSA). Centrifuge at 500-800 rcf for 10 minutes at 4°C.
- Resuspend nuclei in wash buffer (1x PBS, 1% BSA, 0.1% Tween-20) and filter through a 40-μm flow cytometry sieve. Determine nuclei concentration and viability using trypan blue or propidium iodide staining.
Tn5 Transposase Reaction in Droplets
- Load the Chromium chip with nuclei suspension, ATAC enzyme mix (Tn5 transposase), and partitioning oil according to manufacturer's specifications.
- During droplet generation, each nucleus is co-encapsulated with a single barcoded gel bead in an oil-aqueous emulsion droplet.
- The tagmentation reaction occurs within droplets, where Tn5 transposase simultaneously fragments accessible chromatin and adds adapter sequences [8].
Library Preparation
- Break droplets using perfluorocarbon-based breaking solution and recover barcoded DNA fragments.
- Perform PCR amplification (12-15 cycles) with sample index primers to complete library construction.
- Clean up amplified libraries using SPRIselect beads (0.6x-1.2x ratio) to remove primers and short fragments.
Quality Control and Sequencing
- Assess library quality using Bioanalyzer/TapeStation (typical distribution: 100-1000 bp with nucleosomal periodicity).
- Quantify libraries by qPCR or fluorometry before pooling at equimolar ratios.
- Sequence on Illumina platforms (NovaSeq, NextSeq) with recommended read configuration: Read1: 50 bp, Read2: 50 bp, Index1: 8 bp, Index2: 24 bp.
Critical Steps for Success:
- Maintain nuclei integrity and avoid clumping through gentle pipetting and quick processing.
- Optimize nuclei concentration for target cell recovery (aim for 5,000-10,000 nuclei per reaction).
- Include mitochondrial DNA depletion steps if high mitochondrial read fraction is observed.
Combinatorial Indexing (sciATAC/UDA-seq)
Principle: Cellular indexing occurs through multiple rounds of barcoding without physical cell isolation, enabling massive parallel processing by leveraging combinatorial barcode combinations [17] [16]. This method uses successive biochemical reactions in solution to label chromatin fragments from individual cells with unique barcode combinations.
Step-by-Step Protocol:
Nuclei Preparation and Fixation
- Isolate nuclei as described in section 3.1, step 1.
- Fix nuclei with 0.1-0.5% formaldehyde for 5-10 minutes at room temperature, then quench with 1.25 M glycine.
- Permeabilize nuclei with 0.1-0.5% Triton X-100 for 10 minutes on ice.
First Round Barcoding (Pre-Indexing)
- Distribute fixed nuclei across a 96-well plate (100-1,000 nuclei per well) containing unique well-specific Tn5 transposase complexes with pre-loaded barcoded adapters [16].
- Perform tagmentation reaction (37°C for 30-60 minutes) with gentle shaking.
- Stop reaction with SDS (0.1-0.5% final concentration) and EDTA (10-20 mM).
- Pool all reactions and wash nuclei twice with PBS + 0.1% BSA to remove excess barcodes and reaction components.
Second Round Barcoding (Post-Indexing)
- For UDA-seq: Distribute pre-indexed nuclei into a 384-well plate containing unique PCR primers for second barcoding [17].
- Alternatively, use nanowell chips for massive parallel processing (sciATAC-v2) [16].
- Perform limited-cycle PCR (5-8 cycles) to incorporate second barcode set.
- Pool reactions and purify with SPRIselect beads (0.8x ratio).
Library Amplification and Sequencing
- Perform final library amplification (8-12 cycles) with P5 and P7 primers.
- Size-select libraries (200-800 bp) using double-sided SPRI bead cleanup (0.4x and 1.2x ratios).
- Sequence on Illumina platforms with custom read configuration to accommodate dual indexing.
Critical Steps for Success:
- Optimize nuclei concentration per well to minimize multiplets while maximizing cell recovery.
- Implement stringent washing after first-round barcoding to reduce index hopping [16].
- Use unique dual index combinations to minimize sample cross-talk.
Figure 2: Combinatorial Indexing Workflow with Dual Barcoding
Nano-well Platform (ICELL8 System)
Principle: Individual cells are dispensed into nanoliter-scale wells using automated liquid handling, enabling targeted processing with minimal reagent consumption [16]. This approach combines the precision of single-cell isolation with the flexibility of plate-based protocols.
Step-by-Step Protocol:
Chip Preparation and Priming
- Load the ICELL8 5184-nanowell chip with unique PCR primer pairs in each well using automated dispensing.
- Prime the system with cell suspension buffer and verify proper fluidics function.
Cell Sorting and Dispensing
- Prepare nuclei suspension at optimal concentration (100-500 cells/μL) with viability >80%.
- Use the integrated imager to identify wells containing single nuclei, excluding empty wells and multiplets.
- Export coordinates of single-cell wells for targeted processing.
In-well Tagmentation and Lysis
- Dispense lysis/tagmentation master mix (Tn5 transposase, MgClâ‚‚, detergent) to each selected well.
- Incubate chip at 37°C for 30-60 minutes for simultaneous cell lysis and chromatin tagmentation.
- Stop reaction by adding SDS-containing buffer (0.1-0.2% final concentration).
Library Construction and Amplification
- Add PCR master mix containing barcoded primers to each well.
- Perform thermal cycling (72°C for 5 min, 98°C for 30 s, then 12-18 cycles of 98°C for 10 s, 63°C for 30 s, 72°C for 1 min).
- Pool reactions from all wells and purify using SPRIselect beads (0.8x ratio).
- Perform optional additional amplification if library yield is low.
Quality Control and Sequencing
- Assess library quality using High Sensitivity DNA chips.
- Quantify by qPCR and sequence on appropriate Illumina platform.
Critical Steps for Success:
- Optimize cell concentration to maximize single-cell occupancy while minimizing empty wells.
- Include control wells without cells to assess background contamination.
- Use high-precision dispensers to ensure reagent delivery to all active wells.
The Scientist's Toolkit: Essential Research Reagent Solutions
Successful scATAC-seq experiments require careful selection of reagents and materials tailored to each technological platform. The following table summarizes essential solutions and their applications.
Table 3: Essential Research Reagent Solutions for scATAC-seq Workflows
| Reagent/Material | Function | Example Formulation | Platform Compatibility | Technical Notes |
|---|---|---|---|---|
| Tn5 Transposase | Simultaneous fragmentation and adapter tagging of accessible DNA | Hyperactive Tn5 preloaded with mosaic ends [8] | All platforms | Commercial versions available (Illumina, Diagenode) or custom production |
| Nuclei Isolation Buffer | Cell lysis while preserving nuclear integrity | 10 mM Tris-HCl, 10 mM NaCl, 3 mM MgClâ‚‚, 0.1% Tween-20, 0.1% NP-40, 0.01% Digitonin, 1% BSA [8] | All platforms | Titrate digitonin concentration for different cell types |
| Barcoded Adapters | Sample multiplexing and single-cell indexing | Unique dual indexes (UDIs) with i5 and i7 combinations [17] | Combinatorial indexing, Nano-well | Design barcodes with sufficient sequence diversity to minimize index hopping |
| Formaldehyde Fixative | Sample preservation for batch processing | 0.1-0.5% formaldehyde in PBS [13] | All platforms (especially for stored samples) | Higher concentrations (>1%) may reduce data quality; always include quenching step |
| Microfluidic Chips | Single-cell partitioning and barcoding | 10x Genomics Chromium chips (various throughput options) [15] | Microfluidics | Different chips available for varying cell recovery targets |
| Nano-well Chips | High-density single-cell processing | ICELL8 5184-well chips with pre-printed primers [16] | Nano-well platforms | Enables targeted processing of specific wells containing cells |
| SPRIselect Beads | Size selection and library cleanup | Paramagnetic beads with precise size cutoffs | All platforms | Ratio optimization critical for removing primer dimers and large fragments |
| Partitioning Oil | Stable droplet formation for microfluidics | Fluorinated oil with surfactants (EA Oil, Droplet Generation Oil) | Microfluidics | Must be compatible with biological samples and downstream processing |
| Apilimod | Apilimod, CAS:541550-19-0, MF:C23H26N6O2, MW:418.5 g/mol | Chemical Reagent | Bench Chemicals | |
| Apilimod Mesylate | Apilimod Mesylate, CAS:870087-36-8, MF:C25H34N6O8S2, MW:610.7 g/mol | Chemical Reagent | Bench Chemicals |
Visualization of Core Workflow Relationships
Figure 3: Integrated scATAC-seq Experimental Workflow from Sample to Data
Single-cell Assay for Transposase-Accessible Chromatin using sequencing (scATAC-seq) has emerged as a powerful technology for decoding cellular heterogeneity and identity by profiling genome-wide chromatin accessibility at single-cell resolution. This capability enables researchers to identify distinct cell types, uncover regulatory trajectories, and discover novel biological insights within complex tissues. Unlike bulk ATAC-seq, which provides an averaged profile, scATAC-seq resolves the epigenetic landscape of individual cells, capturing the regulatory diversity that underpins cellular function and dysfunction. The application of this technology spans from basic developmental biology to clinical drug discovery, where understanding cell-type-specific regulatory logic is paramount [14] [21].
Recent technological innovations have significantly expanded the scope of scATAC-seq applications. These advances now enable the analysis of challenging sample types, including archived clinical specimens, and allow for the integration of multi-omic measurements. Consequently, scATAC-seq has become an indispensable tool for constructing comprehensive catalogs of cell states and their corresponding cis-regulatory elements, providing a foundation for mechanistic studies of gene regulation in health and disease [1] [22].
Key Applications and Biological Insights
scATAC-seq has been successfully applied across diverse biological contexts to unravel cellular heterogeneity and define identity. The following table summarizes key applications and the primary insights gained from these studies.
Table 1: Key Applications of scATAC-seq in Decoding Cellular Heterogeneity
| Biological System | Key Application | Major Finding | Reference |
|---|---|---|---|
| Hematopoietic Hierarchy | Mapping regulatory networks across 13 human blood cell types | Distal element accessibility provides superior cell-type classification compared to mRNA expression or promoter accessibility | [23] |
| Follicular Lymphoma & DLBCL | Retrospective analysis of tumor transformation in archived FFPE samples | Identification of patient-specific epigenetic drivers of tumor relapse and transformation | [1] |
| B-cell Acute Lymphoblastic Leukemia (B-ALL) | Linking developmental states to drug sensitivity | Asparaginase resistance linked to pre-pro-B-like cells; sensitivity associated with pro-B-like populations | [24] |
| Lung Cancer | Joint profiling of chromatin accessibility and gene expression (Parallel-seq) | Mapping copy-number variations, regulatory events, and enhancer mutations in tumor progression | [22] |
| Tumor Microenvironment | Comparing chromatin accessibility in tumor center vs. invasive edge | Revelation of distinct regulatory trajectories and epigenetic mechanisms between spatial regions | [1] |
Hematopoiesis and Cancer
In hematopoiesis, scATAC-seq has revealed that chromatin accessibility at distal regulatory elements is a more precise indicator of cell identity than mRNA expression levels. This principle enabled the development of "enhancer cytometry," a computational approach for deconvoluting complex cellular mixtures, such as hematopoietic stem and progenitor cells (HSPCs), into their constituent subtypes based solely on their chromatin accessibility signatures [23]. In cancer research, scATAC-seq applied to clinical Folin-Formalin-Fixed Paraffin-Embedded (FFPE) samples has identified distinct epigenetic trajectories between the center and invasive edge of lung tumors, revealing spatially defined regulatory programs that may drive metastasis [1].
Drug Discovery and Development
In drug development, scATAC-seq provides a critical link between cellular identity and therapeutic response. A seminal study in B-cell Acute Lymphoblastic Leukemia (B-ALL) demonstrated that a leukemia's developmental arrest stage, as defined by chromatin landscapes, strongly correlates with its sensitivity to the chemotherapeutic agent asparaginase. Resistance was predominantly observed in pre-pro-B-like cells, leading to the identification of BCL2 as a target whose inhibition can potentiate asparaginase efficacy [24]. This systems pharmacology framework showcases how scATAC-seq can guide the design of rational combination therapies.
Experimental Protocols
scFFPE-ATAC for Archival Clinical Samples
The scFFPE-ATAC protocol enables high-throughput chromatin accessibility profiling from FFPE tissues, which represent the vast majority of clinically archived samples [1].
Key Steps:
- Nuclei Isolation from FFPE Tissue: Devax and rehydrate FFPE tissue sections. Perform proteinase K digestion to reverse cross-links and isolate nuclei.
- Density Gradient Centrifugation: Purify nuclei using an optimized density gradient (25%-36%-48%) to separate intact nuclei (found between 25%-36% interface) from cellular debris (found between 36%-48% interface).
- Tagmentation with FFPE-adapted Tn5: Use a specially designed FFPE-Tn5 transposase to fragment accessible chromatin.
- DNA Damage Rescue & Barcoding: Employ T7 promoter-mediated DNA damage rescue and in vitro transcription. Incorporate ultra-high-throughput DNA barcoding (>56 million barcodes per run).
- Library Preparation and Sequencing: Construct sequencing libraries and perform high-throughput sequencing.
Sample Preservation for scATAC-seq
A robust protocol for preserving cells for scATAC-seq enables flexible experimental design. The following method using mild formaldehyde fixation yields data quality comparable to fresh samples [13].
Key Steps:
- Cell Fixation: Treat cells with a low concentration of formaldehyde (0.1%) for a short duration.
- Cryopreservation: Preserve fixed cells in cryoprotectant (e.g., DMSO) and store at -80°C or in liquid nitrogen.
- Thawing and Washing: Thaw cells rapidly and wash thoroughly to remove fixative and cryoprotectant.
- Standard scATAC-seq: Proceed with standard single-cell ATAC-seq workflows, such as the 10x Genomics Chromium platform.
Diagram 1: scFFPE-ATAC workflow for archival samples.
Computational Analysis of scATAC-seq Data
The analysis of scATAC-seq data presents unique computational challenges due to its high dimensionality and inherent sparsity, where only 1-10% of peaks are detected in a single cell [25]. A standardized workflow is essential for transforming raw sequencing data into biological insights.
General Workflow:
- Raw Data Processing: Demultiplex sequencing data, trim adapters, and align reads to a reference genome using tools like
bowtie2orbwa. - Quality Control (QC): Filter low-quality cells based on metrics including:
- Number of unique nuclear fragments
- Fraction of reads in peaks (FRIP)
- Transcription Start Site (TSS) enrichment score
- Feature Matrix Construction: Generate a cell-by-feature matrix. Strategies include using pre-defined peaks, uniform genomic bins, or sequence-based features (e.g., k-mers, motifs).
- Dimensionality Reduction and Clustering: Reduce data dimensionality using methods like Latent Semantic Indexing (LSI) or topic modeling (e.g., cisTopic), followed by graph-based clustering (e.g., Louvain) to identify cell populations.
- Downstream Analysis: Identify differentially accessible regions (DARs), perform motif enrichment to infer regulator transcription factors, and integrate with scRNA-seq data to link regulatory elements to target genes.
Benchmarking studies have identified several high-performing methods for scATAC-seq analysis, including SnapATAC, Cusanovich2018, and cisTopic, which robustly separate cell populations across diverse datasets [25]. SnapATAC, in particular, segments the genome into uniform bins, creates a cell-by-bin matrix, and uses the Nyström method for scalable dimensionality reduction, enabling the analysis of over one million cells [14].
Diagram 2: scATAC-seq data analysis pipeline.
The Scientist's Toolkit
Table 2: Essential Research Reagents and Tools for scATAC-seq Research
| Reagent / Tool | Function / Application | Key Feature |
|---|---|---|
| FFPE-adapted Tn5 Transposase | Tagmentation of accessible chromatin in FFPE-derived nuclei | Engineered for efficient fragmentation of damaged DNA from archived samples [1] |
| SnapATAC Software | Comprehensive computational analysis of scATAC-seq data | Uses bin-based approach and Nyström method for high scalability (>1M cells) [14] [25] |
| Low-Formaldehyde Fixation Protocol | Sample preservation for batch-effect-free experiments | 0.1% formaldehyde fixation maintains chromatin architecture and data quality [13] |
| CIBERSORTx Algorithm | In silico deconvolution of bulk data using single-cell references | Enables "enhancer cytometry" for cell type enumeration from complex mixtures [23] [24] |
| NetBID2 Algorithm | Inference of protein activity from scRNA-seq data | Reverse-engineers signaling and regulatory network circuitry from expression data [24] |
| Parallel-seq Technology | Joint profiling of chromatin accessibility and gene expression | Enables cell-type-specific linking of regulatory elements to target genes [22] |
| ZM 449829 | ZM 449829, MF:C13H10O, MW:182.22 g/mol | Chemical Reagent |
| HMB-Val-Ser-Leu-VE | HMB-Val-Ser-Leu-VE, MF:C26H39N3O7, MW:505.6 g/mol | Chemical Reagent |
From Bench to Bedside: scATAC-seq Methods and Transformative Applications
Single-cell Assay for Transposase-Accessible Chromatin using sequencing (scATAC-seq) has emerged as a powerful technique for decoding the epigenetic landscape of individual cells, revealing cell-to-cell heterogeneity in gene regulation that is masked in bulk measurements. The core principle of ATAC-seq involves using a hyperactive Tn5 transposase to simultaneously fragment and tag accessible regions of chromatin with sequencing adapters, providing a genome-wide map of open chromatin regions indicative of active regulatory elements [8]. Unlike antibody-based epigenetic methods that require a priori knowledge of specific epigenetic marks, ATAC-seq offers an unbiased profiling of chromatin accessibility, capturing the locations of promoters, enhancers, insulators, and other regulatory elements [8]. The development of single-cell ATAC-seq platforms has been transformative for understanding cellular heterogeneity in complex tissues, developmental biology, and disease states, enabling researchers to identify rare cell populations and characterize their unique regulatory programs.
The three major technological platforms discussed in this application note—10x Genomics, ICELL8, and Combinatorial Indexing—represent distinct approaches to scaling chromatin accessibility profiling to single-cell resolution. Each platform employs different strategies for cell isolation, barcoding, and library preparation, resulting in unique trade-offs in throughput, cost, data quality, and experimental flexibility. Understanding the technical foundations and performance characteristics of these platforms is essential for selecting the appropriate methodology for specific research applications in chromatin accessibility profiling and drug development.
Platform Comparison and Selection Guide
Technical Specifications and Performance Metrics
Table 1: Comprehensive Comparison of Single-Cell ATAC-Seq Platforms
| Feature | 10x Genomics Chromium | ICELL8 System | Combinatorial Indexing |
|---|---|---|---|
| Throughput (cells per run) | 500 - 10,000+ cells [26] | Up to ~1,800 cells per chip [27] | Up to 200,000 nuclei [28] |
| Cell Recovery Efficiency | High | Moderate (35% single-cell loading rate) [27] | Variable, depends on indexing efficiency |
| Cost per Cell | Higher | ~$0.81 per cell [27] | Lower (cost-effective for large scale) [29] |
| Library Complexity | 5.8×10³ fragments per GM12878 cell (microfluidic benchmark) [27] | 14.3×10³ fragments per human cell [27] | 2.5×10³ fragments per GM12878 cell [27] |
| Multiplexing Capacity | Limited without additional modifications | Limited | High (natural sample multiplexing) [29] [11] |
| Required Input Cells | As low as a few hundred cells [26] | Not specified | Flexible, suitable for large-scale experiments [29] |
| Hands-on Time | Moderate | 4-5 hours on-chip processing [27] | Extended due to multiple indexing steps |
| Data Quality Metrics | Optimized for low mitochondrial reads [26] | High fragment counts, TSS enrichment [27] | Good peak recovery, lower fragments per cell [27] |
| Special Features | Integrated solution with optimized buffers [26] | Imaging-based cell selection, multi-omic capability [27] | No specialized equipment required, works with fixed samples [29] |
Platform Selection Guidelines
Choosing the appropriate scATAC-seq platform requires careful consideration of experimental goals, sample characteristics, and resource constraints. The 10x Genomics Chromium platform provides an integrated, commercially optimized solution ideal for standard sample types where consistent performance and high data quality are priorities. Its demonstrated protocol for nuclei isolation ensures low mitochondrial contamination, a common challenge in ATAC-seq datasets [26]. This platform is particularly well-suited for clinical researchers and core facilities requiring reproducible, standardized workflows with robust technical support.
The ICELL8 System offers unique advantages for specialized applications requiring visual verification of cell viability and morphology. Its fluorescence imaging capability enables selective processing of only live, single cells, potentially reducing sequencing costs on empty wells or compromised cells [27]. The nanoliter-scale reaction volumes significantly reduce reagent consumption and per-cell costs, making this platform attractive for pilot studies or resource-limited settings. The system's extensibility for multi-omic assays also positions it well for future experimental expansion.
Combinatorial Indexing approaches (including sciATAC-seq and txci-ATAC-seq) excel in large-scale studies where sample multiplexing and cost-effectiveness are paramount. The ability to profile up to 200,000 nuclei across multiple samples in a single experiment makes this platform ideal for comprehensive atlas-building projects, dose-response studies, and time-course experiments [28] [11]. The compatibility with fixed samples and lack of requirement for specialized microfluidic equipment lower the barrier to entry for laboratories with standard molecular biology infrastructure.
Experimental Workflows and Protocols
10x Genomics Chromium Workflow
The 10x Genomics workflow begins with critical sample preparation steps. Nuclei isolation is performed using an optimized demonstrated protocol (CG000169) that employs a specific combination of lysis detergents to ensure nuclear membrane permeabilization while keeping mitochondria intact, resulting in significantly reduced mitochondrial reads [26]. The isolated nuclei are resuspended in a Tris-based Nuclei Buffer with optimized magnesium concentration that is critical for subsequent transposition and barcoding steps [26]. The single-cell ATAC library preparation then occurs within Gel Bead-in-Emulsions (GEMs) where transposition and barcoding happen simultaneously. Following GEM generation and barcoding, the libraries are prepared and sequenced with recommended depth of 25,000 read pairs per nucleus [30].
ICELL8 Single-Cell System Workflow
The ICELL8 workflow incorporates unique imaging and nanodispensing steps that differentiate it from other platforms. Cells are first stained with Hoechst 33342 and propidium iodide to distinguish live/dead status, then loaded into 5,184-nanowell chips at approximately one cell per well under Poisson statistics [27] [31]. A critical differentiator is the automated fluorescence imaging step that identifies wells containing single live cells, enabling selective processing only of high-quality samples and reducing reagent waste [27]. Transposition reagents are dispensed in 40 nL volumes using the MultiSample NanoDispenser, followed by on-chip indexing with custom i5 and i7 primers [31]. The protocol includes an EDTA quenching step and on-chip PCR amplification before library collection, purification, and sequencing. This imaging-based approach provides visual confirmation of cell integrity before processing, potentially increasing data quality from selected cells.
Combinatorial Indexing Platform (sciPlex-ATAC-seq)
Combinatorial indexing approaches, including sciATAC-seq and the more recent txci-ATAC-seq, employ a fundamentally different strategy based on sequential barcoding rather than physical cell separation. The txci-ATAC-seq protocol combines Tn5-based pre-indexing with 10X Chromium-based microfluidic barcoding, enabling profiling of up to 200,000 nuclei across multiple samples in a single emulsion reaction [28]. In the sciPlex-ATAC-seq variant, permeabilized nuclei from different samples are first labeled with unique unmodified DNA oligos (hash labels) that serve as sample-specific nuclear labels [11]. The protocol then proceeds with a two-level indexing approach where nuclei undergo an initial round of barcoding during tagmentation, followed by pooling and redistribution for a second round of barcoding during PCR amplification [29] [11]. This dual-barcoding strategy creates unique combinatorial indexes that allow bioinformatic demultiplexing of individual cells after sequencing. The method is particularly advantageous for large-scale perturbation studies, as it enables virtually unlimited sample multiplexing while minimizing batch effects and technical variability [11].
Research Reagent Solutions and Essential Materials
Key Reagents and Their Applications
Table 2: Essential Research Reagents for Single-Cell ATAC-Seq Workflows
| Reagent Category | Specific Examples | Function in Protocol | Platform Compatibility |
|---|---|---|---|
| Transposase Enzymes | Hyperactive Tn5 Transposase | Simultaneous fragmentation and adapter tagging of accessible DNA [8] | Universal |
| Cell Staining Reagents | Hoechst 33342, Propidium Iodide | Live/dead cell discrimination and nuclear visualization [27] [31] | ICELL8 |
| Nuclei Isolation Buffers | Omni Resuspension Buffer (RSB), RSB Lysis Buffer [28] | Cell lysis while preserving nuclear integrity and membrane permeabilization | 10x Genomics, Combinatorial Indexing |
| Barcoding Oligos | Tn5ME-A, Tn5ME-B oligos [28], Hash oligos [11] | Sample multiplexing and single-cell barcoding | Combinatorial Indexing, sciPlex-ATAC-seq |
| Library Amplification | NEBNext High-Fidelity PCR Master Mix [11] | Amplification of tagmented fragments while maintaining complexity | Universal |
| Solid Support | 10x Barcoded Gel Beads, ICELL8 Chips [31] | Physical partitioning and barcode delivery | Platform-specific |
| Purification Kits | MinElute PCR Purification Columns, AMPure XP Beads [31] | Library cleanup and size selection | Universal |
Platform-Specific Buffer Formulations
The 10x Genomics platform relies on specifically formulated buffer systems to optimize assay performance. The Nuclei Buffer provided with the Chromium Single Cell ATAC Solution is a Tris-based buffer with optimized magnesium concentration critical for the Transposition and Barcoding steps [26]. Suspension of nuclei in alternative buffers may compromise assay performance, highlighting the importance of using compatible reagents.
Combinatorial indexing protocols often employ customized buffer formulations. The txci-ATAC-seq protocol utilizes an Omni Resuspension Buffer (RSB) containing Tris-HCl (pH 7.5), NaCl, and MgCl2 for nuclei resuspension, along with specifically formulated RSB Lysis Buffer containing Igepal-CA630, digitonin, and Tween-20 for controlled membrane permeabilization [28]. The protocol also includes a specialized Freezing Buffer working solution for nuclei cryopreservation, containing Tris-HCl, magnesium acetate, glycerol, EDTA, DTT, and protease inhibitors [28].
Applications in Biomedical Research and Drug Development
Chromatin Accessibility in Disease Modeling
Single-cell ATAC-seq has enabled significant advances in understanding disease mechanisms at cellular resolution. In cancer research, profiling chromatin accessibility in mouse lung adenocarcinoma models has revealed tumor-specific regulatory programs and cellular heterogeneity [29]. The technology has proven particularly valuable for mapping the epigenetic landscape of human tissues, as demonstrated by integrated single-nucleus ATAC and RNA sequencing of adult human kidney, which redefined cellular heterogeneity in the proximal tubule and thick ascending limb [32]. These approaches can identify subtle subpopulations with potential functional importance, such as a subpopulation of proximal tubule epithelial cells showing increased VCAM1 expression that may represent a transition state associated with kidney pathology [32].
In immunology and inflammation research, scATAC-seq has been deployed to profile peripheral blood mononuclear cells (PBMCs), successfully distinguishing hematopoietic cell types based on epigenetic signatures alone [27]. This application demonstrated differential accessibility of transcription factor binding motifs, including PU.1 in monocytes and B cells, C/EBPα exclusively in monocytes, and RUNX1 in T lymphocytes [27]. Such cell-type-specific epigenetic signatures provide insights into the regulatory programs underlying immune cell identity and function.
Chemical Epigenomics and Drug Screening
The multiplexing capabilities of combinatorial indexing approaches have opened new avenues for high-throughput chemical epigenomics. sciPlex-ATAC-seq has been applied to resolve chromatin profiles in multi-compound chemical perturbation experiments, treating human lung adenocarcinoma-derived cells (A549) with various compounds including Dexamethasone, Vorinostat, Nutlin-3A, and BMS-345541 across a range of concentrations [11]. This approach successfully identified drug-specific and dose-dependent changes in the chromatin landscape, with different compounds inducing distinct epigenetic states [11]. For instance, BMS-345541 treatment caused an abrupt divergence from vehicle-treated states at higher concentrations, while Dexamethasone induced more binary and stable chromatin changes even at low concentrations [11].
The ability to profile chromatin accessibility responses to epigenetic drugs across many conditions in a single experiment provides powerful insights into their mechanisms of action. This is particularly valuable for understanding compounds that target enzymes with genome-wide regulatory roles, such as histone deacetylase inhibitors [11]. The technology also enables the identification of compound-altered distal regulatory sites predictive of dose-dependent effects on transcription, potentially revealing novel therapeutic targets and biomarkers of drug response.
Future Directions and Technical Innovations
Recent advancements in single-cell ATAC-seq technologies continue to expand their applications in biomedical research. The integration of chromatin accessibility with transcriptomic profiling in the same cells represents a powerful multi-omic approach for understanding the relationship between regulatory elements and gene expression [32]. The development of higher-throughput multiplexing methods, such as the nuclear hashing strategy in sciPlex-ATAC-seq that enables virtually unlimited sample multiplexing, is making large-scale perturbation studies increasingly accessible [11].
Emerging applications in drug development include the ability to conduct high-throughput chemical screens with chromatin accessibility as a readout, identify cell-type-specific responses to therapy, and understand the molecular determinants of therapeutic resistance [11]. The application of these technologies to patient-derived samples in clinical trials may help identify epigenetic biomarkers of treatment response and resistance mechanisms. As these methodologies continue to evolve, they promise to provide increasingly comprehensive views of epigenetic regulation in health and disease, ultimately informing the development of novel therapeutic strategies targeting the epigenome.
Cancer therapy resistance remains a formidable challenge in clinical oncology, primarily driven by profound intratumor heterogeneity (ITH) that enables adaptive survival under therapeutic pressure [33]. While traditionally focused on genetic diversity, contemporary research increasingly recognizes epigenetic regulation as a dominant force shaping cellular phenotypes and therapeutic responses [33]. Single-cell Assay for Transposase-Accessible Chromatin using sequencing (scATAC-seq) has emerged as a transformative technology that enables high-resolution dissection of epigenetic heterogeneity by mapping accessible chromatin regions at single-cell resolution [34]. This powerful approach identifies open chromatin regions linked to regulatory elements like enhancers, promoters, and transcription factor binding sites, which play critical roles in controlling cell identity and fate decisions in cancer progression [34].
The application of scATAC-seq in clinical contexts has been historically limited by dependence on fresh or frozen samples, excluding the vast biobanks of Formalin-Fixed Paraffin-Embedded (FFPE) specimens archived in pathology departments worldwide [1]. Recent technological breakthroughs, particularly the development of scFFPE-ATAC, have overcome this barrier by integrating an FFPE-adapted Tn5 transposase, ultra-high-throughput DNA barcoding (>56 million barcodes per run), T7 promoter-mediated DNA damage repair, and in vitro transcription [1]. This advancement enables retrospective epigenetic studies in long-term archived specimens, opening unprecedented opportunities to investigate tumor evolution, relapse, and resistance mechanisms across decades of patient samples with comprehensive clinical annotations [1].
Technical Foundations of Single-Cell ATAC-seq
Core Technological Principles
scATAC-seq leverages a hyperactive Tn5 transposase that simultaneously fragments accessible chromatin regions and ligates sequencing adapters, preferentially targeting nucleosome-free regions that represent active regulatory elements [2]. The resulting library of DNA fragments provides a genome-wide map of chromatin accessibility, revealing cell-type-specific epigenetic landscapes [2]. Unlike bulk ATAC-seq, which provides population-average profiles, scATAC-seq enables deconvolution of heterogeneous cell populations within complex tissues like tumors, capturing rare cell states that may drive resistance mechanisms [34].
Recent advances in microfluidic partitioning systems have revolutionized scATAC-seq applications by enabling parallel processing of tens of thousands of cells in a single experiment [34]. The 10× Genomics Chromium platform, for instance, utilizes gel bead-in-emulsion (GEM) technology to co-encapsulate single nuclei with barcoded beads, ensuring accurate molecular labeling of chromatin fragments from individual cells [34]. Each bead contains distinct barcode systems with unique cellular identifiers that enable precise attribution of sequencing fragments to their cell of origin, facilitating downstream computational analysis of heterogeneous cell populations [34].
Specialized Methodologies for Clinical Specimens
Analysis of FFPE samples presents unique challenges due to extensive DNA damage caused by formalin fixation and paraffin embedding [1]. Conventional scATAC-seq protocols fail to resolve cell-type-specific epigenetic profiles in FFPE tissues, necessitating specialized approaches like scFFPE-ATAC [1]. Critical modifications include:
- FFPE-adapted Tn5 transposase optimized for damaged DNA templates
- Enhanced nuclei isolation using refined density gradient centrifugation (25%-36%-48% layers) to separate pure nuclei from cellular debris
- T7 promoter-mediated DNA damage rescue to recover damaged DNA fragments
- In vitro transcription to amplify signal from limited input material [1]
This specialized workflow has been successfully applied to human lymph node samples archived for 8-12 years and lung cancer FFPE tissues, revealing distinct regulatory trajectories between tumor center and invasive edge regions [1]. The ability to profile chromatin accessibility in archival specimens enables retrospective studies linking epigenetic patterns with long-term clinical outcomes and treatment responses [1].
Experimental Protocols and Workflows
Comprehensive scATAC-seq Wet-Lab Protocol
Nuclei Isolation from Fresh Tissues
- Tissue Dissociation: Mince fresh tissue into 1-3 mm³ pieces in a sterile culture dish
- Enzymatic Digestion: Transfer tissue to 1 ml nuclear lysis buffer, incubate for 7 minutes on ice
- Collagenase Treatment: Add 250 μl of 20× Collagenase II, incubate at 37°C with 5% CO₂ for 60 minutes
- Filtration: Filter digested tissue through a 40 μm cell strainer
- Centrifugation: Spin at 500 × g at 4°C for 5 minutes, discard supernatant
- Resuspension: Resuspend nuclei in 5 ml cold experimental medium
- Quality Control: Quantify viable nuclei count using trypan blue exclusion
- Viability Staining: Perform live cell sorting using 7-AAD Viability Staining Solution [35]
Nuclei Isolation from FFPE Samples
- Sectioning: Cut 5-10 μm sections from FFPE blocks
- Deparaffinization: Treat with xylene or equivalent deparaffinization agents
- Rehydration: Process through graded alcohol series
- Proteinase K Digestion: Digest protein crosslinks to release nuclear material
- Density Gradient Centrifugation: Layer nuclei suspension over 25%-36%-48% density gradient
- Centrifugation: Spin at 800 × g for 20 minutes at 4°C
- Nuclei Collection: Collect purified nuclei from the interface between 25% and 36% layers [1]
Library Preparation (10× Genomics Platform)
- Nuclei Counting: Adjust nuclei concentration to 1,000-10,000 nuclei/μl
- GEM Generation: Combine nuclei suspension with barcoded gel beads and partitioning oil on Chromium Controller
- Tn5 Transposition: Incubate GEMs at 37°C for 60 minutes for tagmentation
- Barcoding: Fragment DNA in accessible regions while adding cellular barcodes
- Cleanup: Break emulsions, recover barcoded DNA fragments
- PCR Amplification: Amplify library fragments with sample-indexing primers
- Quality Control: Assess library quality using Agilent Bioanalyzer or TapeStation [34] [35]
Sequencing Recommendations
- Platform: Illumina NextSeq 500/550 or NovaSeq 6000
- Configuration: 150 bp paired-end reads
- Coverage: 25,000-50,000 read pairs per cell
- Minimum Cells: 10,000 cells per sample recommended [35]
Computational Analysis Pipeline
Primary Data Processing
Quality Control Metrics Quality assessment is critical for reliable scATAC-seq analysis. Key QC parameters include:
- Fragment Size Distribution: Visualize nucleosome banding pattern with clear peaks for nucleosome-free (<100 bp), mononucleosomal (~200 bp), di-nucleosomal (~400 bp), and tri-nucleosomal (~600 bp) fragments [2]
- TSS Enrichment Score: Calculate ratio of fragments centered at transcription start sites to flanking regions (minimum >5-8 recommended) [36]
- Total Fragments per Cell: Minimum 1,000 fragments per cell for inclusion
- Fraction Fragments in Peaks: >15-20% indicates good quality
- Blacklist Region Ratio: <1-5% of fragments in ENCODE blacklisted regions [36]
Downstream Analysis with Signac in R
Essential Research Reagents and Tools
Table 1: Essential Research Reagents for scATAC-seq Experiments
| Reagent Category | Specific Product | Application Purpose | Key Features |
|---|---|---|---|
| Nuclei Isolation | Collagenase II | Tissue dissociation | Enzymatic digestion of extracellular matrix |
| DNase I | DNA digestion | Removes contaminating genomic DNA [34] | |
| Bovine Serum Albumin (BSA) | Buffer additive | Reduces non-specific binding [34] | |
| Nonidet P40 Substitute | Cell lysis | Non-ionic detergent for nuclear membrane permeabilization [34] | |
| Library Preparation | 10× Genomics Chromium Single Cell ATAC Kit | scATAC-seq library construction | Microfluidic partitioning with cellular barcoding [35] |
| Nextera DNA Sample Preparation Kit | ATAC-seq library prep | Tn5 transposase with adapter sequences [37] | |
| SPRIselect Beads | Size selection and cleanup | Magnetic beads for fragment size selection | |
| Sequencing & QC | Bioanalyzer High Sensitivity DNA Kit | Library quality control | Microcapillary electrophoresis for size distribution [35] |
| Illumina Sequencing Reagents | High-throughput sequencing | Platform-specific chemistry for cluster generation and sequencing |
Table 2: Computational Tools for scATAC-seq Data Analysis
| Tool Name | Application | Key Features | Reference |
|---|---|---|---|
| CellRanger ATAC | Primary data processing | Demultiplexing, alignment, peak calling | [36] |
| Signac | Comprehensive analysis | R package for chromatin data integration with Seurat | [36] |
| ArchR | Scalable scATAC-seq analysis | Dimensional reduction, trajectory inference, integration | [38] |
| MACS2 | Peak calling | Identifies statistically significant accessible regions | [2] |
| FastQC | Quality control | Pre- and post-alignment sequence quality assessment | [2] |
Workflow Visualization
Diagram 1: Comprehensive scATAC-seq workflow from sample preparation to biological interpretation
Diagram 2: Mechanisms linking tumor heterogeneity to therapy resistance
Key Applications in Therapy Resistance Research
Case Study: Breast Cancer Endocrine Resistance
An integrated scRNA-seq and scATAC-seq analysis of over 80,000 breast tissue cells from normal, primary tumor, and tamoxifen-treated recurrent tumors revealed striking epigenetic plasticity underlying endocrine resistance [35]. Researchers identified nine distinct cancer cell states (CSs), including five primary tumor-specific and three recurrent tumor-specific states, each characterized by unique chromatin accessibility patterns [35]. The recurrent tumor-specific states exhibited accessible chromatin regions enriched for binding sites of pro-survival transcription factors and genes associated with treatment evasion pathways [35].
Functional validation demonstrated that BMP7, a key gene within the heterogeneity-guided core signature, plays an oncogenic role in tamoxifen-resistant breast cancer cells through modulation of MAPK signaling pathways [35]. Knockdown experiments using siRNA targeting BMP7 significantly reduced viability and restored drug sensitivity in tamoxifen-resistant cell lines, establishing a direct mechanistic link between the epigenetic state and phenotypic resistance [35].
Case Study: Cetuximab Resistance in HNSCC
Research on head and neck squamous cell carcinoma (HNSCC) resistance to cetuximab (EGFR inhibitor) employed scRNA-seq and scATAC-seq to track immediate adaptive responses during early treatment phases [37]. Analysis revealed global chromatin accessibility changes within just 5 days of therapy initiation, indicating early epigenetic reprogramming while tumor cells remained nominally sensitive to treatment [37]. Two key resistance pathways were identified:
- TFAP2A-mediated regulation of receptor tyrosine kinases, enabling bypass signaling through alternative growth factor receptors
- Epithelial-to-mesenchymal transition (EMT) programs, driven by accessibility changes at EMT transcription factor binding sites [37]
Notably, these epigenetic adaptations appeared heterogeneous and cell-type-specific, with different cellular subpopulations employing distinct resistance strategies within the same tumor [37]. Combination therapy with cetuximab and JQ1 (a bromodomain inhibitor that disrupts chromatin reading) demonstrated enhanced growth control compared to monotherapy, suggesting that targeting both signaling and epigenetic adaptations may overcome resistance [37].
Table 3: Key Findings from Therapy Resistance Studies Using scATAC-seq
| Cancer Type | Therapeutic Agent | Resistance Mechanisms Identified | Experimental Validation |
|---|---|---|---|
| Breast Cancer | Tamoxifen | BMP7 overexpression via accessible chromatin, MAPK pathway activation | siRNA knockdown restored sensitivity [35] |
| Head and Neck SCC | Cetuximab | TFAP2A-mediated RTK switching, EMT transition | Combination with JQ1 enhanced efficacy [37] |
| Follicular Lymphoma | Chemotherapy | Epigenetic plasticity between center and invasive edge | Identification of regulatory trajectories [1] |
| Lung Cancer | Multiple therapies | Spatial epigenetic heterogeneity | Distinct profiles in tumor center vs. invasive edge [1] |
Integration with Multi-Omics Approaches
The combination of scATAC-seq with other single-cell modalities provides unprecedented insights into the molecular circuitry of therapy resistance. Droplet-based multiomics workflows now enable simultaneous profiling of transcriptomes and chromatin accessibility from the same individual cells, establishing direct linkages between regulatory inputs and transcriptional outputs [34]. This integrated approach significantly enhances sensitivity and specificity in identifying rare resistant cell populations and elucidating their epigenetic regulatory mechanisms [34].
Computational methods for multiomics integration include:
- Weighted Nearest Neighbor (WNN) analysis implemented in Seurat to cluster cells based on both RNA expression and chromatin accessibility
- Chromatin velocity approaches that predict future epigenetic states based on current accessibility patterns
- Regulatory network inference linking transcription factor binding motifs in accessible regions to target gene expression
- Trajectory analysis reconstructing epigenetic evolution along resistance development pathways
These integrated analyses have revealed that non-genetic heterogeneity often precedes and facilitates the development of stable genetic resistance mechanisms, suggesting early epigenetic interventions might prevent or delay resistance acquisition [33]. Furthermore, studies have demonstrated that chromatin accessibility profiles can serve as more stable markers of cell identity than transcriptional profiles, which may fluctuate in response to microenvironmental signals [33].
Single-cell ATAC-seq has fundamentally transformed our ability to dissect the epigenetic dimensions of tumor heterogeneity and therapy resistance. The technology now enables researchers to move beyond descriptive heterogeneity mapping toward mechanistic understanding of how chromatin landscape evolution drives treatment failure. Future developments will likely focus on enhancing spatial resolution through integrated epigenomic-profiling technologies, improving computational imputation methods to reduce sequencing costs, and developing functional screening approaches that link chromatin accessibility to phenotypic resistance.
The growing availability of large-scale scATAC-seq datasets through resources like CellResDB, which currently comprises nearly 4.7 million cells from 1391 patient samples across 24 cancer types, will accelerate discovery of conserved resistance mechanisms across cancer types [39]. As these technologies become more accessible and analytical methods more sophisticated, single-cell epigenomics promises to uncover novel therapeutic vulnerabilities within heterogeneous tumors, ultimately enabling more durable and personalized cancer treatments.
Single-cell Assay for Transposase-Accessible Chromatin with sequencing (scATAC-seq) has emerged as a transformative technology for decoding the epigenetic landscape of complex diseases at unprecedented resolution. This method enables researchers to map accessible chromatin regions genome-wide, revealing cell-type-specific regulatory elements that control gene expression programs in neurological and autoimmune disorders. Unlike bulk ATAC-seq, which averages signals across heterogeneous cell populations, scATAC-seq captures the regulatory variation between individual cells, making it uniquely powerful for studying complex tissues like the brain and immune system where cellular heterogeneity drives disease pathogenesis [3].
The fundamental principle underlying scATAC-seq involves using a hyperactive Tn5 transposase enzyme that simultaneously cuts open chromatin regions and inserts sequencing adapters. These accessible regions represent active regulatory elements including promoters, enhancers, and insulators that shape cellular identity and function [2]. When applied to neurological and autoimmune disorders, scATAC-seq can identify disease-associated regulatory elements in specific cell types, revealing pathogenic mechanisms that remain invisible to other genomic approaches. The technology has been successfully applied to fresh, frozen, and archived clinical samples, including formalin-fixed paraffin-embedded (FFPE) tissues, enabling retrospective studies of valuable clinical cohorts [1] [13].
Key Methodologies and Protocols
Sample Preparation and Quality Control
Successful scATAC-seq begins with optimal sample preparation. For neurological tissues, gentle dissociation protocols are essential to preserve nuclear integrity while minimizing stress-induced artifacts. The following protocol outlines the key steps for processing post-mortem brain samples and peripheral blood mononuclear cells (PBMCs) relevant to autoimmune research:
- Nuclei Isolation: Gently homogenize tissue in chilled lysis buffer (e.g., 320 mM sucrose, 0.1 mM EDTA, 0.1% NP-40, 5 mM CaClâ‚‚, 3 mM Mg(Ac)â‚‚, 10 mM Tris-HCl pH 7.8) with Dounce homogenization. For FFPE samples, incorporate reverse crosslinking steps and optimize density gradient centrifugation (25%-36%-48%) to separate nuclei from debris [1].
- Quality Assessment: Verify nuclei integrity and count using trypan blue exclusion and hemocytometer or automated cell counters. Aim for >80% viability with minimal clumping.
- Transposition Reaction: Incubate 50,000-100,000 nuclei with pre-loaded Tn5 transposase (Illumina Nextera) at 37°C for 30 minutes. The Tn5 enzyme simultaneously fragments accessible DNA and adds adapter sequences [2].
- Library Preparation: Purify tagmented DNA and amplify with barcoded primers using limited-cycle PCR (typically 12-14 cycles). Incorporate dual index barcodes to enable sample multiplexing [13].
- Quality Control Metrics: Assess library quality using Fragment Analyzer or Bioanalyzer, looking for the characteristic nucleosomal ladder pattern. Verify concentration via qPCR methods optimized for ATAC-seq libraries [2].
For sample preservation, recent advances enable formaldehyde fixation (0.1% formaldehyde) combined with cryopreservation, which maintains chromatin architecture while allowing batch processing of samples. This approach yields FRiP (Fraction of Reads in Peaks) scores comparable to fresh samples (~35%) and preserves nucleosomal patterning [13].
Single-Cell Partitioning and Sequencing
Partitioning tagmented nuclei into single cells represents a critical step in scATAC-seq workflows. The following protocol details the droplet-based method using the 10x Genomics platform:
- Single-Cell Partitioning: Load transposed nuclei into a 10x Genomics Chip to create Gel Bead-in-Emulsions (GEMs). Each GEM contains a single nucleus, a barcoded gel bead, and ATAC-seq reagents.
- Barcoding: Inside each GEM, transposed fragments receive cell-specific barcodes and unique molecular identifiers (UMIs) during amplification.
- Library Sequencing: Pool barcoded libraries and sequence on Illumina platforms using paired-end sequencing. Aim for 50,000-100,000 reads per cell with a minimum of 25,000 fragments per cell for neurological samples [3].
Table 1: Quality Control Metrics for scATAC-seq Experiments
| Quality Metric | Target Value | Minimum Threshold | Assessment Method |
|---|---|---|---|
| Cells Retained | >10,000 cells | >5,000 cells | Cell Ranger ATAC output |
| Reads per Cell | 50,000-100,000 | >25,000 | Sequencing depth analysis |
| FRiP Score | >20% | >15% | Fraction of reads in peaks |
| TSS Enrichment | >10 | >7 | Signal at transcription start sites |
| Mitochondrial Reads | <20% | <30% | Alignment to mitochondrial genome |
| Nucleosomal Pattern | Clear periodicity | Visible mono-/di-nucleosomal peaks | Fragment size distribution |
Data Analysis Framework
Computational Processing Pipeline
The analysis of scATAC-seq data requires specialized computational tools to transform raw sequencing data into biological insights. The following workflow outlines the key processing steps:
- Pre-processing and Alignment: Demultiplex raw sequencing data using cellranger-atac or similar tools. Align reads to the reference genome (e.g., GRCh38) using optimized aligners like BWA-MEM or Bowtie2, achieving >80% unique mapping rates [2].
- Quality Filtering: Remove low-quality cells based on multiple parameters: nucleosomal signal <4, TSS enrichment >2, fragment counts between 2,000-30,000 per cell, and mitochondrial read percentage <20% [40].
- Peak Calling: Identify accessible chromatin regions using MACS2 or specialized scATAC-seq peak callers. Create a unified peak set across all cells for downstream analysis [2].
- Dimension Reduction and Clustering: Generate a cell-by-peak matrix and perform latent semantic indexing (LSI) for dimension reduction. Cluster cells using graph-based methods (e.g., Louvain algorithm) implemented in Seurat or Signac [40].
- Cell Type Annotation: Annotate clusters using marker genes from reference datasets. For neurological samples, key markers include: neuronal cells (SYT1, SLC17A7), astrocytes (GFAP, AQP4), microglia (CX3CR1, AIF1), and oligodendrocytes (MBP, MOG) [41] [42].
Advanced Analytical Approaches
Beyond basic processing, several advanced analytical methods extract maximum biological insight from scATAC-seq data:
- Differential Accessibility Analysis: Identify regulatory elements with significant accessibility changes between conditions using methods like logistic regression (as implemented in Signac) or negative binomial models (in Seurat). Account for technical covariates like sequencing depth and nucleosomal signal [40].
- Transcription Factor Motif Analysis: Scan accessible regions for enriched transcription factor binding motifs using HOMER or chromVAR. Calculate motif activity scores per cell to infer regulatory dynamics [3].
- Footprinting Analysis: Detect transcription factor binding events by identifying characteristic depletion patterns in accessibility data due to protein-DNA interactions. Use tools like TOBIAS or HINT-ATAC to infer bound TFs [2].
- Cis-regulatory Network Inference: Build co-accessibility networks to link distal enhancers with target promoters using Cicero or ArchR. Identify coordinated regulatory modules active in specific cell types [43].
- Multi-omics Integration: Jointly analyze scATAC-seq with scRNA-seq data from matched samples using WNN (Weighted Nearest Neighbors) in Seurat or coupled NMF. This enables simultaneous profiling of regulatory potential and transcriptional output [40].
Table 2: Key Analytical Tools for scATAC-seq Data
| Tool | Primary Function | Application in Disease Research |
|---|---|---|
| Signac | End-to-end scATAC-seq analysis | Identifying disease-associated accessible chromatin |
| MACS2 | Peak calling | Defining regulatory elements in specific cell types |
| chromVAR | TF motif deviation analysis | Inferring altered TF activity in disease states |
| Cicero | Co-accessibility networks | Connecting enhancers to target genes in disease pathways |
| ArchR | Comprehensive analysis platform | Integrative analysis of large-scale scATAC-seq datasets |
| Seurat WNN | Multi-omics integration | Linking regulatory changes to transcriptional outcomes |
Applications in Neurological Disorders
scATAC-seq has revealed critical insights into the epigenetic basis of neurological disorders by mapping cell-type-specific regulatory elements in both developing and adult brains. Integration of scATAC-seq with GWAS data has identified disease-critical fetal and adult brain cell types for 22 and 23 of 28 neurological traits respectively, highlighting the power of this approach for prioritizing cell types involved in disease pathogenesis [41].
In Alzheimer's disease, scATAC-seq of post-mortem brain tissues has revealed altered accessibility at genes involved in amyloid-beta processing and tau phosphorylation in specific neuronal subpopulations. Microglial cells show distinctive accessibility changes at inflammatory response genes, suggesting epigenetic mechanisms driving neuroinflammation. Similarly, in Parkinson's disease, scATAC-seq has identified regulatory elements controlling expression of SNCA and LRRK2 in dopaminergic neurons, providing mechanistic insights into disease-associated genetic variants [42].
For brain tumors, particularly glioblastoma (GBM), scATAC-seq has uncovered extensive heterogeneity in the regulatory landscape of cancer stem cells, revealing distinct epigenetic states associated with treatment resistance and invasion patterns. Analysis of GBM samples has identified regulatory elements driving stemness programs and revealed how chromosomal instability shapes transcriptional heterogeneity through epigenetic mechanisms [42]. Single-cell multi-omics analysis of carcinoma tissues has further demonstrated how tumor-specific transcription factors like TEAD family members control cancer-related signaling pathways in tumor cells [40].
Applications in Autoimmune Disorders
In autoimmune research, scATAC-seq has revolutionized our understanding of the epigenetic programs governing immune cell function and dysfunction. Studies of peripheral blood mononuclear cells (PBMCs) from patients with autoimmune conditions have revealed cell-type-specific regulatory elements that drive pathogenesis.
In systemic lupus erythematosus (SLE), scATAC-seq of patient PBMCs has identified enhanced accessibility at interferon-response genes in monocytes and B cells, revealing the epigenetic basis of the interferon signature characteristic of this disease. Rheumatoid arthritis research has uncovered altered regulatory landscapes in synovial tissue macrophages and fibroblasts, with increased accessibility at inflammatory cytokine genes and matrix metalloproteinases [44] [43].
For multiple sclerosis, scATAC-seq of central nervous system-infiltrating immune cells has revealed epigenetic programs driving T cell and B cell pathogenicity, including enhanced accessibility at genes involved in Th17 differentiation and B cell activation. The technology has also identified regulatory elements responsible for the generation of age-associated B cells (ABCs), a pathogenic B cell subset expanded in multiple autoimmune conditions [44].
The application of scATAC-seq to type 1 diabetes has mapped chromatin accessibility changes in pancreatic islet-infiltrating T cells and B cells, identifying enhancer elements that control expression of key autoimmune mediators. These findings provide insights into how genetic risk variants shape the autoimmune response through epigenetic mechanisms [44].
Integrated Multi-omics Approaches
The combination of scATAC-seq with other single-cell modalities provides a comprehensive view of the regulatory mechanisms driving neurological and autoimmune disorders. Single-cell multiome approaches that simultaneously profile chromatin accessibility and gene expression in the same cells are particularly powerful for linking regulatory elements to target genes.
Studies integrating scATAC-seq with scRNA-seq have constructed peak-gene link networks that reveal distinct cancer gene regulation and genetic risks. In neurological disorders, this approach has identified disease-critical non-coding variants that alter chromatin accessibility and subsequently influence gene expression in specific cell types [40]. For example, integration of GWAS summary statistics with scATAC-seq data from fetal and adult brains has identified disease-critical cell types for numerous brain disorders, with scATAC-seq proving more informative than scRNA-seq for many traits [41].
The development of single-cell nucleosome occupancy and methylome sequencing (scNOMe-seq) further expands multi-omics capabilities by simultaneously profiling chromatin accessibility, nucleosome positioning, and DNA methylation in individual cells. This approach provides unprecedented insights into the multilayer epigenetic regulation of disease processes [3].
The Scientist's Toolkit
Table 3: Essential Research Reagents and Solutions for scATAC-seq
| Reagent/Solution | Function | Application Notes |
|---|---|---|
| Tn5 Transposase | Fragments accessible DNA and adds adapters | Use pre-loaded enzymes for efficiency; titrate for optimal tagmentation |
| Nuclei Isolation Buffer | Extracts intact nuclei from tissues | Optimize for tissue type; include protease inhibitors for neurological tissues |
| Density Gradient Media | Purifies nuclei from debris | Critical for FFPE samples; use 25%-36%-48% gradient for optimal separation |
| Formaldehyde (0.1%) | Sample fixation | Preserves chromatin structure for batch processing; avoid higher concentrations |
| Cell Lysis Buffer | Releases nuclei from cells | Include non-ionic detergents; optimize concentration to prevent nuclear lysis |
| Library Amplification Mix | Amplifies tagmented fragments | Use high-fidelity polymerases; limit cycles to maintain complexity |
| Barcoded Primers | Adds cell and sample barcodes | Enable multiplexing; include UMIs for duplicate removal |
| Size Selection Beads | Purifies and size-selects libraries | Retain fragments <700bp; remove primer dimers and large fragments |
| ym-244769 | ym-244769, MF:C26H22FN3O3, MW:443.5 g/mol | Chemical Reagent |
| UK-371804 | UK-371804, MF:C14H16ClN5O4S, MW:385.8 g/mol | Chemical Reagent |
scATAC-seq has established itself as an essential technology for mapping disease-associated regulatory elements in neurological and autoimmune disorders. The protocols and applications outlined in this document provide a framework for implementing this powerful technology to uncover the epigenetic mechanisms driving disease pathogenesis. As the field advances, improvements in sample preservation, multiplexing, and multi-omics integration will further expand the utility of scATAC-seq in both basic research and translational applications, ultimately enabling the development of novel epigenetic therapies for these complex conditions.
The identification of robust epigenetic targets and biomarkers represents a frontier in oncology drug discovery, enabling a more precise understanding of disease mechanisms and therapeutic response. Chromatin accessibility, which governs how transcription factors interact with DNA to regulate gene expression, provides critical insights into cellular states in both health and disease [1]. The development of single-cell ATAC-seq (Assay for Transposase-Accessible Chromatin using sequencing) technologies now allows researchers to probe these epigenetic landscapes at unprecedented resolution, revealing cell-type-specific regulatory elements and heterogeneity within complex tissues that were previously obscured in bulk analyses [1] [13].
The application of these technologies to Formalin-Fixed Paraffin-Embedded (FFPE) samples is particularly transformative for the drug discovery pipeline. Given that over 99% of patient-derived samples are stored in FFPE format in clinical archives worldwide, representing an estimated 400 million to 1 billion specimens, methods that can leverage this resource for epigenetic studies have tremendous potential for retrospective biomarker discovery and validation [1]. The reversible nature of epigenetic modifications positions them as promising therapeutic targets, especially in cancer progression, treatment resistance, and metastasis where consistent mutation-driven mechanisms have been elusive [1] [45].
Key Applications in Drug Discovery and Development
Target Identification and Validation
Single-cell chromatin accessibility profiling enables the identification of disease-associated regulatory elements and transcription factor binding sites that drive pathological gene expression programs. By comparing epigenetic landscapes between diseased and healthy tissues at single-cell resolution, researchers can pinpoint cell-type-specific accessible regions that may serve as potential therapeutic targets [1] [46]. This approach is particularly valuable for understanding tumor heterogeneity and identifying master regulator transcription factors that govern cell state transitions in cancer progression [1].
The application of single-cell ATAC-seq to FFPE samples from patients who experienced tumor relapse or transformation has revealed patient-specific epigenetic regulators driving these processes, highlighting the potential for developing targeted therapies against these regulatory elements [1]. Furthermore, comparing chromatin accessibility profiles between epithelial cells from the tumor center and invasive edge in lung cancer samples has uncovered spatially distinct epigenetic regulators and developmental trajectories, suggesting novel targets for preventing cancer invasion and metastasis [1].
Biomarker Discovery for Patient Stratification and Treatment Response
Single-cell ATAC-seq facilitates the discovery of chromatin accessibility biomarkers that can predict disease progression, therapeutic response, and clinical outcomes. The technology enables identification of accessible chromatin regions that correlate with treatment resistance or sensitivity, providing opportunities for patient stratification [47] [46]. In clinical trials, these epigenetic biomarkers can inform decision-making by enabling more precise monitoring of drug response and disease progression beyond what is possible with transcriptomic or proteomic markers alone [47].
Analysis of paired primary and relapsed tumor samples using single-cell chromatin accessibility profiling has identified relapse-associated epigenetic dynamics, suggesting potential biomarkers for predicting and monitoring treatment resistance [1]. The technology also reveals cell-type-specific epigenetic signatures in the tumor microenvironment that may serve as biomarkers for immune activation or suppression, with implications for immunotherapy development [46].
Table 1: Key Epigenetic Biomarkers Identifiable via Single-Cell ATAC-seq
| Biomarker Category | Description | Drug Discovery Application |
|---|---|---|
| Cell-Type-Specific Accessible Regions | Chromatin regions specifically accessible in distinct cell subpopulations | Patient stratification based on tumor cell heterogeneity |
| Transcription Factor Footprints | Protected regions indicating transcription factor binding | Identification of activated regulatory pathways for targeted intervention |
| Differential Accessibility Peaks | Genomic regions with significantly different accessibility between conditions | Biomarkers of treatment response or resistance mechanisms |
| Nucleosome Positioning Patterns | Organization of nucleosomes in regulatory regions | Indicators of gene regulatory potential and cellular states |
Quantitative Performance of scFFPE-ATAC
The recently developed scFFPE-ATAC method enables high-throughput single-cell chromatin accessibility profiling from FFPE samples, overcoming previous limitations posed by extensive DNA damage from formalin fixation and paraffin embedding [1]. This technology integrates several innovative components: an FFPE-adapted Tn5 transposase, ultra-high-throughput DNA barcoding (>56 million barcodes per run), T7 promoter-mediated DNA damage rescue, and in vitro transcription [1].
When benchmarked on mouse FFPE spleen samples compared to fresh tissue, scFFPE-ATAC demonstrates robust performance in resolving single-cell chromatin landscapes from archived tissues [1]. The method has been successfully applied to human lymph node samples archived for 8-12 years and to lung cancer FFPE tissues, confirming its utility for real-world clinical specimens [1].
Table 2: Performance Metrics of scFFPE-ATAC Technology
| Performance Metric | Result | Significance |
|---|---|---|
| Cell Barcoding Capacity | >56 million barcodes per run | Enables large-scale studies without barcode duplication |
| Genome-wide Correlation | Pearson correlation = 0.94 (FFPE vs fresh) | High reproducibility compared to fresh tissue benchmarks |
| Sample Compatibility | FFPE punch cores and tissue sections | Flexible input requirements for clinical archives |
| Archival Time Application | Successful on 8-12 year archived samples | Enables longitudinal retrospective studies |
Experimental Protocols
scFFPE-ATAC Wet-Lab Protocol
Nuclei Isolation from FFPE Samples
Critical to the success of scFFPE-ATAC is the isolation of high-quality nuclei from FFPE samples. The harsh treatments involved in FFPE sample preparation, including formalin fixation and paraffin embedding, present significant challenges for nuclei isolation [1]. The following protocol has been optimized specifically for FFPE tissues:
Dewaxing and Rehydration: Cut FFPE sections at 5-50μm thickness. Devax in xylene (2 × 5 min), followed by rehydration in graded ethanol series (100%, 95%, 70%, 50%; 2 min each) and final rinse in PBS [1].
Proteinase K Digestion: Incubate tissues in proteinase K solution (1mg/mL in Tris-EDTA buffer with 0.5% SDS) at 56°C for 16 hours to reverse crosslinks and digest proteins [1].
Tissue Dissociation: Mechanically dissociate tissues using a Dounce homogenizer (15-20 strokes) until no visible tissue chunks remain. Filter through a 40μm cell strainer to remove large debris [1].
Density Gradient Centrifugation: Create a discontinuous density gradient with 25%, 36%, and 48% iodixanol layers. Carefully layer the nuclei suspension on top and centrifuge at 3,000 × g for 20 min at 4°C [1]. Note: Unlike fresh samples, FFPE nuclei migrate to the top layer (between 25%-36% interface) while debris collects at the bottom (36%-48% interface) [1].
Nuclei Collection and Counting: Collect the top nuclei-containing layer. Count using a hemocytometer with trypan blue exclusion. Adjust concentration to 1,000-1,200 nuclei/μL for single-cell partitioning [1].
Library Preparation and Sequencing
Tagmentation with FFPE-adapted Tn5: Combine nuclei suspension with FFPE-adapted Tn5 transposase in tagmentation buffer. Incubate at 37°C for 30 min with mild agitation [1].
DNA Damage Rescue: Add T7 promoter-mediated DNA damage rescue mix and incubate at 25°C for 15 min to repair formalin-induced DNA damage [1].
In Vitro Transcription: Perform in vitro transcription using T7 RNA polymerase to convert accessible chromatin fragments to RNA, enabling subsequent amplification [1].
Single-Cell Barcoding: Partition samples into nanoliter-scale droplets using a microfluidic device (10x Genomics Chromium) where each droplet contains a single nucleus and a barcoded bead [1].
Library Construction and Sequencing: Reverse transcribe, amplify, and construct sequencing libraries following the manufacturer's protocol. Sequence on Illumina platforms with recommended read parameters (28bp Read1, 90bp Read2, 10bp i7 index, 10bp i5 index) [1].
Sample Preservation Method for scATAC-seq
For prospective studies, a sample preservation strategy that maintains chromatin accessibility profiles is essential for coordinating complex or longitudinal studies. The following protocol enables preservation of samples for subsequent scATAC-seq analysis:
Mild Formaldehyde Fixation: Resuspend fresh cells in growth medium containing 0.1% formaldehyde. Incubate for 10 min at room temperature with gentle agitation [13].
Quenching: Add glycine to a final concentration of 0.125M and incubate for 5 min to quench crosslinking reaction [13].
Cryopreservation: Centrifuge cells at 500 × g for 5 min. Resuspend in freezing medium (90% FBS, 10% DMSO) at 1-5 million cells/mL. Transfer to cryovials and freeze using a controlled-rate freezer or isopropanol chamber at -80°C [13].
Post-Thaw Processing: Thaw cryopreserved cells rapidly in a 37°C water bath. Wash twice with PBS containing 1% BSA. Proceed with standard scATAC-seq protocol [13].
This preservation method maintains data quality metrics comparable to fresh samples, including signal-to-noise ratio and fragment distributions, with FRiP scores of approximately 35% (comparable to fresh samples) and ~70% peak overlap with fresh reference data [13].
Bioinformatic Analysis Pipeline
Data Preprocessing:
- Demultiplex raw sequencing data using cellranger-atac (10x Genomics) or equivalent tools
- Perform quality control: remove cells with <1,000 fragments, TSS enrichment score <4, or nucleosomal banding pattern absence [13]
Peak Calling and Matrix Generation:
- Call peaks using MACS2 with parameters: --nomodel --shift -100 --extsize 200
- Create cell-by-peak matrix counting fragment overlaps
Dimensionality Reduction and Clustering:
- Perform latent semantic indexing (LSI) on cell-by-peak matrix
- Cluster cells using graph-based methods (Louvain/Leiden algorithm)
- Visualize using UMAP or t-SNE
Differential Accessibility Analysis:
- Identify differentially accessible peaks between conditions using logistic regression or negative binomial models
- Perform transcription factor motif enrichment analysis in differential peaks
Integration with Other Omics Data:
- Integrate with scRNA-seq data using multimodal intersection analysis
- Link peaks to potential target genes based on correlation or regulatory potential
The Scientist's Toolkit: Essential Research Reagents
Table 3: Key Research Reagents for scFFPE-ATAC Experiments
| Reagent / Solution | Function | Application Notes |
|---|---|---|
| FFPE-adapted Tn5 Transposase | Enzyme that simultaneously fragments and tags accessible chromatin regions | Optimized for FFPE-derived DNA with reduced sequence bias [1] |
| T7 Promoter-mediated DNA Damage Rescue Mix | Repairs formalin-induced DNA damage to enable library amplification | Critical for recovering signal from highly fragmented FFPE DNA [1] |
| Custom Barcoded Beads | Provides cell-specific barcodes during partitioning | Enables multiplexing of samples; >56 million barcodes available [1] |
| Discontinuous Density Gradient Media | Separates intact nuclei from cellular debris in FFPE samples | Use 25%-36%-48% gradient; FFPE nuclei collect at 25%-36% interface [1] |
| Mild Formaldehyde (0.1%) | Stabilizes chromatin structure for preservation | Maintains data quality comparable to fresh samples when combined with cryopreservation [13] |
| Levemopamil hydrochloride | Levemopamil hydrochloride, CAS:101238-54-4, MF:C23H31ClN2, MW:371.0 g/mol | Chemical Reagent |
The integration of single-cell ATAC-seq technologies, particularly methods optimized for FFPE samples like scFFPE-ATAC, into the drug discovery pipeline represents a significant advancement for identifying and validating epigenetic targets and biomarkers. These approaches enable researchers to leverage the vast archives of clinical FFPE samples for retrospective studies, uncover regulatory mechanisms driving disease progression and treatment resistance, and develop biomarkers for patient stratification. As these technologies continue to evolve and become more accessible, they promise to accelerate the development of epigenetically-targeted therapies and personalized medicine approaches for cancer and other complex diseases.
Understanding the journey from a progenitor cell to a fully differentiated cell is a fundamental pursuit in developmental biology. Single-cell Assay for Transposase-Accessible Chromatin using sequencing (scATAC-seq) has emerged as a powerful tool for dissecting these lineage trajectories by providing a window into the epigenetic changes that govern cell fate decisions. Unlike transcriptomic methods that reveal the transcriptional output of a cell, scATAC-seq identifies accessible regions of chromatin, pinpointing active regulatory elements such as enhancers and promoters. This allows researchers to infer the regulatory logic and transcription factor dynamics that drive cellular differentiation [48]. The technology operates on the principle that actively regulatory DNA elements are generally 'accessible,' enabling the genome-wide profiling of these candidate regulatory regions in individual cells [48]. When applied to developing systems, scATAC-seq can reconstruct developmental trajectories, reveal branch points of cell fate decisions, and identify key regulatory factors, providing mechanistic insights into the process of lineage commitment [49].
Key Methodological Principles and Protocols
Core scATAC-seq Workflow
The foundational scATAC-seq protocol involves isolating nuclei from complex tissues, using a hyperactive Tn5 transposase to simultaneously fragment and tag accessible genomic regions with sequencing adapters, and then preparing sequencing libraries from the tagged fragments. The resulting data provides a snapshot of the accessible genome in each individual cell [3] [48]. Critical to the success of this assay is the quality of the input nuclei. Protocols must be optimized for different sample types, particularly when moving beyond fresh/frozen tissues to more challenging clinical specimens like Formalin-Fixed Paraffin-Embedded (FFPE) samples, which require specialized approaches for nuclei isolation and DNA damage repair [1].
Advanced Multi-Modal and Multi-Omic Approaches
To gain a more comprehensive view, methods that combine chromatin accessibility with other modalities are essential. Single-cell isoform RNA sequencing coupled with ATAC (ScISOr–ATAC) allows for the simultaneous measurement of gene expression, splicing, and chromatin accessibility in the same individual cells [50]. This multi-omics approach enables researchers to directly correlate changes in the epigenetic landscape with transcriptional outcomes and alternative splicing events, providing a powerful lens through which to study complex differentiation processes [50]. Similarly, the 10x Genomics Multiome kit provides a commercially available solution for co-assaying gene expression and chromatin accessibility within the same single cell.
Application Notes: Protocol for Lineage Tracing with scATAC-seq
Experimental Design and Sample Preparation
Objective: To reconstruct lineage trajectories and identify key regulatory drivers during hematopoietic stem cell (HSC) differentiation using scATAC-seq. Key Considerations: The choice of starting material is crucial. This protocol can be adapted for fresh primary cells, cryopreserved samples, or even FFPE tissues archived for over a decade, though each requires specific handling [1] [15]. For HSC studies, bone marrow or sorted hematopoietic stem and progenitor cells (HSPCs) are common starting materials. When working with FFPE samples, an optimized density gradient centrifugation (e.g., 25%/36%/48% layers) is critical for obtaining pure nuclei free from cellular debris [1].
Step-by-Step Wet-Lab Protocol
Part 1: Nuclei Isolation
- For Fresh/Frozen Tissues: (1) Mechanically dissociate tissue to a single-cell suspension. (2) Lyse cells in a cold, hypotonic buffer (e.g., 10 mM Tris-HCl, pH 7.4, 10 mM NaCl, 3 mM MgCl2, 0.1% IGEPAL CA-630) for 3-5 minutes on ice. (3) Pellet nuclei and resuspend in a buffer containing BSA. (4) Filter through a 40-μm flow-through cell strainer and count using a hemocytometer or automated cell counter [48] [15].
- For FFPE Tissues: (1) Deparaffinize and rehydrate tissue sections. (2) Perform antigen retrieval and proteinase K digestion. (3) Isolate nuclei via optimized density gradient centrifugation (25%/36%/48%) to separate pure nuclei (top layer) from debris (bottom layer) [1].
Part 2: Tagmentation and Library Preparation
- (5) Use the Tn5 transposase to tagment 10,000-50,000 nuclei in a tagmentation buffer. For FFPE samples, an FFPE-adapted Tn5 transposase is recommended [1]. Incubate at 37°C for 30 minutes.
- (6) Purify tagmented DNA.
- (7) Amplify the library via PCR (8-12 cycles) using barcoded primers to index samples for multiplexing. The number of PCR cycles should be minimized to reduce amplification bias [48] [15].
- (8) Clean up the amplified library using SPRI beads and quantify using fluorometric methods. Check fragment size distribution (typically a periodicity of ~200 bp reflecting nucleosomal patterning) on a Bioanalyzer or TapeStation.
Bioinformatic Analysis for Trajectory Inference
The computational analysis of scATAC-seq data involves several key steps to move from raw sequencing reads to a reconstructed lineage trajectory. The workflow can be visualized as follows:
Figure 1: Bioinformatic workflow for scATAC-seq trajectory analysis.
- Data Preprocessing: Process raw sequencing data with a pipeline like PUMATAC, which performs adapter trimming, barcode error correction, and alignment to a reference genome (e.g., using
bwa-mem2) [15]. Filter cells based on unique nuclear fragments and transcription start site (TSS) enrichment to remove low-quality cells and background noise [15]. - Peak Calling and Matrix Generation: Call chromatin accessibility peaks using MACS2 on aggregated data or per cluster to capture rare populations [15]. Create a cell-by-peak binary count matrix.
- Dimensionality Reduction and Clustering: Reduce dimensionality using latent semantic indexing (LSI) or topic modeling (cisTopic). Cluster cells to identify distinct groups using algorithms like Louvain or Leiden [15].
- Trajectory Inference: Infer trajectories using algorithms like Slingshot or TSCAN. Slingshot fits a principal curve through clusters of cells in a reduced-dimensional space, ordering cells along a "pseudotime" continuum that represents the progression of differentiation [49]. TSCAN takes a cluster-based approach, constructing a minimum spanning tree (MST) across cluster centroids to model transitions [49]. The resulting pseudotime values quantify the relative progression of each cell along the trajectory.
Integration with Lineage Tracing Technologies
To move beyond inferred trajectories and achieve definitive lineage tracing, scATAC-seq can be integrated with explicit lineage barcoding technologies. These methods introduce heritable, unique DNA barcodes into progenitor cells, allowing all progeny to be tracked through shared barcodes [51].
- CRISPR Barcodes: A CRISPR/Cas9 system is used to induce accumulative insertions or deletions (InDels) in a predefined genomic barcode locus, creating diverse, heritable marks for lineage reconstruction [51].
- Base Editor Barcodes: A recent advancement uses base editors to introduce informative single-nucleotide variants into a barcoding sequence at a high rate, enabling the construction of high-resolution cell phylogenetic trees [51].
- Integration Barcodes: Retroviral or transposon-based vectors are used to stably integrate random DNA barcode sequences into the genome of progenitor cells, providing a unique and inheritable identifier [51].
The experimental workflow for integrating these techniques is summarized below:
Figure 2: Workflow for integrating lineage barcoding with scATAC-seq.
Data Presentation and Analysis
Benchmarking scATAC-seq Methods
Selecting an appropriate scATAC-seq protocol is critical for data quality. A recent systematic benchmark of eight protocols provides quantitative data for informed decision-making [15]. The following table summarizes key performance metrics for selected methods using human PBMCs.
Table 1: Benchmarking of scATAC-seq Protocols Based on Key Performance Metrics [15]
| Method | Estimated Cells Post-Filtering | Median Fragments per Cell | TSS Enrichment Score | Key Notes and Applications |
|---|---|---|---|---|
| 10x Genomics v2 | 3,000 - 10,000 | 17,639 | 18.4 | High data quality; robust for heterogeneous tissues. |
| s3-ATAC | 1,000 - 5,000 | 4,805 | 11.7 | Lower sequencing library complexity. |
| HyDrop | 1,000 - 5,000 | 7,474 | 14.3 | Simpler instrumentation. |
| mtscATAC (with FACS) | 3,000 - 8,000 | ~20% more than non-FACS | >20 | FACS sorting significantly improves data quality by removing ambient chromatin. |
Table 2: Key Research Reagent Solutions for scATAC-seq and Lineage Tracing
| Item | Function/Description | Example/Note |
|---|---|---|
| Tn5 Transposase | Fragments and tags accessible chromatin. | FFPE-adapted Tn5 available for archived samples [1]. |
| Nuclei Isolation Kits | Release intact nuclei from tissue/cells. | Optimized buffers for cell lysis; critical step for data quality. |
| Lineage Barcoding Systems | Heritably mark progenitor cells for clonal tracking. | CRISPR barcodes, Base Editor barcodes, or Polylox systems [51]. |
| Multiome Kit (10x Genomics) | Co-profile gene expression and chromatin accessibility. | Enables direct correlation of regulome and transcriptome. |
| CellTrackVis | Web-based tool for visualizing cell trajectories and lineages. | Interactive analysis of cell motion and division [52]. |
| PUMATAC Pipeline | Universal preprocessing for scATAC-seq data. | Handles alignment and fragment file generation for multiple technologies [15]. |
The integration of scATAC-seq with lineage tracing technologies represents a powerful paradigm in developmental biology. By simultaneously mapping the epigenetic landscape and the definitive lineage history of individual cells, researchers can now move beyond correlation to establish causality in gene regulatory networks that control differentiation. This approach is poised to unravel the heterogeneity of stem cell populations, decode the molecular events driving lineage commitment, and illuminate the epigenetic dysregulations underlying developmental disorders and cancer. As protocols for challenging sample types like FFPE continue to improve and multi-omic methods become more accessible, these techniques will enable unprecedented retrospective and mechanistic studies, ultimately accelerating drug discovery and the development of targeted therapies.
Navigating Technical Challenges: Best Practices for Robust scATAC-seq Experiments
Addressing Inherent Data Sparsity and Technical Noise
Single-cell Assay for Transposase-Accessible Chromatin with sequencing (scATAC-seq) has revolutionized our ability to profile chromatin accessibility at single-cell resolution, enabling the identification of cell-type-specific regulatory elements in complex tissues [53] [48]. However, the intrinsic nature of scATAC-seq data presents significant computational challenges that must be addressed for meaningful biological interpretation. The data generated is characterized by extreme sparsity, with over 90% of entries in the count matrix being zeros, and high levels of technical noise stemming from the limited starting material and experimental artifacts [12] [6]. This sparsity arises because each diploid cell contains only two copies of each genomic locus, and the scATAC-seq protocol captures only a small fraction (typically 5-15%) of potentially accessible regions in each individual cell [14] [12]. Consequently, analyzing scATAC-seq data requires specialized computational approaches that can distinguish true biological signals from technical artifacts, enabling accurate identification of cell types, regulatory elements, and chromatin dynamics.
Quantitative Assessment of scATAC-seq Data Characteristics
Systematic Evaluation of Data Sparsity Across Platforms
Recent benchmarking studies have systematically evaluated the performance of different scATAC-seq technologies, revealing substantial differences in data quality and complexity. A comprehensive analysis of eight scATAC-seq methods across 47 experiments using human peripheral blood mononuclear cells (PBMCs) demonstrated significant variations in sequencing library complexity and tagmentation specificity, which directly impact downstream analyses [15]. The table below summarizes key quality metrics across major scATAC-seq technologies:
Table 1: Performance Metrics of scATAC-seq Technologies from PBMC Benchmarking Study
| Technology | Median Fragments per Cell | TSS Enrichment Score | Fraction of Reads in Peaks (FRiP) | Cell Recovery Rate |
|---|---|---|---|---|
| 10x Genomics v2 | 40,796* | 18.5 | 0.41 | 93% |
| 10x Multiome | 40,796* | 17.2 | 0.38 | 89% |
| HyDrop | 40,796* | 12.1 | 0.29 | 40% |
| s3-ATAC | 40,796* | 9.8 | 0.23 | 40% |
| Bio-Rad ddSEQ | 40,796* | 14.3 | 0.32 | 78% |
*Datasets were downsampled to 40,796 reads per cell for uniform comparison [15]
The data reveals that microfluidics-based methods (10x Genomics platforms) generally yield higher data quality with better signal-to-noise ratios, as evidenced by superior TSS enrichment scores and FRiP values. These metrics are crucial as they reflect the proportion of reads mapping to genuine open chromatin regions versus background noise [15] [21].
Molecular Origins of Technical Noise
The technical noise in scATAC-seq data originates from multiple sources throughout the experimental workflow. The tagmentation process itself exhibits sequence-specific biases, where Tn5 transposase demonstrates preferential integration at certain genomic contexts independent of chromatin accessibility [12]. Additionally, the nuclear extraction and tagmentation steps can cause loss of DNA material, leading to "dropout" events where truly accessible regions fail to be captured in specific cells [6]. Background noise also arises from ambient chromatin - DNA fragments released from damaged cells that become incorporated into droplets or wells containing other cells [15]. Studies have shown that fluorescence-activated cell sorting (FACS) of live cells before nuclei extraction can reduce such losses from 36% to below 6%, highlighting the significant impact of sample preparation on data quality [15].
Computational Frameworks for Sparsity Mitigation and Denoising
Normalization Strategies and Their Limitations
A fundamental challenge in scATAC-seq analysis is proper normalization to account for variations in sequencing depth between cells. The most widely used approach is term frequency-inverse document frequency (TF-IDF) normalization, implemented with different variations in popular tools such as Signac, ArchR, and Cell Ranger ATAC [12]. However, recent research has revealed theoretical limitations in TF-IDF for scATAC-seq data. As explained in a 2025 study, "Dividing by total count is a sound strategy for bulk sequencing... However, in scATAC-seq data, most data entries share the same value at either 0 or 1 (comprising of 90-95% of the data)" [12]. This extreme binarity means that TF transformation ironically amplifies, rather than diminishes, the influence of library size differences between cells.
Table 2: Comparison of scATAC-seq Analysis Tools and Their Normalization Approaches
| Tool | Platform | Primary Normalization | Imputation Method | Key Advantages |
|---|---|---|---|---|
| scOpen | R/Python | TF-IDF + Regularized NMF | Non-negative matrix factorization | Low memory footprint, improves clustering |
| SnapATAC | Python/R | Jaccard similarity + normalization | Nyström method | Scalable to >1 million cells |
| Signac | R | TF-IDF | Latent Semantic Analysis | Seurat integration, user-friendly |
| ArchR | R | TF-IDF | Iterative LSI | Gene score calculation, trajectory inference |
| cisTopic | R | TF-IDF + LDA | Latent Dirichlet Allocation | Probabilistic modeling, topic inference |
| SCALE | Python | Deep learning | Variational autoencoder | Feature learning, GPU acceleration |
Imputation Methods for Recovering Biological Signals
To address the critical issue of data sparsity, several specialized imputation methods have been developed to distinguish technical zeros from biologically inaccessible regions. scOpen utilizes regularized non-negative matrix factorization (NMF) to estimate accessibility scores that indicate whether a region is truly open in a particular cell [6]. Benchmarking studies demonstrated that scOpen significantly outperforms competing methods in recovering true open chromatin regions, showing the highest mean area under precision-recall curve (AUPR) while requiring the lowest memory footprint [6]. SCALE employs a deep learning approach based on variational autoencoders to learn latent representations of scATAC-seq data, though it requires GPU acceleration and has scalability limitations with large datasets [6]. RECODE represents another recent advancement that simultaneously reduces technical and batch noise while preserving full-dimensional data, enabling more accurate downstream analyses across diverse omics modalities [54].
The effectiveness of these methods was systematically evaluated in benchmarking studies, which measured their ability to improve cell-type identification through metrics such as silhouette scores and adjusted Rand index (ARI). Results consistently showed that proper imputation can enhance clustering resolution and facilitate the identification of rare cell populations that would otherwise be obscured by data sparsity [6].
Experimental Protocols for Noise Reduction
Sample Preparation and Quality Control Workflow
Minimizing technical noise begins with optimized sample preparation protocols. The following workflow outlines critical steps for reducing technical variability in scATAC-seq experiments:
Diagram 1: Experimental workflow for scATAC-seq quality control
Critical protocol steps for noise reduction:
Cell viability assessment: Maintain cell viability exceeding 80% before library construction. Reduced viability increases tagmentation of cell-free DNA released by dead cells, elevating background noise [21].
Appropriate cell/nuclei concentration: Accurate quantification of cell number or nuclear concentration is essential to ensure optimal capture rates and minimize multiplets [21].
Library quality assessment: Examine fragment size distribution using Agilent Bioanalyzer or similar systems. A quality library should show clear periodicity of approximately 200bp, corresponding to nucleosome-free, mononucleosome, and dinucleosome fragments [21].
Sequencing depth optimization: Target 40,000-100,000 reads per cell as a balance between cost and data quality. Studies show that downsampling below 40,000 reads per cell significantly impacts peak detection sensitivity [15].
Computational Pipeline for Data Denoising
Following sequencing, implement this computational workflow to address data sparsity and technical noise:
Diagram 2: Computational denoising pipeline for scATAC-seq data
Key computational steps for noise reduction:
Cell quality filtering: Remove low-quality cells based on three metrics [21]:
- Unique nuclear fragments: Typically 1,000-100,000 fragments per cell (technology-dependent)
- Fraction of reads in peaks (FRiP): >0.15-0.20
- TSS enrichment score: >5
Peak calling: Call peaks using MACS2 on aggregate scATAC-seq profiles, then create a count matrix of fragments overlapping these regions [15].
Normalization and imputation: Apply TF-IDF normalization followed by scOpen imputation to estimate true accessibility while reducing technical noise [6].
Batch effect correction: Utilize Harmony integration when combining multiple datasets to remove technical variability between samples [14].
Research Reagent Solutions for scATAC-seq
Table 3: Essential Research Reagents and Their Applications in scATAC-seq
| Reagent/Kit | Function | Application Notes |
|---|---|---|
| Hyperactive Tn5 Transposase | Fragments accessible DNA and adds adapters | Core enzyme; commercial versions show less batch variability |
| Nuclei Isolation Kits | Release intact nuclei from cells/tissues | Critical for sample quality; formulation varies by tissue type |
| Cell Viability Stains | Distinguish live/dead cells | Improve viability >80%; reduce background noise |
| Barcode-Compatible PCR Master Mix | Amplify tagmented DNA | Maintain complexity; avoid over-amplification |
| Size Selection Beads | Remove primer dimers and large fragments | Optimize library size distribution |
| Single-Cell Partitioning System | Isolate individual cells | 10x Chromium, ICELL8, or Fluidics C1 systems |
| Fluorescence-Activated Cell Sorter | Pre-sort live cells/nuclei | Optional but reduces ambient chromatin by 30% [15] |
Addressing inherent data sparsity and technical noise in scATAC-seq requires integrated experimental and computational approaches. While current methods have significantly improved our ability to extract biological signals from sparse data, challenges remain in achieving true single-cell, single-region resolution of chromatin accessibility states [12]. Promising future directions include multi-omics approaches that simultaneously profile chromatin accessibility and gene expression in the same cell, computational methods that better model the unique statistical characteristics of scATAC-seq data, and experimental advancements that increase the efficiency of Tn5 tagmentation in single cells. As these technologies mature, they will further enhance our understanding of epigenetic regulation in development, disease, and drug response.
Single-cell Assay for Transposase-Accessible Chromatin using sequencing (scATAC-seq) has emerged as a powerful technology for dissecting cellular heterogeneity in epigenetic regulation at genome-wide scale. Unlike bulk ATAC-seq that averages chromatin accessibility signals across cell populations, scATAC-seq enables researchers to map open chromatin landscapes in thousands of individual cells, revealing rare cell populations and regulatory dynamics [21] [55]. However, the inherent sparsity and technical noise of scATAC-seq data, where only 1-10% of open chromatin regions are detected per cell, means that sample preparation quality directly determines the success of downstream biological interpretations [56]. This application note provides comprehensive guidelines for essential sample preparation steps—focusing on cell viability assessment, nuclei isolation strategies, and rigorous quality control—to ensure generation of high-quality scATAC-seq data for chromatin accessibility profiling research.
Sample Preparation and Cell Viability Standards
scATAC-seq can be applied to diverse sample types, but each requires specific preservation approaches to maintain chromatin accessibility integrity. The table below summarizes validated preservation methods across different sample types:
Table 1: Sample Preservation Methods for scATAC-seq
| Sample Preservation | Sample Preparation | Tissues/Cell Types | Key Considerations |
|---|---|---|---|
| Fresh | Cell | Cell line, PBMC | Immediate processing recommended; viability critical [21] |
| Fresh | Nuclei | Cell line, PBMC, human cortex, Arabidopsis thaliana, fly | Direct nuclei isolation; avoids cell dissociation issues [21] |
| Frozen | Cell | Cell line, human and mouse skin fibroblast, mouse cardiac progenitor cells | Consistent freezing protocol essential; DMSO cryopreservation common [21] |
| Frozen | Nuclei | Mouse brain, 30 adult human tissues | Optimal for hard-to-dissociate tissues [21] |
| Frozen | Fixed nuclei | 15 human fetal tissues | Formaldehyde fixation stabilizes chromatin structure [21] |
Recent advancements in sample preservation have demonstrated that mild formaldehyde fixation (0.1%) combined with cryopreservation yields scATAC-seq data quality comparable to fresh samples, maintaining key metrics including signal-to-noise ratio and fragment size distributions [13]. This approach significantly enhances experimental flexibility for complex or longitudinal studies where immediate processing is impractical.
Cell Viability Requirements and Dead Cell Management
Cell viability is a critical determinant of scATAC-seq success, as low viability directly compromises data quality through several mechanisms. Dead cells release ambient chromatin fragments that become tagged during transposition, increasing background noise and complicating peak calling [21] [55]. Additionally, low viability reduces effective cell recovery rates during library preparation.
Table 2: Cell Viability Standards and Recommendations
| Viability Range | Recommendation | Expected Outcome |
|---|---|---|
| >90% | Proceed directly to library preparation | Optimal recovery and data quality [55] |
| 70%-90% | Proceed with caution; consider dead cell removal | Generally acceptable but may require deeper sequencing [55] |
| <70% | Perform dead cell removal before processing | Essential to prevent background noise and missed targets [55] |
For samples failing to meet viability thresholds, dead cell removal (DCR) using magnetic beads conjugated to annexin V antibodies effectively enriches live cell populations [55]. This approach captures dead and apoptotic cells through their exposed phosphatidylserine residues, preserving the integrity of viable nuclei for scATAC-seq. A minimum of 10^6 cells is typically required for effective DCR procedures, and previous treatment with magnetic beads may interfere with this process [55].
Nuclei Isolation Protocols and Methodologies
Core Principles of Nuclei Isolation
Nuclei isolation represents a critical step in scATAC-seq workflows, requiring careful balance between complete cellular lysis and nuclear envelope preservation. The fundamental goal is to permeabilize plasma membranes while maintaining nuclear integrity, protecting internal chromatin architecture from undesired degradation [57]. This process is particularly crucial for tissues difficult to dissociate into single cells (e.g., brain, adipose, fibrotic tissues) or when working with frozen specimens where intact cells cannot be obtained [21] [57].
Practical Isolation Workflow
The following diagram illustrates the core workflow for nuclei isolation:
Nuclei Isolation Workflow
Key considerations for each step include:
Lysis Buffer Composition: Typically contains detergents (e.g., Triton X-100) complemented with RNase inhibitors to protect RNA in multi-omics applications [57]. Both commercial kits and laboratory-formulated buffers are used, with optimization often required for specific sample types.
Mechanical Disruption: Methods range from gentle pipetting and inversion to more vigorous Dounce homogenization, selected based on tissue toughness and cell type [57].
Lysis Timing: Typically 1-10 minutes, with periodic monitoring (every 1-2 minutes during protocol optimization) to prevent over-lysis characterized by nuclear membrane blebbing, DNA halos, or complete rupture [57].
Anti-clumping Measures: Inclusion of 0.5-1% BSA in wash and resuspension buffers prevents nuclear aggregation, ensuring single-nucleus suspensions essential for droplet-based platforms [57].
Quality Assessment During Isolation
Microscopic examination throughout the isolation process is crucial for success. High-quality nuclei appear as single, round structures with sharp borders, while over-lysed nuclei display blebbing or ruptured envelopes [57]. Under-lysed preparations contain intact cells that will not be processed efficiently in scATAC-seq workflows. Viability stains like Trypan Blue, Propidium Iodide, or Acridine Orange/Propidium Iodide (AOPI) help distinguish intact from compromised nuclei, with ≥90% single, round nuclei with sharp borders representing the target outcome [57].
Comprehensive Quality Control Frameworks
Multi-Level QC Strategy
Robust quality control in scATAC-seq spans experimental and computational phases, with metrics specifically designed to address the unique characteristics of chromatin accessibility data. Systematic benchmarking studies have revealed that protocol choices significantly impact sequencing library complexity and tagmentation specificity, ultimately affecting cell-type annotation, peak calling, and differential accessibility analyses [15].
The following diagram illustrates the integrated quality control framework:
Integrated Quality Control Framework
Experimental QC Metrics
Library-Level Quality Assessment: Prior to sequencing, library quality should be verified through fragment size distribution analysis using platforms like Agilent Bioanalyzer. Characteristic periodicity of approximately 200bp reflecting nucleosome packing should be evident, with clear peaks representing nucleosome-free regions (<100bp), mononucleosome (~200bp), dinucleosome (~400bp), and multinucleosome fragments [21]. This pattern indicates proper Tn5 transposition activity and nucleosome preservation.
Post-Sequencing Quality Metrics: After data generation, three crucial metrics inform cell filtering decisions:
Table 3: Essential scATAC-seq QC Metrics
| QC Metric | Interpretation | Impact on Data Quality |
|---|---|---|
| Unique Nuclear Fragments | Typically thousands per cell; too low indicates poor information content, too high suggests doublets | Directly influences peak detection sensitivity [21] [56] |
| Fraction of Reads in Peaks (FRiP) | Measures signal-to-background ratio; higher values indicate cleaner data | <15-20% often indicates low-quality cells [21] [58] |
| TSS Enrichment Score | Accessibility enrichment at transcription start sites; higher values indicate better data quality | Hallmark of viable cells; low scores suggest degraded chromatin [21] [15] |
Computational QC and Doublet Detection
The extreme sparsity of scATAC-seq data necessitates specialized computational approaches for quality control. Doublet detection presents particular challenges, with two orthogonal strategies recommended:
Simulation-Based Detection (e.g., scDblFinder): Generates artificial doublets to identify cells with mixed accessibility profiles, primarily detecting heterotypic doublets (different cell types) [56].
Coverage-Based Detection (e.g., AMULET): Leverages the principle that diploid genomes should yield maximum two fragments per genomic position. Excess sites with >2 overlapping fragments indicate multiplets, effective for both heterotypic and homotypic doublets [56].
Recent methodological advances include tools like Chromap that directly report QC metrics without peak calling, capturing additional low-quality cells missed by other approaches [58]. For studies employing sample multiplexing, computational demultiplexing using fragment ratios has proven effective when barcode hopping occurs due to free-floating Tn5 complexes [13].
Research Reagent Solutions
Table 4: Essential Research Reagents for scATAC-seq
| Reagent/Category | Function | Application Notes |
|---|---|---|
| Hyperactive Tn5 Transposase | Inserts adapters into accessible chromatin | Engineered for efficient tagmentation; can be pre-loaded with barcodes for multiplexing [21] [13] |
| Nuclei Isolation Kits | Plasma membrane disruption with nuclear preservation | Commercial kits reduce optimization time; tissue-specific formulations available [57] |
| Viability Stains (Propidium Iodide, Trypan Blue) | Distinguishes intact from compromised nuclei | Essential for quality assessment during nuclei isolation [57] |
| Formaldehyde | Crosslinking for chromatin structure preservation | Low concentrations (0.1%) stabilize without compromising accessibility [13] |
| DNase/RNase Inhibitors | Protects nucleic acid integrity | Critical during nuclei isolation for multi-omics applications [57] |
| Magnetic Beads (Annexin V-conjugated) | Dead cell removal | Binds phosphatidylserine on apoptotic cells [55] |
| BSA (Bovine Serum Albumin) | Prevents nuclear clumping | 0.5-1% in wash and resuspension buffers [57] |
Mastering sample preparation fundamentals—including rigorous viability assessment, optimized nuclei isolation, and multi-level quality control—establishes the foundation for successful scATAC-seq experiments. As the technology continues evolving with enhanced multiplexing capabilities and integration with other omics modalities, these core principles remain essential for generating biologically meaningful chromatin accessibility data. By adhering to the protocols and standards outlined in this application note, researchers can overcome the inherent technical challenges of scATAC-seq and fully leverage its potential for revealing epigenetic regulation at single-cell resolution.
Computational Solutions for High-Dimensionality Data Analysis
Single-cell Assay for Transposase-Accessible Chromatin using sequencing (scATAC-seq) enables the profiling of chromatin accessibility landscapes at single-cell resolution, providing unprecedented insights into cellular heterogeneity and gene regulatory mechanisms. The data generated from these experiments presents unique computational challenges due to its high-dimensionality, extreme sparsity, and technical noise. Unlike single-cell RNA sequencing (scRNA-seq) data, scATAC-seq data exhibits a fundamentally different structure characterized by binary or low-count features representing accessible chromatin regions across thousands to millions of individual cells. The sparsity arises because each single cell captures only 1-10% of its total open chromatin regions, creating a data matrix where most entries are zeros [59]. This high-dimensional sparse data structure requires specialized computational approaches throughout the entire analytical pipeline, from quality control to biological interpretation.
The computational analysis of scATAC-seq data has evolved significantly to address these challenges, with tools now capable of processing datasets containing over a million cells [60]. Successful analysis requires navigating multiple steps including preprocessing, dimensionality reduction, clustering, cell-type annotation, and integration with multi-omics datasets. The field has developed specialized algorithms that account for the unique characteristics of chromatin accessibility data, enabling researchers to extract meaningful biological insights from these complex datasets. This application note provides a comprehensive overview of current computational solutions, protocols, and best practices for analyzing high-dimensional scATAC-seq data.
Computational Framework and Tool Ecosystem
Analysis Workflow and Specialized Algorithms
The standard computational workflow for scATAC-seq data analysis consists of multiple interconnected phases, each addressing specific analytical challenges. Figure 1 illustrates the complete analytical pathway from raw sequencing data to biological interpretation.
Figure 1. Comprehensive scATAC-seq Computational Analysis Workflow. The diagram outlines the key stages in processing single-cell ATAC-seq data, from raw sequencing reads to biological interpretation and multi-omics integration.
A diverse ecosystem of computational tools has been developed to address the specific challenges of scATAC-seq data analysis. Table 1 provides a comprehensive overview of specialized software packages and their capabilities across different analytical tasks.
Table 1: Comprehensive scATAC-seq Analysis Tools and Capabilities
| Tool | Primary Function | Feature Matrix | Dimensionality Reduction | scRNA-seq Integration | Differential Analysis | Motif Analysis | Unique Features |
|---|---|---|---|---|---|---|---|
| SnapATAC [60] | End-to-end analysis | Bin-based (5 kb) | LSI, Nyström method | Yes | Yes | Yes | Scalable to 1M+ cells |
| Signac [59] | End-to-end analysis | Peak-based | LSI, UMAP | Yes | Yes | Yes | Chromatin velocity |
| ArchR [59] | End-to-end analysis | Peak-based | Iterative LSI | Yes | Yes | Yes | Trajectory inference |
| chromVAR [60] | TF motif analysis | Peak-based | t-SNE | No | No | Yes | Motif deviation analysis |
| Cicero [59] | Regulatory networks | Peak-based | LSI | No | Yes | No | Peak co-accessibility |
| MAESTRO [59] | End-to-end analysis | Peak-based | LSI, PCA | Yes | Yes | No | Automated pipelines |
| Scasat [59] | Cell-type identification | Binary peak | MDS | No | Yes | No | Batch correction |
| cisTopic [15] | Topic modeling | Peak-based | LDA | Yes | Yes | Yes | Probabilistic modeling |
The choice of computational tool depends on several factors including dataset size, biological questions, and computational resources. For large-scale datasets exceeding 50,000 cells, SnapATAC and ArchR provide optimized algorithms for efficient processing [60]. SnapATAC employs the Nyström method for scalable dimensionality reduction, enabling analysis of up to one million cells on standard computational hardware [60]. For integration with transcriptomic data, Signac and MAESTRO offer robust functionality for transferring cell-type labels from scRNA-seq to scATAC-seq datasets [59]. Tools like chromVAR specialize in transcription factor motif analysis by quantifying accessibility deviations across cells, enabling identification of key regulatory factors driving cellular heterogeneity [60].
Specialized Algorithms for High-Dimensional Data
The extreme sparsity of scATAC-seq data necessitates specialized algorithmic approaches that differ significantly from those used for scRNA-seq analysis. Latent Semantic Indexing (LSI) has emerged as a preferred dimensionality reduction technique, which applies term frequency-inverse document frequency (TF-IDF) normalization to account for varying sequencing depths across cells [60]. This approach transforms the binary accessibility matrix into a continuous representation that better captures biological variation while mitigating technical artifacts.
For clustering analysis, graph-based methods have demonstrated superior performance compared to centroid-based approaches. These methods construct nearest-neighbor graphs in the reduced dimension space and identify communities of cells with similar accessibility profiles [60]. The SnapATAC package implements a particularly efficient approach that uses genomic bin-based features (typically 5 kb bins) rather than pre-defined peaks, enabling unbiased identification of cell populations without prior knowledge of accessible regions [60]. This strategy is especially valuable for discovering novel cell types or states that may exhibit unique regulatory landscapes.
Experimental Protocols and Data Generation
Sample Preparation and Quality Control
The computational analysis of scATAC-seq data is profoundly influenced by experimental choices during sample preparation and library construction. Sample preservation methods significantly impact data quality, with protocols now available for fresh, frozen, and formaldehyde-fixed paraffin-embedded (FFPE) samples [1] [21]. For FFPE samples, which represent the gold standard for clinical archiving, the recently developed scFFPE-ATAC method enables chromatin accessibility profiling from long-term archived specimens [1]. This protocol incorporates specialized components including an FFPE-adapted Tn5 transposase, T7 promoter-mediated DNA damage rescue, and in vitro transcription to overcome DNA fragmentation caused by formalin fixation [1].
Robust quality control is essential for generating high-quality scATAC-seq data. Table 2 outlines key quality metrics and their recommended thresholds at different stages of experimentation and computational analysis.
Table 2: Comprehensive Quality Control Metrics for scATAC-seq Experiments
| QC Stage | Metric | Recommended Threshold | Purpose | Tools for Assessment |
|---|---|---|---|---|
| Experimental QC | Cell Viability | >80% | Reduce ambient DNA noise | Trypan blue, flow cytometry |
| Nuclei Integrity | Intact nuclear membrane | Ensure chromatin integrity | Microscopy, DAPI staining | |
| Fragment Size Distribution | Periodic ~200 bp pattern | Verify nucleosome patterning | Bioanalyzer, TapeStation | |
| Sequencing QC | Unique Mapping Rate | >80% | Ensure read alignment quality | Picard, SAMtools |
| PCR Duplicate Rate | <50% | Remove amplification artifacts | Picard, SAMtools | |
| Mitochondrial Reads | <20% | Exclude apoptotic cells | Picard, SAMtools | |
| Cell-level QC | Unique Fragments per Cell | 1,000-100,000 | Filter low-quality cells | SnapATAC, Signac |
| TSS Enrichment Score | >5-10 | Measure signal-to-noise ratio | SnapATAC, Signac | |
| FRiP Score | >0.1-0.2 | Assess open chromatin signal | FeatureCounts, custom scripts | |
| Nucleosome Banding Pattern | Clear periodicity | Confirm chromatin integrity | ATACseqQC, custom scripts |
The fragment size distribution provides critical information about data quality, with successful experiments showing a characteristic pattern of nucleosome-free regions (<100 bp), mononucleosome fragments (~200 bp), dinucleosome fragments (~400 bp), and trinucleosome fragments (~600 bp) [2]. The enrichment of fragments at transcription start sites (TSS) serves as another key quality indicator, with high-quality datasets typically showing strong TSS enrichment scores (>5) [15]. The Fraction of Reads in Peaks (FRiP) score quantifies the signal-to-noise ratio, with values above 0.1-0.2 generally indicating successful experiments [21].
For the specialized case of FFPE samples, additional quality considerations apply due to extensive DNA damage from formalin fixation. The scFFPE-ATAC protocol incorporates density gradient centrifugation with optimized layers (25%-36%-48%) to separate intact nuclei from cellular debris [1]. Reverse crosslinking conditions must be carefully optimized, as standard approaches can exacerbate DNA fragmentation in FFPE samples [1].
Benchmarking of scATAC-seq Technologies
Recent systematic benchmarking of eight scATAC-seq protocols across 47 experiments using human peripheral blood mononuclear cells (PBMCs) revealed significant differences in performance metrics that directly impact computational analysis [15]. The study evaluated technologies including 10x Genomics (v1, v1.1, v2, multiome, mtscATAC), Bio-Rad ddSEQ, HyDrop, and s3-ATAC, highlighting several critical considerations for experimental design.
Key findings from this comprehensive benchmarking include:
- Sequencing library complexity varied significantly between methods, impacting cell-type annotation accuracy and differential accessibility detection
- Tagmentation specificity differed across protocols, influencing transcription factor motif enrichment analysis
- Cell recovery rates ranged from 7% to 60% of mapped fragments after quality filtering, with fluorescence-activated cell sorting (FACS) significantly improving cell quality in some protocols
- Read retention rates after preprocessing ranged from 40% to 85% across methods, directly affecting sequencing cost considerations
The benchmarking led to the development of PUMATAC (Pipeline for Universal Mapping of ATAC-seq Data), a standardized preprocessing workflow that enables uniform processing across different scATAC-seq technologies [15]. This pipeline addresses technology-specific characteristics while generating consistent output formats for downstream analysis, facilitating cross-protocol comparisons and integrative analyses.
Analytical Challenges and Specialized Solutions
Handling Data Sparsity and Dimensionality
The extreme sparsity of scATAC-seq data represents the most significant computational challenge, with typically only 1-10% of accessible regions detected per cell [59]. This sparsity arises from both biological factors (each cell only accesses a subset of regulatory elements) and technical limitations (low capture efficiency of the transposase enzyme). Computational strategies to address this sparsity include:
Feature Matrix Construction: Two primary approaches exist for representing scATAC-seq data as feature matrices. The peak-based method identifies reproducible accessible regions across cell populations using tools like MACS2, creating a matrix where rows represent peaks and columns represent cells [59]. The bin-based method divides the genome into fixed-size intervals (typically 5 kb) and counts fragments overlapping each bin, enabling unbiased feature discovery without prior peak calling [60]. Each approach has distinct advantages: peak-based matrices provide biologically interpretable features focused on regulatory elements, while bin-based matrices offer more comprehensive genome coverage and better performance for clustering heterogeneous cell populations.
Dimensionality Reduction Techniques: Specialized dimensionality reduction methods have been developed to address scATAC-seq sparsity. Latent Semantic Indexing (LSI) applies TF-IDF normalization to account for varying sequencing depths followed by singular value decomposition (SVD) to identify major axes of variation [60]. Topic modeling approaches like Latent Dirichlet Allocation (LDA) implemented in cisTopic identify latent "topics" representing co-accessible chromatin regions across cells [15]. The Nyström method, employed by SnapATAC, enables scalable dimensionality reduction for large datasets by computing embeddings for landmark cells then projecting remaining cells into the same space [60].
Cell-type Identification and Annotation
Accurately identifying cell types from scATAC-seq data requires specialized approaches due to the fundamental differences between chromatin accessibility and gene expression data. Three primary strategies have emerged for cell-type annotation:
Marker Gene Accessibility: This approach annotates cell clusters based on the accessibility of known marker genes in regulatory regions [60]. For example, T cells can be identified by accessibility at the CD3D/CD3E loci, while B cells show accessibility at PAX5 and CD79A regulatory elements. This method requires prior knowledge of cell-type-specific marker genes and their associated regulatory landscapes.
Integration with scRNA-seq Data: Label transfer from annotated scRNA-seq datasets represents the most robust approach for cell-type annotation [60]. Tools like Seurat, Signac, and Harmony enable integration of scATAC-seq and scRNA-seq datasets, transferring cell-type labels based on similarity in the shared feature space [59] [60]. This approach leverages the well-established cell-type annotation frameworks from transcriptomics while capturing regulatory information from epigenomics.
Reference-based Annotation: Emerging reference atlases like the ENCODE SCREEN regions enable automated annotation of scATAC-seq datasets based on alignment with previously characterized regulatory landscapes [15]. As comprehensive cell atlases continue to develop, this reference-based approach will become increasingly powerful for standardized cell-type annotation across studies.
Research Reagent Solutions
Successful scATAC-seq experiments require carefully selected reagents and materials optimized for chromatin accessibility profiling. Table 3 outlines essential research reagents and their functions in the experimental workflow.
Table 3: Essential Research Reagents for scATAC-seq Experiments
| Reagent Category | Specific Examples | Function in Workflow | Considerations |
|---|---|---|---|
| Transposase Enzymes | Hyperactive Tn5, FFPE-Tn5 [1] | Fragments accessible chromatin and adds adapters | FFPE-adapted Tn5 required for archived samples |
| Nuclei Isolation Reagents | Homogenization buffer, IGEPAL CA-630, Triton X-100 [61] | Releases intact nuclei from tissues/cells | Concentration optimization critical for nuclear integrity |
| Density Gradient Media | Iodixanol (Optiprep) [61] | Separates nuclei from debris | Critical for FFPE samples [1] |
| DNA Cleanup Kits | Qiagen MiniElute, Zymo Clean & Concentrator [61] | Purifies DNA after tagmentation | Size selection important for nucleosome patterning |
| Amplification Reagents | NEBNext High-Fidelity PCR Mix [61] | Amplifies tagmented fragments | Limited cycles to maintain complexity |
| Library Quantification | Agilent High Sensitivity DNA Kit [61] | QC for fragment size distribution | Verifies nucleosome banding pattern |
| Specialized Additives | Protease Inhibitors, RNase A, DTT [61] | Maintains chromatin and nuclear integrity | Essential for sensitive epigenetic signatures |
The selection of Tn5 transposase is particularly critical for experimental success. For standard fresh or frozen samples, commercial hyperactive Tn5 preparations typically provide excellent performance. However, for challenging sample types like FFPE tissues, specialized FFPE-adapted Tn5 transposase is required to handle the extensive DNA damage caused by formalin fixation [1]. The scFFPE-ATAC protocol incorporates additional specialized reagents including T7 promoter-mediated DNA damage rescue components and in vitro transcription systems to overcome limitations of conventional scATAC-seq for archived samples [1].
Density gradient centrifugation reagents play a crucial role in nuclei purification, particularly for complex tissues or compromised samples like FFPE blocks. While standard protocols often employ 25%-30%-40% density gradients, FFPE samples require optimized gradients (25%-36%-48%) to effectively separate intact nuclei from cellular debris [1]. This optimization is essential because nuclei from FFPE samples exhibit different density properties compared to fresh samples, with purified FFPE nuclei forming a distinct layer between 25% and 36% interfaces while debris concentrates between 36% and 48% interfaces [1].
Advanced Analytical Applications
Multi-omics Integration Approaches
The integration of scATAC-seq with other single-cell modalities, particularly scRNA-seq, enables comprehensive characterization of gene regulatory networks and cellular states. Computational approaches for multi-omics integration have advanced significantly, with several specialized tools now available:
Weighted Nearest Neighbor Methods: Tools like Seurat and Signac implement weighted nearest neighbor approaches that identify pairs of cells across modalities that share similar profiles [59]. These methods create a combined representation that simultaneously captures chromatin accessibility and gene expression patterns, enabling direct comparison of regulatory elements and their potential target genes.
Multi-omic Reference Atlases: Large-scale efforts like the ENCODE Consortium are developing comprehensive reference atlases that combine scATAC-seq and scRNA-seq data across diverse tissue types [15]. These resources enable researchers to project new datasets into established reference frameworks, facilitating consistent cell-type annotation and identification of novel regulatory programs.
Multi-modal Experimental Technologies: Emerging technologies like the 10x Genomics Multiome assay simultaneously profile chromatin accessibility and gene expression in the same single cell, eliminating the need for computational integration across separate assays [15]. Analytical methods for these truly multi-modal datasets are rapidly evolving, with tools like ArchR and Seurat providing specialized workflows for paired scATAC-seq and scRNA-seq data.
Regulatory Network Inference
Beyond cell-type identification, scATAC-seq data enables inference of gene regulatory networks through several computational approaches:
Cis-regulatory Element to Gene Linking: Tools like Cicero infer potential regulatory relationships by analyzing co-accessibility patterns between distal regulatory elements and promoter regions [59]. This approach identifies pairs of genomic regions that show correlated accessibility patterns across single cells, suggesting functional interaction in gene regulation.
Transcription Factor Motif Analysis: Specialized algorithms like chromVAR quantify the accessibility of transcription factor binding sites across single cells, enabling identification of key regulatory factors driving cellular heterogeneity [60]. This approach analyzes motif enrichment in accessible regions and calculates "deviation" scores that capture cell-to-cell variation in motif accessibility.
Trajectory Inference and Dynamic Regulation: For developing systems or continuous biological processes, tools like Monocle and Slingshot can construct differentiation trajectories from scATAC-seq data [59]. These methods order cells along pseudotemporal trajectories based on progressive changes in chromatin accessibility, revealing dynamic regulatory programs underlying cellular transitions.
Visualization and Interpretation
Effective visualization is essential for interpreting high-dimensional scATAC-seq data and communicating biological insights. Standard visualization approaches include:
Dimensionality Reduction Plots: Tools like UMAP and t-SNE project cells into two-dimensional space based on chromatin accessibility similarities, enabling visual identification of cell clusters and populations [60]. These visualizations are typically colored by cluster identity, experimental conditions, or computational annotations to highlight biological patterns.
Browser Tracks and Genome Visualization: Genomic track visualizations enable direct inspection of chromatin accessibility patterns at specific genomic loci [2]. Tools like the Integrative Genomics Viewer (IGV) can display aggregated accessibility signals across cell populations, facilitating comparison of regulatory landscapes between cell types or conditions.
Heatmaps and Accessibility Patterns: Heatmap visualizations display accessibility patterns across genomic regions or transcription factor motifs, organized by cell clusters or pseudotemporal ordering [60]. These visualizations effectively communicate patterns of differential accessibility and regulatory dynamics across biological contexts.
The computational solutions and protocols outlined in this application note provide a comprehensive framework for analyzing high-dimensional scATAC-seq data. As the technology continues to evolve, with improvements in sequencing throughput and multi-omic capabilities, computational methods will play an increasingly critical role in extracting biological insights from these complex datasets.
Single-cell Assay for Transposase-Accessible Chromatin using sequencing (scATAC-seq) has emerged as a powerful technology for dissecting cellular heterogeneity in epigenetic landscapes. The analysis of scATAC-seq data presents unique computational challenges due to extreme data sparsity, with only 1-10% of peaks detected per cell compared to 10-45% in single-cell RNA-seq data [62]. This technical characteristic necessitates specialized computational approaches for accurate cell type identification and regulatory element detection. Within this framework, SnapATAC, cisTopic, and chromVAR represent distinct methodological classes for featurizing and analyzing scATAC-seq data, while PUMATAC is not well-represented in current literature based on the available search results. This application note provides a structured comparison of these methods, supported by quantitative benchmarking and detailed protocols to guide researchers in method selection and implementation.
Method Comparison and Performance Benchmarking
Core Algorithmic Approaches
SnapATAC employs a graph-based approach that computes a cell-to-cell similarity matrix using the Jaccard index on genome-wide bins, followed by dimensionality reduction using the Nyström method for scalability to millions of cells [14]. The method operates directly on 5 kb genomic bins without requiring pre-defined peaks, making it particularly suitable for discovering novel regulatory elements in heterogeneous cell populations [14].
cisTopic implements a Bayesian probabilistic framework based on Latent Dirichlet Allocation (LDA) to model scATAC-seq data [63]. The method identifies "topics" representing co-accessible chromatin regions and corresponding cell states without requiring peak calling as an initial step, enabling robust identification of cell types and enhancers from sparse single-cell epigenomics data [63].
chromVAR takes a motif-centric approach by analyzing the variability in transcription factor motif accessibility across cells [64]. Rather than clustering cells based on overall chromatin accessibility patterns, chromVAR identifies transcription factors associated with chromatin accessibility variation through bias-corrected deviations in motif accessibility, providing direct biological interpretation of regulatory drivers [64].
Comprehensive Performance Evaluation
Table 1: Benchmarking Results of scATAC-seq Computational Methods
| Method | Clustering Accuracy (ARI) | Scalability | Memory Efficiency | Key Strengths |
|---|---|---|---|---|
| SnapATAC | High (0.71-0.89) [65] | Excellent (>1M cells) [14] [62] | Moderate [65] | Best for complex cell-type structures [65] |
| cisTopic | High (0.69-0.87) [65] [62] | Good (~100k cells) [6] | Low [6] | Robust identification of co-accessible regions [63] |
| chromVAR | Moderate (0.45-0.65) [62] | Good (~100k cells) [64] | High [64] | Direct TF inference without clustering [64] |
| BROCKMAN | Low (0.32-0.51) [62] | Good | Moderate | k-mer based approach [62] |
Table 2: Technical Specifications and Resource Requirements
| Method | Feature Space | Dimensionality Reduction | CPU Time (10k cells) | Memory (10k cells) |
|---|---|---|---|---|
| SnapATAC | Genome bins (5kb) [14] | Graph diffusion + Nyström [14] | ~30 minutes [65] | ~16 GB [65] |
| cisTopic | Regions or bins [63] | LDA [63] | ~45 minutes [6] | ~12 GB [6] |
| chromVAR | Motif deviations [64] | PCA/t-SNE [64] | ~60 minutes [64] | ~20 GB [64] |
| Scasat | Peak-level [62] | Jaccard similarity + t-SNE [62] | ~90 minutes [62] | ~18 GB [62] |
Recent benchmarking studies evaluating 8 feature engineering pipelines across 10 metrics have revealed that method performance is dependent on the intrinsic structure of datasets [65]. For datasets with simple structures and distinct cell clusters (e.g., mixed cell lines), most methods perform adequately. However, for tissues with closely related cell subtypes and hierarchical structures, SnapATAC and SnapATAC2 consistently outperform other approaches [65]. Specifically, SnapATAC achieves superior performance in clustering accuracy (measured by Adjusted Rand Index) and neighborhood purity (measured by Local Inverse Simpson's Index) for complex biological systems.
Figure 1: Computational workflow for scATAC-seq analysis showing the integration points for SnapATAC, cisTopic, and chromVAR methodologies.
Experimental Protocols and Implementation Guidelines
Data Preprocessing and Quality Control
Initial Processing with Cell Ranger ATAC:
This initial processing step requires substantial computational resources, with 160 GB RAM recommended for optimal performance when analyzing thousands of cells [66]. The output includes fragment files and a cell-by-peak matrix essential for downstream analysis.
Quality Control Metrics:
- Minimum Hardware: 8-core processor, 64 GB RAM, 1 TB disk space [66]
- Recommended Hardware: 24-core processor, 160 GB RAM, 1+ TB disk space [66]
- Cell Filtering: Retain cells with >1,000 fragments and TSS enrichment score >4 [66] [67]
- Doublet Removal: Use Amulet or Scrublet to identify multiplets [66]
Method-Specific Implementation Protocols
SnapATAC Implementation:
The critical parameter in SnapATAC is the bin size (default: 5 kb), which segments the genome for cell-to-cell similarity calculation [14]. For large datasets (>100,000 cells), enable the Nyström approximation for computational efficiency [14].
cisTopic Implementation:
cisTopic requires careful selection of the topic number, which can be optimized using the second derivative of the likelihood curve and perplexity metrics [9] [63]. The method typically identifies 48-52 topics in complex biological systems [9].
chromVAR Implementation:
chromVAR utilizes background peak sets matched for GC content and accessibility to correct for technical biases in scATAC-seq data [64]. The method is particularly effective for identifying transcription factor dynamics during cellular differentiation and disease progression [64].
Table 3: Research Reagent Solutions for scATAC-seq Analysis
| Reagent/Resource | Function | Implementation Notes |
|---|---|---|
| Cell Ranger ATAC | Data preprocessing and alignment | Requires 64-160 GB RAM; outputs BAM and fragment files [66] |
| Amulet | Doublet detection from scATAC-seq data | Identifies cells with >2-fold more unique peaks than expected [66] |
| cisBP Database | Motif position weight matrices | Curated collection for human and mouse TF motifs used in chromVAR [64] |
| BuenColors Package | Color schemes for visualization | Optimized for single-cell epigenomics data [66] |
| ArchR | Alternative analysis pipeline | Provides iterative LSI for dimensionality reduction [65] |
Multi-omics Integration Protocol
Spatial ATAC-seq Integration: The emergence of spatial epigenomics technologies enables correlation of chromatin accessibility with tissue morphology [68] [67]. The spatial ATAC-seq protocol involves:
- Tissue Preparation: Fresh frozen or FFPE tissue sections mounted on barcoded slides [68] [67]
- In Situ Tagmentation: Tn5 transposition directly in permeabilized sections [68]
- Spatial Barcoding: Ligation of spatial barcodes using microfluidic channels [67]
- Library Preparation: Amplification of barcoded DNA fragments for sequencing [68]
Integration with scRNA-seq:
This approach enables imputation of gene expression from chromatin accessibility patterns, facilitating cell type annotation and regulatory network inference [14].
Advanced Applications and Future Directions
Spatial Chromatin Profiling in Archived Specimens
Recent advances in spatial FFPE-ATAC-seq have enabled chromatin accessibility profiling in formalin-fixed paraffin-embedded (FFPE) tissues, unlocking vast archival sample collections for epigenomic research [67]. Key modifications to the standard spatial ATAC-seq protocol include:
- Target Retrieval Optimization: Tris-EDTA buffer (pH 9.0) at 65°C with proteinase K digestion [67]
- Crosslink Reversal: Breaking formalin-induced protein-DNA crosslinks while preserving tissue architecture [67]
- Quality Metrics: TSS enrichment scores of ~4 with 7,000+ unique fragments per 50-µm spot [67]
This approach maintains the spatial organization of chromatin accessibility while overcoming the challenges of FFPE sample analysis, with applications in clinical pathology and developmental biology [67].
Imputation Methods for Sparse scATAC-seq Data
The extreme sparsity of scATAC-seq data (3-7% non-zero entries) has motivated the development of imputation methods like scOpen, which uses regularized non-negative matrix factorization to estimate accessibility scores [6]. Benchmarking reveals that scOpen:
- Improves recovery of true open chromatin regions (AUPR: 0.61 vs 0.42 for raw data) [6]
- Enhances clustering accuracy (ARI: 0.71 vs 0.53 for raw data) [6]
- Requires lower memory (2-fold less than cisTopic and MAGIC) [6]
These computational advances address fundamental challenges in scATAC-seq analysis, enabling more accurate identification of cell types and regulatory elements.
Based on comprehensive benchmarking studies [65] [62], we recommend:
For complex tissues with hierarchical structure: SnapATAC provides superior performance in discerning closely related cell subtypes.
For regulatory mechanism inference: chromVAR offers direct biological interpretation through transcription factor motif analysis.
For identifying co-accessible regulatory elements: cisTopic enables robust discovery of enhancer networks and stable cell states.
For large-scale datasets (>100,000 cells): SnapATAC2 and ArchR provide the best scalability with acceptable memory usage.
The choice of computational method should be guided by the biological question, dataset complexity, and available computational resources. As single-cell epigenomics continues to evolve, integration of multiple analytical approaches will provide the most comprehensive insights into gene regulatory mechanisms in health and disease.
Experimental Design Considerations for Optimal Results
Single-cell Assay for Transposase-Accessible Chromatin using sequencing (scATAC-seq) has emerged as a powerful technology for mapping chromatin accessibility at single-cell resolution, enabling researchers to dissect cellular heterogeneity and identify candidate cis-regulatory elements across diverse cell types. The growing application of scATAC-seq in both basic research and clinical studies demands rigorous experimental design to ensure the generation of high-quality, reproducible data. This application note provides a comprehensive framework for optimizing scATAC-seq experiments, from sample preparation through computational analysis, with particular emphasis on recent methodological advances that expand applications to challenging sample types including formalin-fixed paraffin-embedded (FFPE) tissues.
Sample Preparation and Quality Control
Sample Type Considerations
The initial sample selection and preparation critically influence scATAC-seq data quality. Different sample types present unique challenges that require specific optimization strategies:
Table 1: Sample Type Considerations for scATAC-seq
| Sample Type | Key Considerations | Optimal Processing Methods |
|---|---|---|
| Fresh/Frozen Tissues | Minimal DNA damage; standard protocols applicable | Direct nuclei isolation; density gradient centrifugation |
| FFPE Archives | Extensive DNA fragmentation; crosslinking reversal needed | scFFPE-ATAC with specialized Tn5; T7-mediated DNA repair [1] |
| PBMCs/Cell Lines | High cell viability crucial; minimal debris | Direct processing; viability staining prior to encapsulation |
| Complex Tissues | Cellular heterogeneity; multiple cell populations | Combinatorial indexing; droplet-based encapsulation |
For FFPE samples, which represent invaluable clinical resources with over 400 million to 1 billion archived specimens worldwide, conventional scATAC-seq fails to resolve cell-type-specific epigenetic profiles due to extensive DNA damage [1]. The recently developed scFFPE-ATAC method overcomes this limitation through several key innovations: an FFPE-adapted Tn5 transposase, ultra-high-throughput DNA barcoding (>56 million barcodes per run), T7 promoter-mediated DNA damage repair, and in vitro transcription [1]. This approach has been successfully validated on human lymph node samples archived for 8-12 years and lung cancer FFPE tissues, revealing distinct regulatory trajectories between tumor center and invasive edge.
Nuclei Isolation and Purification
High-quality nuclei isolation is paramount for successful scATAC-seq experiments. The optimal approach varies by sample type:
- Fresh Tissues: Standard density gradient centrifugation (25%-30%-40% layers) effectively separates nuclei from debris [1].
- FFPE Tissues: Require modified density gradients (25%-36%-48%) as nuclei distribution differs from fresh samples, with pure nuclei localizing to the top layer (25%-36% interface) and debris concentrating in the bottom layer [1].
- Cell Culture: Direct lysis followed by washing and resuspension typically yields sufficient nuclei quality.
For all sample types, nuclei integrity should be confirmed microscopically, and concentration should be accurately determined using automated cell counters or hemocytometers. Incorporating fluorescence-activated cell sorting (FACS) can further enhance nuclei purity but requires specialized instrumentation [1].
Library Preparation and Sequencing
Transposition Efficiency Optimization
The Tn5 transposase reaction lies at the heart of scATAC-seq, with efficiency directly impacting library complexity and data quality. Key parameters to optimize include:
- Tn5 Concentration: Must be titrated for different sample types; excess Tn5 increases background noise while insufficient Tn5 reduces coverage.
- Reaction Temperature and Duration: Typically 37°C for 30-60 minutes, though FFPE samples may benefit from extended incubation.
- Cell Permeabilization: Critical for Tn5 access to chromatin; digitonin concentration must be optimized to balance access and nuclear integrity.
For FFPE samples, the standard Tn5 transposase requires adaptation to accommodate DNA damage. The FFPE-Tn5 used in scFFPE-ATAC incorporates T7 promoter-mediated DNA damage rescue mechanisms that significantly improve recovery of accessible regions [1].
Barcoding Strategies
Effective cellular barcoding is essential for single-cell resolution. Two primary approaches dominate current methodologies:
- Droplet-Based Systems: Utilize microfluidic partitioning to co-encapsulate single nuclei with barcoded beads, enabling processing of 10,000-100,000 cells per run [34].
- Combinatorial Indexing: Employs multiple rounds of barcoding without physical separation, potentially offering cost advantages for ultra-high-throughput experiments [14].
Droplet-based systems generally provide higher throughput and better standardization, while combinatorial indexing offers flexibility for custom experimental designs. The choice between these approaches should consider experimental scale, available infrastructure, and technical expertise.
Sequencing Depth Recommendations
Adequate sequencing depth is crucial for detecting rare cell populations and regulatory elements:
Table 2: scATAC-seq Sequencing Guidelines
| Application Goal | Recommended Reads/Cell | Minimum Cells | Sequencing Configuration |
|---|---|---|---|
| Cell Type Identification | 20,000-50,000 | 5,000-10,000 | Paired-end 50bp |
| Rare Population Detection | 50,000-100,000 | 20,000+ | Paired-end 50bp |
| Transcription Factor Motif Analysis | 50,000-100,000 | 10,000+ | Paired-end 50bp |
| Integration with scRNA-seq | 25,000-50,000 | 5,000+ | Paired-end 50bp |
For multiome experiments (simultaneous scATAC-seq and scRNA-seq), additional considerations include balanced sequencing between modalities and appropriate library preparation protocols that preserve both RNA integrity and chromatin accessibility [34].
Quality Control and Validation
Pre-analytical QC Metrics
Rigorous quality assessment throughout the experimental workflow is essential for generating interpretable data. Key QC parameters include:
- Nucleosome Banding Pattern: The fragment size distribution should show periodicity corresponding to mononucleosomal (∼200bp) and dinucleosomal (∼400bp) fragments [36].
- TSS Enrichment Score: Measures signal-to-noise ratio, with values >5-10 generally indicating good quality [36].
- Fraction of Fragments in Peaks: Should typically exceed 15-20% for high-quality datasets [36].
- Mitochondrial DNA Contamination: Should be minimized (<5%) through optimized nuclei isolation [34].
For FFPE samples, additional metrics include DNA fragment length distribution assessment and reverse crosslinking efficiency evaluation [1].
Computational Analysis Considerations
Data Processing Workflows
Effective computational analysis requires specialized approaches to handle the inherent sparsity of scATAC-seq data. Key steps include:
- Peak Calling: Can be performed using aggregate signals across all cells or using reference peak sets, though the latter may bias against rare populations [14].
- Dimensionality Reduction: Methods like latent semantic analysis (LSA), latent Dirichlet allocation (LDA), or the bin-based approach implemented in SnapATAC effectively capture biological variation [14].
- Clustering and Cell Type Identification: Integration with reference scRNA-seq datasets significantly improves annotation accuracy [14].
The SnapATAC package provides a comprehensive solution that processes single-cell chromatin accessibility profiles by representing each cell as a binary vector of 5kb genomic bins, followed by Jaccard similarity matrix calculation and dimensionality reduction using the Nyström method, which enables analysis of up to one million cells [14].
Multiomics Integration
Combining scATAC-seq with other data modalities significantly enhances biological insights:
- scRNA-seq Integration: Enables direct linkage between regulatory elements and gene expression patterns [34].
- Surface Protein Measurement: Simultaneous epitope profiling helps validate cell type identities [34].
- Spatial Context Preservation: Emerging technologies maintain tissue architecture while performing single-cell epigenomic profiling.
The droplet-based single-cell multiomics workflow enables simultaneous profiling of transcriptomes and chromatin accessibility from individual cells by co-encapsulating nuclei with barcoded gel beads containing distinct barcode systems for RNA and ATAC capture [34].
The Scientist's Toolkit
Table 3: Essential Research Reagents and Solutions
| Reagent/Solution | Function | Application Notes |
|---|---|---|
| Tn5 Transposase | Fragments accessible chromatin and adds sequencing adapters | FFPE-adapted version available for archived samples [1] |
| Digitonin | Permeabilizes nuclear membrane for Tn5 access | Concentration critical; affects signal-to-noise ratio |
| Density Gradient Media | Separates nuclei from debris | Different formulations needed for fresh vs. FFPE samples [1] |
| Barcoded Beads | Labels molecules with cell-specific barcodes | 10× Genomics platform provides >56 million barcodes [1] |
| DNA Repair Enzymes | Rescues damaged DNA in FFPE samples | T7 promoter-mediated repair enhances recovery [1] |
| Nuclei Buffer | Maintains nuclear integrity during processing | Typically contains MgCl2, NaCl, Tris, and detergent |
Optimal experimental design for scATAC-seq requires careful consideration of sample-specific challenges, appropriate quality control measures throughout the workflow, and computational methods tailored to address the unique characteristics of single-cell chromatin accessibility data. Recent methodological advances, particularly the development of scFFPE-ATAC, have significantly expanded the application of this technology to clinically archived samples, opening new avenues for retrospective epigenetic studies. By adhering to the guidelines and considerations outlined in this document, researchers can maximize the quality and biological insights derived from their scATAC-seq experiments, ultimately advancing our understanding of epigenetic regulation in development, homeostasis, and disease.
Benchmarking scATAC-seq Technologies: Performance Metrics and Validation Strategies
Single-cell Assay for Transposase-Accessible Chromatin by sequencing (scATAC-seq) has become a foundational method for dissecting the epigenetic heterogeneity of complex tissues at single-cell resolution. The quality of data generated by this technique is paramount for a precise characterization of cells and for deriving deep insights into underlying tissue biology. Two fundamental technical metrics that critically influence the success and interpretation of scATAC-seq experiments are library complexity and tagmentation specificity. Library complexity reflects the diversity and uniqueness of sequenced fragments, which impacts the depth of accessible chromatin profiling. Tagmentation specificity refers to the efficiency and bias of the Tn5 transposase in inserting into open chromatin regions, which affects the signal-to-noise ratio.
This application note, framed within a broader thesis on single-cell chromatin accessibility profiling, systematically benchmarks contemporary scATAC-seq protocols. We focus on the performance differences driven by library complexity and tagmentation efficiency, and their downstream consequences on biological interpretation. The analysis is designed to offer actionable guidance to researchers and drug development professionals in selecting and optimizing protocols for robust epigenetic research.
Comparative Performance of scATAC-seq Methods
A systematic, multicenter benchmarking study evaluated eight different scATAC-seq protocols using human peripheral blood mononuclear cells (PBMCs) as a reference sample to minimize technical variability. The study included 47 experiments with technical and center replicates [15]. The benchmarked methods encompassed:
- All variants of the 10x Genomics Chromium Single Cell ATAC Solution (v1, v1.1, v2, multiome, and mitochondrial scATAC (mtscATAC)).
- Bio-Rad ddSEQ.
- HyDrop.
- s3-ATAC.
To ensure a unified and fair comparison, all sequencing data were processed using PUMATAC (Pipeline for Universal Mapping of ATAC-seq data), a newly developed preprocessing pipeline that handles the various sequencing data formats generated by different technologies [15].
Quantitative Comparison of Key Performance Metrics
The following table summarizes the core performance metrics related to library complexity and tagmentation efficiency across the major protocols. The data is derived from the systematic benchmarking study [15].
Table 1: Quantitative Performance Metrics of scATAC-seq Protocols
| Method | Median Fragments per Cell after QC | TSS Enrichment Score | Fraction of Reads Lost in Preprocessing | Fraction of Mapped Fragments Discarded as Low-Quality |
|---|---|---|---|---|
| 10x Genomics v2 | 40,796 (downsampled) | High | 10.4% | 7% |
| 10x mtscATAC (with FACS) | Information Missing | High | Information Missing | <6% |
| 10x mtscATAC (without FACS) | Information Missing | Information Missing | Information Missing | 36% |
| Bio-Rad ddSEQ | Information Missing | Information Missing | Information Missing | Information Missing |
| HyDrop | Information Missing | Information Missing | 22.7% | Information Missing |
| s3-ATAC | Information Missing | Information Missing | Information Missing | 60% |
Impact on Downstream Analytical Outcomes
The observed differences in library complexity and tagmentation efficiency have a direct and measurable impact on key downstream analyses [15]:
- Cell-type annotation: Methods with higher complexity and specificity, such as 10x Genomics v2, yielded more distinct cell clusters and more accurate automated label transfer from scRNA-seq reference data.
- Differential region accessibility: The power to detect differentially accessible regions (DARs) between cell types or conditions is enhanced in protocols with lower technical noise.
- Transcription factor motif enrichment: The specificity of tagmentation influences the recovery of accessible transcription factor binding sites, thereby affecting motif enrichment analyses.
Detailed Methodologies for Key Experiments
Experimental Design for Systematic Benchmarking
The foundational benchmarking study employed a standardized experimental design to ensure comparability [15]:
- Biological Sample: A reference sample of PBMCs from two adult donors (male and female) mixed at a 1:1 ratio.
- Replication: Each of the eight protocols was performed in technical replicates across multiple sequencing centers, with a target of 3,000 cells per sample.
- Data Processing: All 47 datasets were uniformly processed using the PUMATAC pipeline, which includes:
- Cell barcode error correction.
- Adapter trimming.
- Reference genome alignment using
bwa-mem2. - Mapping quality filtering (Phred score >30).
- Recording fragments in a standardized file format.
- Quality Control: High-quality cells were separated from background noise using algorithmically defined thresholds on the number of unique fragments and Transcription Start Site (TSS) enrichment score. Background barcodes, originating from ambient chromatin or barcode impurities, were rigorously filtered out.
- Data Normalization: For downstream analysis, all datasets were downsampled to 40,796 reads per cell (the highest common number available across all samples) to ensure equitable comparison.
Protocol for scFFPE-ATAC on Archived Clinical Samples
Profiling FFPE samples presents unique challenges due to extensive DNA damage from formalin fixation. The scFFPE-ATAC protocol was developed to address this [69]:
- Nuclei Isolation from FFPE Tissue:
- Devax and rehydrate FFPE punch cores or tissue sections.
- Perform reverse cross-linking to remove formaldehyde fixation.
- Digest tissue with proteinase K and isolate nuclei via optimized density gradient centrifugation (25%-36%-48% layers) to separate pure nuclei (top layer) from cellular debris (bottom layer).
- Tagmentation with FFPE-Adapted Tn5: Use a newly designed FFPE-Tn5 transposase.
- DNA Damage Rescue: Employ T7 promoter-mediated DNA damage rescue and in vitro transcription to overcome fragmentation issues.
- Library Construction and Sequencing: Integrate ultra-high-throughput DNA barcoding (>56 million barcodes per run) for single-cell resolution.
Diagram: scFFPE-ATAC Workflow for Archived Samples
Protocol for sciPlex-ATAC for High-Throughput Multiplexing
The sciPlex-ATAC method enables high-capacity sample multiplexing, which is crucial for large-scale perturbation screens [11].
- Hash Labeling:
- Permeabilize nuclei from different samples or experimental conditions.
- Incubate each sample with a unique, unmodified single-stranded DNA "hash" oligo.
- Chemically fix nuclei to stabilize the hash labels within them.
- Modified sciATAC-seq Library Preparation:
- Perform an indexed primer extension step for the hash oligos.
- Conduct indexed transposition in the same well, creating a known pairing between well barcodes of hash oligos and tagmented chromatin.
- Pool nuclei, stain with DAPI, and flow-sort into 96-well plates.
- Reverse crosslinks and perform PCR amplification, adding a final level of barcoding.
- Bioinformatic Demultiplexing: Assign each cell's chromatin accessibility profile to its original sample based on the uniquely enriched hash label.
Diagram: sciPlex-ATAC Multiplexing Workflow
Quality Control and Computational Analysis
Essential QC Metrics for scATAC-seq Data
Rigorous quality control is critical for interpreting scATAC-seq data. The following metrics should be calculated for every experiment [15] [36]:
- Nucleosome Banding Pattern: The fragment size distribution should show a periodic pattern indicative of nucleosome protection. A high ratio of mononucleosomal to nucleosome-free fragments suggests good preservation.
- TSS Enrichment Score: This measures the ratio of fragments centered at transcription start sites to fragments in flanking regions. A high TSS enrichment score is a hallmark of a successful experiment.
- Fraction of Fragments in Peaks (FRiP): This represents the fraction of all fragments that fall within ATAC-seq peaks. Cells with low FRiP (<15-20%) are often low-quality or technical artifacts.
- Reads in Blacklist Regions: A high fraction of reads falling in genomic blacklist regions (e.g., ENCODE) can indicate technical artifacts.
Diagram: scATAC-seq Quality Control Decision Pipeline
Benchmarking of Computational Feature Engineering Methods
The choice of computational method for feature engineering and dimensionality reduction significantly impacts the ability to discern cell types from scATAC-seq data. A recent benchmark of 8 pipelines derived from 5 methods revealed that [65]:
- Overall Performance: Feature aggregation, SnapATAC, and SnapATAC2 generally outperformed latent semantic indexing (LSI)-based methods.
- Dataset Dependency: Method performance is dependent on the intrinsic structure of datasets. For datasets with complex cell-type structures (e.g., hierarchical or closely related subtypes), SnapATAC and SnapATAC2 are preferred.
- Scalability: For large datasets, SnapATAC2 and ArchR demonstrated the highest scalability in terms of time and memory efficiency.
The Scientist's Toolkit: Essential Reagents and Computational Tools
Table 2: Key Research Reagent Solutions and Computational Tools for scATAC-seq
| Item Name | Type | Function/Application |
|---|---|---|
| 10x Genomics Chromium Controller | Instrument | Platform for performing droplet-based single-cell partitioning for 10x Genomics protocols. |
| Tn5 Transposase | Enzyme | Engineered transposase that simultaneously fragments and tags accessible DNA with sequencing adapters. |
| FFPE-Tn5 Transposase | Specialized Reagent | A transposase adapted for use with formalin-fixed samples, as used in the scFFPE-ATAC protocol [69]. |
| Hash Oligos (sciPlex-ATAC) | Reagent | Unmodified single-stranded DNA oligos used as sample-specific nuclear labels for multiplexing experiments [11]. |
| PUMATAC | Computational Pipeline | A universal preprocessing pipeline for scATAC-seq data that handles various sequencing formats, reducing variability in data preprocessing [15]. |
| Signac | R Package | A toolkit for the analysis of single-cell chromatin data, integrated with Seurat, used for QC, clustering, and integration [36]. |
| ArchR | Computational Tool | A comprehensive software for scATAC-seq analysis that includes iterative LSI for dimensionality reduction and feature selection [65]. |
| SnapATAC2 | Computational Tool | A scalable software package for analyzing single-cell epigenomic data, using graph-based methods for dimensionality reduction [65]. |
Single-cell Assay for Transposase-Accessible Chromatin with sequencing (scATAC-seq) has emerged as a powerful tool for dissecting the epigenetic landscape and cellular heterogeneity in complex tissues at single-cell resolution [21] [15]. The technology utilizes a hyperactive Tn5 transposase to insert adapters into accessible chromatin regions, enabling genome-wide profiling of open chromatin [21] [2]. However, scATAC-seq data are inherently sparse and noisy, presenting significant analytical challenges [21] [70]. The accurate interpretation of these datasets critically depends on robust quality control (QC) measures that distinguish biological signal from technical artifacts. Among the various QC parameters, three metrics stand out as fundamental for evaluating data quality: Transcription Start Site (TSS) enrichment, fragment size distribution, and peak quality. These metrics collectively assess the signal-to-noise ratio, the success of the tagmentation reaction, and the biological relevance of the identified open chromatin regions, forming the essential triad for any scATAC-seq quality assessment framework [21] [2] [15].
TSS Enrichment Score
Metric Definition and Biological Significance
The TSS enrichment score (also referred to as TSS enrichment) is a crucial metric that quantifies the signal-to-noise ratio in scATAC-seq data by measuring the concentration of sequencing fragments around transcription start sites [21] [15]. This metric leverages the well-established biological principle that active promoters, associated with open chromatin, are highly enriched around TSSs of expressed genes [2]. In a high-quality scATAC-seq experiment, the chromatin is more accessible in these regulatory regions, resulting in a greater number of Tn5 transposition events and hence more sequencing reads centered on TSSs [21]. The calculation involves counting fragments that map within a defined window (e.g., ±1000 bp) around annotated TSSs and comparing the signal at the center to the flanks, which represent the background noise [15]. The TSS enrichment score is computed as the ratio of the fragment count at the center (e.g., ±50 bp of the TSS) to the average fragment count in the flanking regions (e.g., ±500 bp to ±1000 bp from the TSS) [15]. A higher score indicates better data quality, with strong enrichment signifying that the library captures biologically relevant, functional regulatory elements rather than random background accessibility.
Interpretation and Benchmark Values
The TSS enrichment score provides a robust, reference-based quality measure that is less dependent on sequencing depth compared to total fragment counts. This makes it particularly valuable for single-cell experiments where coverage per cell can vary substantially [15]. While specific optimal thresholds can vary depending on the experimental protocol and biological system, general benchmarks have been established through systematic benchmarking studies. The following table summarizes key quality indicators and their interpretations:
Table 1: Interpretation of TSS Enrichment Scores and Associated Quality Indicators
| Quality Indicator | Metric Value/Range | Interpretation | Biological Implication |
|---|---|---|---|
| TSS Enrichment Score | High (Protocol-dependent) | Strong signal-to-noise ratio [15] | Successful capture of functional regulatory elements [21] |
| Low | Poor signal-to-noise ratio | Potential issues with cell viability or nuclear integrity [21] | |
| Data Filtering | Used with unique fragment count | Separates high-quality cells from background barcodes [15] | Ensures downstream analysis on viable cells |
Low TSS enrichment often indicates poor cell viability or compromised nuclear integrity, where the chromatin structure has become degraded, leading to non-specific tagmentation events throughout the genome [21]. Consequently, the TSS enrichment score is routinely used as a primary filter to discriminate high-quality cells from low-quality cells and background noise barcodes during initial data processing [15].
Fragment Size Distribution
Principle and Periodicity Pattern
The fragment size distribution is a hallmark quality metric specific to ATAC-seq that reflects the underlying nucleosome packing and positioning [21] [2]. When the Tn5 transposase inserts adapters into open chromatin, the length of the resulting sequenced fragments is determined by the physical protection offered by nucleosomes. This produces a characteristic periodic pattern in the fragment size distribution plot [21] [2]. The key peaks in this distribution correspond to:
- Nucleosome-free regions (NFR): Fragments shorter than 100 base pairs, representing regions devoid of nucleosomes, typically found in active promoters and enhancers [2].
- Mononucleosome fragments: Fragments of approximately 180-200 bp in length, corresponding to DNA wrapped around a single nucleosome [21] [2].
- Dinucleosome fragments: Fragments of approximately 400 bp, representing DNA protected by two nucleosomes [21].
- Trinucleosome fragments: Fragments of approximately 600 bp, indicating DNA protected by three nucleosomes [2].
The presence of this distinct periodic pattern is a definitive indicator of a successful ATAC-seq experiment, as it demonstrates that the enzyme reaction has effectively probed the chromatin landscape and that the native nucleosomal structure has been preserved during sample preparation [21] [2].
Quality Assessment and Experimental Validation
Evaluating the fragment size distribution is a critical QC step that should be performed both pre- and post-sequencing [21]. Prior to sequencing, the size distribution of the library can be examined using instruments like the Agilent Bioanalyzer or Qseq, providing an early opportunity to assess library quality and abort failed experiments, thereby saving sequencing costs [21]. A typical fragment distribution from a high-quality library, as visualized by these platforms, shows clear peaks for nucleosome-free, mononucleosome, and dinucleosome fragments [21]. After sequencing, the same periodic pattern should be evident in the fragment size distribution plot generated from the sequencing data itself, confirming the pre-sequencing assessment [21] [2]. The absence of a clear nucleosomal pattern, or a dominance of very long fragments, suggests issues such as over-fixation, inadequate tagmentation, or general degradation of the chromatin template.
Figure 1: Experimental workflow for assessing fragment size distribution in scATAC-seq quality control.
Peak Quality and Data Filtering
Metrics for Assessing Peak Quality
In scATAC-seq analysis, "peaks" refer to the genomic regions identified as having statistically significant enrichment of transposition events, representing open chromatin. The quality of these peaks is not assessed by a single number but rather through a combination of complementary metrics that reflect the integrity of the data [21]:
- Fraction of fragments in peaks: This measures the proportion of all sequenced fragments that fall within called peak regions. A high fraction indicates good signal-to-background ratio, meaning that a substantial portion of the sequencing data captures genuine biological signal rather than non-specific or background accessibility [21].
- Unique fragments per cell: This metric refers to the number of distinct, non-duplicate fragments identified per cell barcode. Cells with an extremely low number of fragments likely represent empty droplets or severely damaged cells, while those with an extremely high count may be multiplets (doublets or triplets) where a single barcode contains fragments from more than one cell [21] [15].
- TSS enrichment and fragment size distribution: As previously detailed, these metrics also directly inform peak quality by confirming that the signal is biologically meaningful and structurally consistent with known chromatin organization [21] [2] [15].
Cell Filtering Strategies and Thresholds
These peak quality metrics are used in concert to filter cells and ensure robust downstream analysis. The following table outlines standard filtering criteria and the biological or technical anomalies they target:
Table 2: Key Metrics for Cell Filtering in scATAC-seq Data Analysis
| Filtering Metric | Target Artifact | Typical Threshold Consideration | Rationale |
|---|---|---|---|
| Unique Fragments per Cell | Low: Empty droplets, dead cells [21]High: Multiplets [21] | Set lower and upper bounds [21] | Ensures data from intact, single cells |
| Fraction of Fragments in Peaks | Low signal-to-background ratio [21] | Sample-specific minimum [21] | Removes cells with poor chromatin quality or high ambient RNA |
| TSS Enrichment Score | Poor nuclear integrity or cell viability [21] [15] | Sample-specific minimum [15] | Excludes cells where chromatin structure is degraded |
It is important to note that specific threshold values for these metrics are often determined algorithmically on a per-sample basis rather than applying fixed universal values, as they can be influenced by the experimental protocol, cell type, and sequencing depth [15]. The package PUMATAC, for instance, employs sample-specific minimum thresholds on the number of unique fragments and TSS enrichment to separate high-quality cells from background noise [15].
Integrated Quality Control Workflow
A robust QC workflow for scATAC-seq integrates all three key metrics in a sequential manner. The process begins with raw sequencing data processing, which includes adapter trimming, read alignment to a reference genome, and fragment file generation [21] [15]. Following this, the critical QC metrics are calculated for every cell barcode: the fragment size distribution is visualized to confirm nucleosomal periodicity, the TSS enrichment score is computed, and the number of unique fragments and their overlap with peak regions are quantified [21] [15]. These metrics then inform a filtering step where low-quality barcodes are removed. Cells are typically retained only if they pass thresholds for a minimum number of unique fragments, a minimum fraction of fragments in peaks, and a minimum TSS enrichment score [21] [15]. After filtering, the high-quality data proceeds to downstream analyses like clustering, visualization, and differential accessibility testing.
Figure 2: Integrated quality control workflow for scATAC-seq data, incorporating TSS enrichment, fragment size distribution, and peak quality metrics.
The Scientist's Toolkit
Research Reagent Solutions
Successful scATAC-seq experimentation relies on a suite of specialized reagents and materials. The following table details essential components and their functions within the workflow:
Table 3: Essential Research Reagents and Materials for scATAC-seq
| Reagent/Material | Critical Function | Application Note |
|---|---|---|
| Hyperactive Tn5 Transposase | Simultaneously fragments and tags accessible DNA with sequencing adapters [21] [2] | Enzyme activity must be confirmed; can be purified in-house [71] |
| Custom Transposition Adapters | Contain mosaic ends for Tn5 binding and sequencing adapters with sample barcodes [71] | Oligos must be HPLC-purified; annealed adapters are stable at -20°C/-80°C [71] |
| Nextera-style PCR Primers | Amplify the tagmented DNA and add full sequencing adapters and sample indices [2] [71] | Designed for dual-indexing in combinatorial indexing protocols (e.g., sciATAC-seq) [71] |
| Viability Stain/Dye | Distinguishes live cells from dead cells during sample preparation | Higher viability (>80%) reduces background from cell-free DNA [21] |
| Chromatin Standards | Provide reference material for validating fragment size distribution | Used with Agilent Bioanalyzer/TapeStation to QC library pre-sequencing [21] |
The rigorous assessment of TSS enrichment, fragment size distribution, and peak quality is non-negotiable for deriving biologically meaningful insights from scATAC-seq experiments. These metrics provide a multi-faceted lens through which researchers can evaluate the signal-to-noise ratio, the structural fidelity of the chromatin data, and the overall success of the library preparation. As scATAC-seq continues to become more integrated into foundational and translational research—from creating atlases of fetal development to understanding disease-specific regulatory responses—adherence to these quality control standards ensures the reliability, reproducibility, and interpretability of the findings [21] [72]. By implementing the detailed protocols and thresholds outlined in this document, researchers can confidently navigate the complexities of single-cell epigenomics and unlock the full potential of their chromatin accessibility studies.
Cell-Type Annotation Accuracy and Cluster Resolution Across Platforms
Single-cell Assay for Transposase-Accessible Chromatin using sequencing (scATAC-seq) has emerged as a powerful technology for dissecting regulatory landscapes and cellular heterogeneity in complex tissues at single-cell resolution [15] [3]. Unlike single-cell RNA sequencing which profiles the transcriptome, scATAC-seq identifies accessible chromatin regions that pinpoint genomic elements involved in gene regulation, providing mechanistic insights into cell state dynamics during development, disease, and in response to perturbations [15].
A critical challenge in scATAC-seq data analysis lies in accurately annotating cell types and achieving optimal cluster resolution that reflects true biological heterogeneity. This process is complicated by the inherent technical characteristics of scATAC-seq data, which is notably sparse and noisy compared to transcriptomic data [25] [21]. Since DNA is present in only two copies per cell in diploid organisms, scATAC-seq typically detects only 1-10% of expected accessible peaks per cell, compared to 10-45% of expressed genes detected in scRNA-seq [25]. This fundamental limitation, combined with differences in experimental platforms and computational methods, significantly impacts cell-type annotation accuracy and cluster resolution.
This application note systematically examines how platform selection and computational workflows influence cell-type identification in scATAC-seq studies, providing researchers with evidence-based recommendations for experimental design and data analysis.
scATAC-seq Technology Landscape and Performance Variation
Platform-Specific Performance Characteristics
Recent systematic benchmarking efforts have revealed substantial differences in performance across scATAC-seq technologies. A comprehensive evaluation of eight scATAC-seq methods across 47 experiments using human peripheral blood mononuclear cells (PBMCs) as a reference sample demonstrated significant variations in sequencing library complexity and tagmentation specificity, which directly impact cell-type annotation capabilities [15].
The benchmark included multiple variants of 10x Genomics scATAC-seq (v1, v1.1, v2, multiome, and mtscATAC), Bio-Rad ddSEQ, HyDrop, and s3-ATAC protocols. Analysis revealed that method selection profoundly affects key analytical outcomes including genotype demultiplexing, peak calling, differential region accessibility, and transcription factor motif enrichment [15]. These technical differences subsequently influence the accuracy and resolution of cell-type identification.
Table 1: Performance Metrics Across scATAC-seq Platforms
| Platform | Unique Fragments per Cell | TSS Enrichment Score | Fraction of Reads in Peaks | Cell-Type Discrimination Power |
|---|---|---|---|---|
| 10x Genomics v2 | High | High | High (≥70%) | Excellent |
| 10x Genomics v1.1 | Moderate-High | High | Moderate-High | Very Good |
| 10x Multiome | High | High | High | Excellent |
| mtscATAC (with FACS) | High | Very High | Very High (≥90%) | Excellent |
| mtscATAC (without FACS) | Moderate | Moderate | Low (~60%) | Moderate |
| HyDrop | Moderate | Moderate | Moderate | Good |
| s3-ATAC | Variable | Variable | Low (~40%) | Variable |
| Bio-Rad ddSEQ | Moderate | Moderate | Moderate | Good |
Impact of Sample Preparation on Data Quality
Sample preparation methods significantly influence data quality and subsequent cell-type annotation. Fluorescence-activated cell sorting (FACS) of live cells prior to nuclei extraction dramatically reduces background noise, with studies showing losses of mapped fragments decreasing from 36% in mtscATAC-seq without FACS to below 6% in mtscATAC-seq with FACS [15]. This improvement in signal-to-noise ratio directly enhances the ability to resolve closely related cell subtypes.
The starting material preservation method also affects data quality. Unlike scRNA-seq, scATAC-seq can be successfully applied to fresh tissues, frozen samples, and fixed specimens, providing flexibility for clinical and archival samples [21]. However, cell viability should exceed 80% to minimize tagmentation of cell-free DNA released by dead cells, which increases sequence noise and compromises data quality [21].
Computational Methods for Cell-Type Identification
Feature Engineering and Dimensionality Reduction Approaches
The high dimensionality and inherent sparsity of scATAC-seq data necessitate sophisticated computational approaches for feature engineering and dimensionality reduction before cell-type identification can be performed. Current methods can be broadly categorized into three strategic approaches:
Genomic coordinate-based methods (Signac, ArchR, SnapATAC) utilize predefined genomic regions (bins or peaks) as features and employ techniques such as Latent Semantic Indexing (LSI) or graph-based approaches to reduce dimensionality [65] [25].
Sequence content-based methods (BROCKMAN, chromVAR) use DNA sequence characteristics such as gapped k-mers or transcription factor motifs as features, then apply dimensional reduction methods like PCA [25].
Neural network models (PeakVI, scBasset) employ variational autoencoders or convolutional neural networks to learn lower-dimensional representations [65].
A comprehensive benchmarking study evaluating 8 feature engineering pipelines derived from 5 recent methods revealed that performance is highly dependent on the intrinsic structure of datasets [65]. For datasets with simple cellular structures (e.g., mixed cell lines), most methods perform adequately. However, for tissues with complex cellular hierarchies and closely related subtypes, SnapATAC, SnapATAC2, and ArchR consistently outperform other methods [65] [25].
Table 2: Performance Ranking of Computational Methods for Cell-Type Identification
| Method | Basis of Algorithm | Scalability | Simple Structures | Complex Structures | Overall Ranking |
|---|---|---|---|---|---|
| SnapATAC2 | Laplacian eigenmaps | Excellent | Excellent | Excellent | 1 |
| SnapATAC | Diffusion maps | Very Good | Excellent | Excellent | 2 |
| ArchR | Iterative LSI | Very Good | Very Good | Good | 3 |
| Signac (cluster-based peaks) | LSI | Good | Good | Moderate | 4 |
| Signac (aggregate peaks) | LSI | Good | Good | Moderate | 5 |
| cisTopic | LDA | Moderate | Good | Moderate | 6 |
| Feature Aggregation | Meta-features | Moderate | Moderate | Poor | 7 |
| BROCKMAN | k-mer frequency | Moderate | Moderate | Poor | 8 |
Cell-Type Annotation Strategies
After dimensionality reduction and clustering, several approaches can be employed to annotate cell types:
- Marker gene accessibility: Examining chromatin accessibility at canonical marker genes [60]
- Integration with scRNA-seq reference data: Transferring labels from independently annotated scRNA-seq datasets using tools like Seurat [15] [60]
- Motif enrichment analysis: Identifying transcription factors with enriched binding motifs in cluster-specific accessible regions [60]
- Supervised annotation: Using existing cell atlases to classify new datasets [60]
The choice of annotation strategy should be guided by the availability of reference data and the novelty of the cell populations under investigation. For well-characterized systems, integration with scRNA-seq references typically provides the most accurate annotations, while for novel or poorly characterized systems, a combination of marker gene accessibility and motif enrichment may be more appropriate.
Figure 1: Computational Workflow for Cell-Type Annotation in scATAC-seq Data Analysis
Experimental Protocols for Optimal Cell-Type Resolution
Sample Preparation Protocol for High-Quality scATAC-seq Data
Materials:
- Fresh, frozen, or fixed tissue samples
- Nuclei isolation buffer (e.g., NP-40 or Igepal-based lysis buffer)
- Viability stain (e.g., DAPI or propidium iodide)
- Tn5 transposase (commercially available)
- PCR reagents for library amplification
- Size selection beads (e.g., SPRIselect)
Procedure:
- Nuclei Isolation:
- For fresh tissues: Mechanically dissociate tissue in cold nuclei isolation buffer followed by filtration through 40μm strainer.
- For frozen tissues: Cryosection tissue and perform nuclei isolation in lysis buffer.
- For fixed tissues: Use crosslink reversal before nuclei isolation.
Viability Assessment:
- Stain nuclei with viability dye and assess using fluorescence microscopy or flow cytometry.
- Proceed only if viability exceeds 80% to minimize background noise [21].
Tagmentation Reaction:
- Resuspend 50,000-100,000 nuclei in tagmentation buffer.
- Add Tn5 transposase and incubate at 37°C for 30 minutes.
- Purify tagmented DNA using silica column or bead-based cleanup.
Library Preparation:
- Amplify tagmented DNA with barcoded primers using limited-cycle PCR.
- Determine optimal cycle number using qPCR or by monitoring amplification in real-time PCR instrument.
Library Quality Control:
Sequencing:
- Sequence on Illumina platform with paired-end reads.
- Target 25,000-50,000 read pairs per cell for standard analyses.
- Increase to >100,000 read pairs per cell for enhanced peak detection and footprinting.
Computational Protocol for Cell-Type Annotation
Software Requirements:
- Snakemake or Nextflow for workflow management
- FastQC for quality control
- Trimmomatic or fastp for adapter trimming
- BWA-MEM or Bowtie2 for alignment
- SnapATAC2 or ArchR for feature engineering
- Seurat for integration with scRNA-seq data
- MACS2 for peak calling
Procedure:
- Quality Control and Preprocessing:
- Assess raw read quality with FastQC.
- Trim adapters and low-quality bases with Trimmomatic.
- Align reads to reference genome with BWA-MEM.
- Remove duplicates, mitochondrial reads, and ENCODE blacklist regions.
- Shift reads +4bp (forward strand) and -5bp (reverse strand) to account for Tn5 offset.
Cell Filtering:
- Filter cells based on three key metrics:
- Unique nuclear fragments (typically >1,000 fragments/cell)
- Fraction of fragments in peaks (>15-20%)
- TSS enrichment score (>3-5) [21]
- Remove doublets using tools like Scrublet or based on extreme fragment counts.
- Filter cells based on three key metrics:
Feature Matrix Construction:
- For SnapATAC2: Create binary accessibility matrix in 5kb bins across genome.
- For ArchR: Iterative LSI on either genomic bins or merged peaks.
- For Signac: Create peak-based count matrix using aggregate or cluster-specific peaks.
Dimensionality Reduction and Clustering:
- Perform method-specific dimensionality reduction.
- Construct shared nearest neighbor graph.
- Apply Leiden or Louvain clustering at multiple resolutions.
Cell-Type Annotation:
- Identify cluster-specific accessibility peaks.
- Check accessibility at known marker genes.
- Integrate with scRNA-seq reference using Seurat's label transfer.
- Perform motif enrichment analysis in cluster-specific peaks.
- Annotate clusters based on consolidated evidence.
The Scientist's Toolkit: Essential Research Reagents and Computational Tools
Table 3: Essential Research Reagents and Computational Tools for scATAC-seq
| Category | Item | Specification/Version | Function/Purpose |
|---|---|---|---|
| Wet Lab Reagents | Tn5 Transposase | Commercial preparations (e.g., Illumina) | Simultaneously fragments and tags accessible chromatin |
| Nuclei Isolation Buffer | Detergent-based (NP-40/Igepal) | Releases intact nuclei while preserving chromatin | |
| Size Selection Beads | SPRIselect/AMPure XP | Library cleanup and fragment size selection | |
| Library Quantification Kits | Qubit/QPCR-based | Accurate library quantification before sequencing | |
| Sequencing Platforms | 10x Genomics Chromium | Single Cell ATAC Solution | High-throughput droplet-based scATAC-seq |
| Fluidigm C1 | Integrated Fluidic Circuit | Microfluidics-based single-cell capture | |
| s3-ATAC | Combinatorial indexing | Plate-based method without specialized equipment | |
| Computational Tools | SnapATAC2 | Latest version | Scalable dimensional reduction for complex datasets |
| ArchR | Version 1.0.3 | Comprehensive analysis with iterative LSI | |
| Signac | Compatible with Seurat v5 | Peak-based analysis integrating with scRNA-seq | |
| Cell Ranger ATAC | 10x Genomics pipeline | Official processing pipeline for 10x data | |
| Seurat | Version 5.0.0 | Reference integration and label transfer |
Cell-type annotation accuracy and cluster resolution in scATAC-seq studies are influenced by multiple factors spanning experimental and computational domains. Based on comprehensive benchmarking studies, the following recommendations can maximize annotation accuracy:
Platform Selection: 10x Genomics platforms (particularly v2 and multiome) generally provide superior data quality for cell-type discrimination. When working with limited or challenging samples, incorporate FACS sorting to improve signal-to-noise ratio.
Computational Method Selection: For tissues with complex cellular hierarchies, SnapATAC2 and SnapATAC provide the most robust performance. For large-scale atlas projects, ArchR and SnapATAC2 offer the best scalability. For simpler cell mixtures, Signac with cluster-specific peak calling provides a balanced approach.
Quality Control: Implement rigorous quality control at both experimental and computational stages. Prioritize TSS enrichment scores and fraction of fragments in peaks over total sequence depth alone.
Annotation Strategy: Combine multiple lines of evidence for annotation, including integration with scRNA-seq references, marker gene accessibility, and motif enrichment analysis.
As scATAC-seq technology continues to evolve with emerging methods like txci-ATAC-seq enabling massive-scale profiling [73], adherence to these best practices will ensure accurate cell-type identification and maximize biological insights from chromatin accessibility studies.
In the context of single-cell ATAC-seq research, the integration of chromatin accessibility data with gene expression profiles represents a pivotal advancement for deciphering the complex regulatory codes that govern cellular identity and function. Epigenetics, which investigates stable phenotypic changes without alterations in DNA sequence, plays a crucial role in understanding gene regulation, with chromatin accessibility serving as a core mechanism that governs gene expression by modulating the interaction between transcription factors and DNA [1]. While single-cell ATAC-seq (scATAC-seq) maps genome-wide accessible chromatin regions and single-cell RNA sequencing (scRNA-seq) captures transcriptional outputs, these modalities individually provide only partial insights into the regulatory landscape [74]. Their integration enables researchers to establish causal relationships between non-coding regulatory elements and gene expression, revealing the functional consequences of epigenetic variation in development, disease, and therapeutic response [75]. This Application Note provides a comprehensive framework for experimentally generating and computationally integrating multi-omics data to correlate chromatin accessibility with gene expression, with specific protocols tailored for researchers and drug development professionals.
Experimental Design Considerations
Sample Preservation and Preparation
The choice of sample preservation method significantly impacts experimental success in single-cell multi-omics studies. While scATAC-seq can be applied to fresh, frozen, and fixed samples, each approach presents distinct advantages and limitations.
Table 1: Sample Preservation Methods for scATAC-seq
| Preservation Method | Sample Preparation | Tissues Demonstrated | Considerations |
|---|---|---|---|
| Fresh | Cells or nuclei | Cell line, PBMC, human cortex, Arabidopsis thaliana, fly [21] | Optimal chromatin accessibility preservation but requires immediate processing |
| Frozen | Cells or nuclei | Mouse brain, 30 adult human tissues, cell lines, human and mouse skin fibroblast [21] | Enables archival of rare samples; may require optimized nuclei isolation |
| Fixed | Fixed nuclei | 15 human fetal tissues [21] | Preserves sample integrity for complex processing; may require antigen retrieval |
| FFPE | Nuclei | Mouse spleen, human lymph node, lung cancer tissues [1] | Essential for clinical archives; requires specialized reversal of cross-linking |
For formalin-fixed paraffin-embedded (FFPE) samples, which constitute over 99% of clinical archives, specific adaptations are necessary. The scFFPE-ATAC method incorporates an FFPE-adapted Tn5 transposase, T7 promoter-mediated DNA damage repair, and in vitro transcription to overcome extensive DNA fragmentation caused by formalin fixation [1]. When processing FFPE samples, density gradient centrifugation with optimized layers (25%-36%-48%) effectively separates pure nuclei from cellular debris, which distributes differently than in fresh samples [1].
Single-Cell Multi-omics Assays
Several technological platforms enable coordinated profiling of chromatin accessibility and gene expression:
- Paired Multi-ome Assays: Commercial platforms such as the 10X Genomics Multiome ATAC + Gene Expression assay simultaneously profile both modalities in the same single cell, providing inherent biological correspondence [76] [75].
- Unpaired Integration: When separate scATAC-seq and scRNA-seq datasets are generated from the same tissue type, computational integration aligns shared cell states across modalities [76] [75].
- Multiome-Guided Integration: Paired multi-omics data can serve as a bridge to enhance the integration of larger unpaired datasets [76].
Table 2: Single-Cell Multi-omics Integration Approaches
| Integration Type | Data Structure | Representative Methods | Best Use Cases |
|---|---|---|---|
| Paired Integration | scRNA-seq and scATAC-seq from same cells | scMVP [76], MOFA+ [76] | Direct regulatory inference with native pairing |
| Unpaired Integration | scRNA-seq and scATAC-seq from different cells of same tissue | GLUE [75], SCARlink [77], Seurat v3 [76], LIGER [76] | Large-scale atlas construction, leveraging existing datasets |
| Paired-Guided Integration | Combining paired and unpaired datasets | MultiVI [76], Cobolt [76] | Enhancing small paired datasets with larger unpaired data |
Computational Integration Methods
Computational integration of scATAC-seq and scRNA-seq data presents unique challenges due to fundamental differences in feature spaces (genomic regions versus genes) and inherent data sparsity (1-10% of peaks detected per cell in scATAC-seq versus 10-45% of expressed genes detected per cell in scRNA-seq) [25]. Multiple algorithmic strategies have been developed to address these challenges:
- Feature Conversion Methods: These approaches convert one modality into the feature space of the other using prior biological knowledge. For instance, scATAC-seq data can be transformed into pseudo-gene expression data using gene scoring methods that aggregate accessibility signals near gene promoters [25].
- Matrix Factorization Methods: Techniques like integrative non-negative matrix factorization (iNMF) identify shared factors across modalities that represent conserved biological signals [76].
- Neural Network-Based Alignment: Deep learning approaches such as GLUE (Graph-Linked Unified Embedding) use variational autoencoders with adversarial alignment to learn a shared latent representation while explicitly modeling regulatory interactions between modalities [75].
- Manifold Alignment: Methods like UnionCom and MMD-MA align the distance matrices or low-dimensional distributions of different omics without requiring explicit feature conversion [76].
Benchmarking Integration Performance
Systematic benchmarking of 12 multi-omics integration methods across three integration tasks (paired, unpaired, and paired-guided) provides performance guidelines for method selection [76]. Evaluation criteria included:
- Omics Mixing: How well cells from different omics types intermingle in the integrated space when they represent the same cell type.
- Cell Type Conservation: Preservation of biological variation and cell type identity after integration.
- Trajectory Conservation: Maintenance of developmental trajectories in the integrated space.
- Single-cell Alignment Accuracy: Accuracy of cell-to-cell matching in paired datasets.
- Scalability: Computational efficiency with increasing cell numbers.
- Ease of Use: Implementation complexity and documentation quality.
Benchmarking results indicate that no single method outperforms all others across every metric, with different methods exhibiting specialized strengths [76]. For unpaired integration, GLUE achieved superior performance in both biology conservation and omics mixing across multiple datasets, while also demonstrating remarkable robustness to inaccuracies in prior biological knowledge [75].
Detailed Protocols
Protocol 1: SCARlink for Enhancer-Gene Linking
SCARlink (single-cell ATAC + RNA linking) is a gene-level regulatory model that predicts single-cell gene expression from chromatin accessibility and links enhancers to target genes using multi-ome sequencing data [77].
Experimental Workflow:
Input Data Preparation: Process paired scATAC-seq and scRNA-seq data to obtain cell-by-gene (expression) and cell-by-tile (accessibility) matrices. SCARlink uses non-overlapping 500 bp tiles spanning a region from 250 kb upstream to 250 kb downstream of the gene body by default.
Model Training: For each gene, train a regularized Poisson regression model that predicts gene expression from tile accessibility using the following formulation:
log(E[Y_g]) = β_0 + Σ β_j * X_jwhere Yg is the expression of gene g, Xj is the accessibility of tile j, and β_j are non-negative regression coefficients constrained to identify enhancers.Model Validation: Evaluate prediction performance using Spearman correlation between predicted and observed gene expression on held-out cells. SCARlink significantly outperformed ArchR gene scores in high-coverage datasets (P < 8.35 × 10â»Â¹Â¹â´ on PBMC) [77].
Enhancer Identification: Extract regression coefficients (β_j) to identify genomic tiles with regulatory potential. Apply Shapley value analysis to identify cell-type-specific enhancers.
Biological Validation: Validate putative enhancers through enrichment analysis for fine-mapped eQTLs (11-15× enrichment) and GWAS variants (5-12× enrichment) [77].
Protocol 2: GLUE for Multi-omics Integration
GLUE (Graph-Linked Unified Embedding) provides a generalizable framework for unpaired multi-omics integration through explicit modeling of regulatory interactions [75].
Experimental Workflow:
Guidance Graph Construction: Build a knowledge-based bipartite graph connecting features across omics layers. For scATAC-seq and scRNA-seq integration, vertices represent ATAC peaks and genes, while edges represent putative regulatory interactions (e.g., peak-gene links based on genomic proximity).
Omics-Specific Encoding: Train separate variational autoencoders for each omics modality, using probabilistic generative models tailored to layer-specific feature distributions.
Adversarial Alignment: Perform iterative optimization to align cell embeddings across modalities while preserving the regulatory structure encoded in the guidance graph.
Batch Effect Correction: Include batch as a decoder covariate to correct for technical artifacts while guarding against over-correction using the integration consistency score.
Regulatory Inference: Refine the guidance graph based on alignment results to enable data-oriented regulatory inference.
Protocol 3: scFFPE-ATAC for Archival Samples
The scFFPE-ATAC protocol enables chromatin accessibility profiling from clinically archived FFPE samples [1].
Experimental Workflow:
Nuclei Isolation from FFPE:
- Cut 10-20 μm FFPE sections and transfer to microcentrifuge tubes
- Deparaffinize with xylene (or xylene substitutes), followed by ethanol washes
- Perform proteinase K digestion at 56°C for 1-3 hours
- Centrifuge and resuspend in nuclei isolation buffer
Density Gradient Centrifugation:
- Prepare density gradient layers (25%-36%-48%)
- Carefully load nuclei suspension on top
- Centrifuge at 2,000 × g for 20 minutes at 4°C
- Collect nuclei from the top layer (25%-36% interface)
Reverse Crosslinking and Tagmentation:
- Incubate nuclei in reverse crosslinking buffer (2% SDS, 200 mM NaCl) at 65°C for 2 hours
- Wash with tagmentation buffer
- Perform tagmentation with FFPE-adapted Tn5 transposase
DNA Damage Rescue:
- Incorporate T7 promoter sequences during adapter integration
- Perform T7-mediated in vitro transcription to convert DNA fragments to RNA
- Reverse transcribe back to cDNA to bypass DNA lesions
Library Construction and Sequencing:
- Amplify libraries with barcoded primers
- Quality control using fragment size distribution (Bioanalyzer)
- Sequence on Illumina platform (typically 150 bp paired-end)
Quality Control and Validation
Experimental Quality Control
Rigorous quality control is essential for generating reliable single-cell multi-omics data:
- Cell Viability: Ensure >80% viability before library construction to minimize tagmentation of cell-free DNA [21]
- Nuclei Integrity: Confirm intact nuclear morphology by microscopy
- Library Quality: Assess fragment size distribution using Bioanalyzer/Qseq; expect clear periodicity of ~200 bp corresponding to nucleosome-free, mononucleosome, and dinucleosome fragments [21]
- Sequencing Metrics:
Computational Quality Assessment
- Integration Diagnostics: Use the integration consistency score in GLUE to detect potential over-correction when integrating datasets lacking common cell states [75]
- Cluster Alignment: Quantify the alignment of corresponding cell types across modalities using normalized mutual information (NMI) and adjusted Rand index (ARI) [76]
- Marker Conservation: Verify that established marker genes maintain cell-type-specific expression in the integrated space
The Scientist's Toolkit
Table 3: Essential Research Reagent Solutions for Multi-omics Studies
| Reagent/Category | Function | Example Products/Formats |
|---|---|---|
| Nuclei Isolation | Release intact nuclei from tissue/cells | Dounce homogenizers, commercial nuclei isolation kits (e.g., Shbio Cell Nuclear Isolation Kit #52009-10) [78] |
| Single-Cell Partitioning | Physically separate individual cells | 10X Genomics Chromium, microfluidic devices, split-pool combinatorial indexing |
| Tagmentation | Fragment accessible DNA and add adapters | Hyperactive Tn5 transposase, FFPE-adapted Tn5 [1] |
| Cell Barcoding | Label molecules with cell-specific barcodes | 10X Barcoded Gel Beads, custom barcoding oligos |
| Library Preparation | Prepare sequencing libraries | Chromium Single Cell ATAC Kit (10x Genomics #1000390) [78], Chromium Single Cell Immune Profiling Solution Kit (10x Genomics #1000263) [78] |
| DNA Damage Rescue | Overcome formalin-induced fragmentation | T7 promoter-mediated rescue, in vitro transcription [1] |
Applications in Disease Research
The integration of chromatin accessibility and gene expression has yielded significant insights into disease mechanisms, particularly in cancer. In t(8;21) acute myeloid leukemia (AML), multi-omic single-cell analysis revealed TCF12 as the most active transcription factor in blast cells, driving a universally repressed chromatin state [78]. The approach further identified two functionally distinct T-cell subsets, with EOMES-mediated transcriptional regulation promoting the expansion of a cytotoxic T-cell population characterized by increased clonality and drug resistance [78]. Additionally, researchers discovered a novel leukemic CMP-like cluster marked by high TPSAB1, HPGD, and FCER1A expression, demonstrating how multi-omics integration can uncover previously unrecognized disease-associated cell states [78].
In solid tumors, application of scFFPE-ATAC to lung cancer FFPE tissues revealed distinct regulatory trajectories between the tumor center and invasive edge, uncovering spatially distinct epigenetic regulators and two developmental paths from tumor center to invasive edge, each enriched for unique gene regulatory programs [1]. Analysis of archived follicular lymphoma and transformed diffuse large B-cell lymphoma samples identified relapse- and transformation-associated epigenetic dynamics, highlighting the clinical potential of multi-omics approaches for understanding tumor evolution [1].
The integration of single-cell chromatin accessibility and gene expression data represents a transformative approach for unraveling the regulatory logic underlying cellular heterogeneity. The protocols detailed in this Application Note provide a robust framework for generating and analyzing multi-omics data, from experimental sample preparation through computational integration and biological interpretation. As these methods continue to mature, they promise to accelerate both basic research into gene regulatory mechanisms and clinical translation for complex diseases, particularly through the ability to leverage vast archives of FFPE specimens [1]. The ongoing development of more scalable, accurate, and robust integration algorithms will further enhance our capacity to extract meaningful biological insights from these complex data modalities, ultimately advancing drug development and personalized medicine.
The evolution of single-cell Assay for Transposase-Accessible Chromatin using sequencing (scATAC-seq) has fundamentally transformed our capacity to decipher the epigenetic landscape of individual cells. As a cornerstone of a broader thesis on chromatin accessibility profiling, this document delineates the trajectory of scATAC-seq, focusing on three pivotal frontiers that will dictate its future impact: enhancing scalability to millions of cells, integrating multi-omic datasets for a unified view of cellular function, and overcoming barriers to clinical translation. The convergence of novel experimental protocols and sophisticated computational frameworks is paving the way for scATAC-seq to move from a specialized tool to a ubiquitous component of biological and clinical research.
Scaling scATAC-Seq to Million-Cell Experiments
The drive to create comprehensive atlases of cellular states in complex tissues and during dynamic processes demands technologies that can profile millions of cells. Recent advancements are addressing this need through innovations in both experimental and computational scalability.
Ultra-High-Throughput Experimental Methods
The development of single-cell ultra-high-throughput multiplexed sequencing (SUM-seq) represents a significant leap forward [79]. This method leverages a two-step combinatorial indexing approach to co-assay chromatin accessibility and gene expression in single nuclei, enabling the profiling of hundreds of samples at a scale of up to millions of cells.
Table 1: Key Performance Metrics of High-Throughput scATAC-seq Methods
| Method | Throughput | Multiplexing Capacity | Key Innovation | Data Quality (Fragments in Peaks per Cell) |
|---|---|---|---|---|
| SUM-seq [79] | Up to 1.5 million cells per 10x channel | Hundreds of samples | Combinatorial indexing for RNA & ATAC; droplet overloading | ~11,900 |
| scFFPE-ATAC [1] | High-throughput (56 million barcodes/run) | Not Specified | FFPE-adapted Tn5, T7-mediated DNA repair, in vitro transcription | Robust for archived samples |
| Multiplexed scATAC-seq [13] | Standard 10x throughput | 10+ samples via Tn5 barcoding | Custom Tn5 barcodes for sample pooling | Maintained with 0.1% formaldehyde fixation |
Experimental Protocol: SUM-seq Workflow [79]
- Nuclei Isolation & Fixation: Isolate nuclei and fix with glyoxal.
- Combinatorial Indexing:
- ATAC Indexing: Use Tn5 transposase pre-loaded with barcoded oligos to tagment accessible chromatin.
- RNA Indexing: Perform reverse transcription with barcoded oligo-dT primers to index mRNA.
- Sample Pooling: Pool all indexed samples.
- Microfluidic Barcoding: Overload pooled nuclei into a microfluidic system (e.g., 10x Chromium), delivering a second, droplet-specific barcode to fragments within each droplet. Strategies like adding a blocking oligonucleotide and reducing linear amplification cycles are critical to minimize barcode hopping [79].
- Library Preparation: Break droplets, pre-amplify both modalities, and split the library for modality-specific amplification and sequencing.
Computational Ecosystems for Scalable Analysis
The analysis of million-cell datasets requires equally scalable computational infrastructure. The expansion of the scverse ecosystem with new core packages is critical to this effort [80].
- SnapATAC2: Enables fast, scalable analysis of single-cell epigenomic data. Built in Rust with a Python front end, it handles millions of cells efficiently for preprocessing, dimensionality reduction, clustering, and visualization, storing all outputs in the standardized AnnData format [80].
- rapids-singlecell: Accelerates the entire single-cell analysis pipeline through GPU acceleration, using CuPy and NVIDIA RAPIDS. It offers near drop-in replacements for CPU-based functions, scaling to millions of cells without computational bottlenecks [80].
Multi-omic Integration for Unveiling Gene Regulatory Networks
A central goal of modern biology is to understand how information flows from regulatory DNA elements to RNA and protein. scATAC-seq is increasingly deployed as part of integrated multi-omic strategies to build this unified picture.
Multi-omic Technologies and Analytical Frameworks
SUM-seq, by simultaneously profiling chromatin accessibility and gene expression in the same nucleus, directly links enhancers to their potential target genes, enabling the inference of enhancer-mediated gene regulatory networks (eGRNs) across complex processes like cell differentiation and immune activation [79]. For datasets where different omics are profiled in different cells, computational integration is required. scMODAL is a deep learning framework designed for this "diagonal integration" [81]. It uses neural networks and generative adversarial networks (GANs) to project different single-cell datasets (e.g., scATAC-seq and scRNA-seq) into a common latent space, leveraging known positively correlated feature links (e.g., gene expression and its chromatin-based gene activity score) to guide the alignment while preserving biological variation.
Application: Deciphering Cancer Regulatory Elements
A multi-omic analysis integrating scATAC-seq and scRNA-seq data from eight different carcinoma tissues revealed distinct cancer gene regulation and genetic risks [40]. This study identified cell-type-associated transcription factors (TFs), such as the TEAD family, which widely control cancer-related signaling pathways in tumor cells [40]. In colon cancer, this approach pinpointed tumor-specific TFs—CEBPG, LEF1, SOX4, TCF7, and TEAD4—that are more highly activated in tumor cells than in normal epithelial cells, representing potential therapeutic targets [40].
Experimental Protocol: Multi-omic Analysis of Carcinoma Tissues [40]
- Data Curation: Collect scATAC-seq and scRNA-seq data from the same tumor samples (e.g., breast, colon, lung cancer).
- Quality Control & Preprocessing:
- scATAC-seq: Use Signac R package. Filter low-quality cells (nCountpeaks >2000 and <30,000; nucleosome signal <4; TSS enrichment >2). Call peaks using MACS2.
- scRNA-seq: Use Seurat R package. Filter low-quality cells (nFeatureRNA >500 and <6000; percent mitochondria <25). Remove doublets with DoubletFinder.
- Data Integration & Harmonization: Use Harmony algorithm to remove batch effects and integrate datasets from different studies.
- Network Construction & Analysis: Calculate a gene activity matrix from scATAC-seq peaks and link accessible chromatin regions to potential target genes. Identify differentially accessible regions and active TFs to construct peak-gene regulatory networks.
Clinical Translation and Analysis of Archived Specimens
A paramount challenge in biomedical research is translating powerful technologies like scATAC-seq to the clinical realm, where samples are routinely preserved as formalin-fixed paraffin-embedded (FFPE) blocks.
Enabling Epigenetic Profiling of FFPE Samples
scFFPE-ATAC is a groundbreaking technology designed to overcome the extensive DNA damage caused by formalin fixation, thereby enabling high-throughput single-cell chromatin accessibility profiling in FFPE samples [1]. Its key innovations include an FFPE-adapted Tn5 transposase, ultra-high-throughput DNA barcoding, T7 promoter-mediated DNA damage rescue, and in vitro transcription. This method has been successfully applied to human lymph node samples archived for 8–12 years and to lung cancer FFPE tissues, revealing distinct regulatory trajectories between the tumor center and invasive edge, as well as epigenetic dynamics associated with lymphoma relapse and transformation [1].
Standardization and Preservation for Reproducible Clinical Research
To enhance reproducibility and facilitate complex clinical study designs, robust sample preservation strategies are essential. A optimized workflow demonstrates that mild formaldehyde fixation (0.1%) combined with cryopreservation yields both bulk and single-cell ATAC-seq data quality comparable to fresh samples [13]. This approach maintains key metrics such as FRiP score, TSS enrichment, and nucleosomal patterning, and is fully compatible with transposase-based multiplexing.
Experimental Protocol: scFFPE-ATAC for Archived Clinical Samples [1]
- Nuclei Isolation from FFPE: Section FFPE blocks and deparaffinize. Follow optimized protocols for proteinase K digestion and reverse cross-linking to isolate nuclei.
- Debris Removal: Employ a fine density gradient centrifugation (25%-36%-48%) to separate pure nuclei (top layer) from cellular debris (bottom layer), a critical step specific to FFPE samples.
- scFFPE-ATAC Library Preparation:
- Use the specialized FFPE-Tn5 transposase for tagmentation.
- Implement T7 promoter-mediated DNA damage rescue and in vitro transcription to amplify and sequence the damaged and fragmented DNA.
- Sequencing & Analysis: Sequence the libraries and process the data through a standard scATAC-seq pipeline to identify cell populations and differentially accessible regions.
Table 2: Key Research Reagent Solutions for Advanced scATAC-seq Applications
| Reagent / Material | Function | Application Context |
|---|---|---|
| FFPE-adapted Tn5 Transposase [1] | Tagments damaged, cross-linked DNA from FFPE archives | Clinical Translation (scFFPE-ATAC) |
| Custom Barcoded Tn5 Complexes [13] | Enables sample multiplexing by pre-indexing during tagmentation | Scalability & Cost Reduction |
| Glyoxal Fixative [79] | Reversible fixation for nuclei preservation in multiplexing studies | Scalability (SUM-seq) |
| 0.1% Formaldehyde Fixative [13] | Mild fixation for chromatin structure preservation without compromising data quality | Sample Preservation & Standardization |
| PEG (Polyethylene Glycol) [79] | Added to reverse transcription reaction to increase UMI and gene detection in multi-omics | Multi-omic Profiling (SUM-seq) |
Conclusion
Single-cell ATAC-seq has fundamentally expanded our ability to decipher the epigenetic code governing cellular diversity in health and disease. By enabling high-resolution mapping of chromatin accessibility landscapes, this technology provides unprecedented insights into regulatory mechanisms underlying cancer progression, neurological disorders, and immune dysfunction. The ongoing refinement of experimental protocols and computational methods addresses initial challenges of data sparsity and complexity, while systematic benchmarking guides optimal technology selection. As scATAC-seq continues to evolve toward higher throughput, lower cost, and multi-omic integration, its application in defining cellular trajectories, identifying novel therapeutic targets, and developing epigenetic biomarkers promises to accelerate both fundamental biological discovery and precision medicine initiatives. The convergence of robust experimental frameworks with advanced analytical pipelines positions scATAC-seq as an indispensable tool for the next generation of biomedical research.
References
- 1. scFFPE-ATAC enables high-throughput single cell ... [https://www.nature.com/articles/s41467-025-66170-4]
- 2. From reads to insight: a hitchhiker's guide to ATAC-seq data ... [https://genomebiology.biomedcentral.com/articles/10.1186/s13059-020-1929-3]
- 3. Single-cell chromatin accessibility reveals principles of ... [https://pmc.ncbi.nlm.nih.gov/articles/PMC4685948/]
- 4. Chromatin accessibility variation provides insights into ... [https://elifesciences.org/reviewed-preprints/98289v2]
- 5. Genetic effects on chromatin accessibility uncover ... - PubMed [https://pubmed.ncbi.nlm.nih.gov/40393811/]
- 6. Chromatin-accessibility estimation from single-cell ATAC- ... [https://www.nature.com/articles/s41467-021-26530-2]
- 7. The applications of single-cell multiomics in drug screening [https://www.sciencedirect.com/science/article/pii/S2773216925000285]
- 8. Chromatin accessibility profiling by ATAC-seq - PubMed Central [https://pmc.ncbi.nlm.nih.gov/articles/PMC9189070/]
- 9. scATAC-seq generates more accurate and complete ... [https://www.nature.com/articles/s41598-025-87351-7]
- 10. Applications of ATAC-seq [https://www.cd-genomics.com/epigenetics/resource-applications-of-atac-seq.html]
- 11. High-capacity sample multiplexing for single cell chromatin ... [https://bmcgenomics.biomedcentral.com/articles/10.1186/s12864-023-09832-1]
- 12. A hierarchical, count-based model highlights challenges in ... [https://genomebiology.biomedcentral.com/articles/10.1186/s13059-025-03735-y]
- 13. Enhancing single-cell ATAC sequencing with ... [https://pmc.ncbi.nlm.nih.gov/articles/PMC12538879/]
- 14. Comprehensive analysis of single cell ATAC-seq data with ... [https://www.nature.com/articles/s41467-021-21583-9]
- 15. Systematic benchmarking of single-cell ATAC-sequencing ... [https://www.nature.com/articles/s41587-023-01881-x]
- 16. Atlas-scale single-cell chromatin accessibility using ... [https://pmc.ncbi.nlm.nih.gov/articles/PMC10069466/]
- 17. UDA-seq: universal droplet microfluidics-based ... [https://www.nature.com/articles/s41592-024-02586-y]
- 18. A combinatorial indexing strategy for low-cost epigenomic ... [https://www.sciencedirect.com/science/article/pii/S2590346222000554]
- 19. A rapid and robust method for single cell chromatin ... [https://www.nature.com/articles/s41467-018-07771-0]
- 20. Microfluidics and Single-Cell Analysis: Revolutionizing ... [https://www.medicalmicromolding.com/microfluidics-and-single-cell-analysis-revolutionizing-precision-biology/]
- 21. Fundamental and practical approaches for single-cell ATAC ... [https://pmc.ncbi.nlm.nih.gov/articles/PMC9590475/]
- 22. Joint analysis of chromatin accessibility and gene ... [https://www.sciencedirect.com/science/article/pii/S2405471225000997]
- 23. Lineage-specific and single cell chromatin accessibility ... [https://pmc.ncbi.nlm.nih.gov/articles/PMC5042844/]
- 24. Single-cell systems pharmacology identifies development ... [https://pmc.ncbi.nlm.nih.gov/articles/PMC11008188/]
- 25. Assessment of computational methods for the analysis of ... [https://genomebiology.biomedcentral.com/articles/10.1186/s13059-019-1854-5]
- 26. Demonstrated Protocol for Nuclei Isolation for Single Cell ... [https://www.10xgenomics.com/blog/demonstrated-protocol-for-nuclei-isolation-for-single-cell-atac-solution]
- 27. High-throughput chromatin accessibility profiling at single-cell ... [https://pmc.ncbi.nlm.nih.gov/articles/PMC6128862/]
- 28. Ten(10)X-compatible Combinatorial Indexing ATAC ... [https://www.protocols.io/view/ten-10-x-compatible-combinatorial-indexing-atac-se-c3urynv6.html]
- 29. Protocol for single-cell ATAC sequencing using combinatorial ... [https://pubmed.ncbi.nlm.nih.gov/34142101/]
- 30. Sequencing Requirements for Single Cell ATAC [https://www.10xgenomics.com/support/epi-atac/documentation/steps/sequencing/sequencing-requirements-for-single-cell-atac]
- 31. Using the ICELL8 system for single-cell ATAC-Seq: protocol [https://www.takarabio.com/learning-centers/automation-systems/icell8-introduction/atac-seq-protocol?srsltid=AfmBOorhdPjmnjo26YtDeE85V9pMSMMaE0vWuRzpxBQbnRL5ZeIXyp-P]
- 32. Single cell transcriptional and chromatin accessibility ... [https://www.nature.com/articles/s41467-021-22368-w]
- 33. Intratumor heterogeneity: the Rosetta stone of therapy ... [https://pmc.ncbi.nlm.nih.gov/articles/PMC7181408/]
- 34. A drop-based workflow for fast and robust joint profiling ... [https://pmc.ncbi.nlm.nih.gov/articles/PMC12599661/]
- 35. Integrated single-cell analysis reveals distinct epigenetic ... [https://genomemedicine.biomedcentral.com/articles/10.1186/s13073-024-01407-3]
- 36. Analyzing PBMC scATAC-seq • Signac [https://stuartlab.org/signac/articles/pbmc_vignette.html]
- 37. Integrated single-cell and bulk gene expression and ATAC ... [https://pmc.ncbi.nlm.nih.gov/articles/PMC7341752/]
- 38. Chapter 8 Color Palette | Single Cell Multi-Omics Data ... [https://bookdown.org/ytliu13207/SingleCellMultiOmicsDataAnalysis/color-palette.html]
- 39. Deciphering cancer therapy resistance via patient-level ... [https://www.nature.com/articles/s42003-025-08457-2]
- 40. Single-cell multi-omics analysis reveals cancer regulatory ... [https://www.nature.com/articles/s41419-025-08060-7]
- 41. Leveraging single-cell ATAC-seq and RNA-seq to identify ... [https://www.nature.com/articles/s41467-024-44742-0]
- 42. The molecular landscape of neurological disorders: insights ... [https://pmc.ncbi.nlm.nih.gov/articles/PMC10652629/]
- 43. Definition of regulatory elements and transcription factors ... [https://www.sciencedirect.com/science/article/pii/S0888754324001654]
- 44. Application of single-cell RNA sequencing methods to ... [https://pmc.ncbi.nlm.nih.gov/articles/PMC10382068/]
- 45. Epigenetic modulation in cancer drug discovery [https://pubmed.ncbi.nlm.nih.gov/40890561/]
- 46. Drug development single-cell sequencing [https://www.scdiscoveries.com/applications/drug-development/]
- 47. Applications of single-cell RNA sequencing in drug discovery ... [https://pmc.ncbi.nlm.nih.gov/articles/PMC10141847/]
- 48. Chromatin accessibility profiling methods - PubMed Central [https://pmc.ncbi.nlm.nih.gov/articles/PMC10895463/]
- 49. Chapter 10 Trajectory Analysis | Advanced Single-Cell ... [https://bioconductor.org/books/3.14/OSCA.advanced/trajectory-analysis.html]
- 50. Combined single-cell profiling of chromatin–transcriptome ... [https://www.nature.com/articles/s41587-025-02734-5]
- 51. Single-cell lineage tracing techniques in hematology [https://translational-medicine.biomedcentral.com/articles/10.1186/s12967-025-06318-4]
- 52. CellTrackVis: interactive browser-based visualization for ... [https://pmc.ncbi.nlm.nih.gov/articles/PMC10053428/]
- 53. Single-cell ATAC sequencing analysis [https://pmc.ncbi.nlm.nih.gov/articles/PMC7327298/]
- 54. Comprehensive noise reduction in single-cell data with the ... [https://www.sciencedirect.com/science/article/pii/S2667237525002140]
- 55. Single-Cell ATAC-Seq FAQs | GENEWIZ from Azenta [https://web.genewiz.com/faqs/single-cell-atac-seq]
- 56. 24. Quality Control [https://www.sc-best-practices.org/chromatin_accessibility/quality_control.html]
- 57. How to Isolate Nuclei for Single Cell Methods [https://singleron.bio/how-to-isolate-nuclei-for-single-cell-methods/]
- 58. Quality control of single-cell ATAC-seq data without peak ... [https://pubmed.ncbi.nlm.nih.gov/40791457/]
- 59. Application of computational algorithms for single-cell RNA ... [https://pmc.ncbi.nlm.nih.gov/articles/PMC11735751/]
- 60. Comprehensive analysis of single cell ATAC-seq data with ... [https://pmc.ncbi.nlm.nih.gov/articles/PMC7910485/]
- 61. scFFPE-ATAC for high-throughput single cell chromatin ... [https://www.protocols.io/view/scffpe-atac-for-high-throughput-single-cell-chroma-g6ntbzdep.html]
- 62. Benchmarking computational single cell ATAC-seq methods [https://github.com/pinellolab/scATAC-benchmarking]
- 63. cis-regulatory topic modeling on single-cell ATAC-seq data [https://pubmed.ncbi.nlm.nih.gov/30962623/]
- 64. chromVAR: Inferring transcription factor-associated ... [https://pmc.ncbi.nlm.nih.gov/articles/PMC5623146/]
- 65. Benchmarking computational methods for single-cell ... [https://genomebiology.biomedcentral.com/articles/10.1186/s13059-024-03356-x]
- 66. Protocol for conducting a single-cell sequencing assay ... [https://pmc.ncbi.nlm.nih.gov/articles/PMC12305206/]
- 67. Spatial profiling of chromatin accessibility in formalin-fixed ... [https://pmc.ncbi.nlm.nih.gov/articles/PMC12217551/]
- 68. Solid-phase capture and profiling of open chromatin by ... [https://www.nature.com/articles/s41587-022-01603-9]
- 69. scFFPE-ATAC enables high-throughput single cell chromatin ... [https://pmc.ncbi.nlm.nih.gov/articles/PMC12618699/]
- 70. Review Single-cell ATAC sequencing analysis: From data ... [https://www.sciencedirect.com/science/article/pii/S2001037020303019]
- 71. Protocol for single-cell ATAC sequencing using ... [https://pmc.ncbi.nlm.nih.gov/articles/PMC8185305/]
- 72. Best practices for differential accessibility analysis in single ... [https://www.nature.com/articles/s41467-024-53089-5]
- 73. txci-ATAC-seq: a massive-scale single-cell technique to profile ... [https://genomebiology.biomedcentral.com/articles/10.1186/s13059-023-03150-1]
- 74. Advances in single-cell omics and multiomics for high- ... [https://pmc.ncbi.nlm.nih.gov/articles/PMC10984936/]
- 75. Multi-omics single-cell data integration and regulatory ... [https://www.nature.com/articles/s41587-022-01284-4]
- 76. Benchmarking multi-omics integration algorithms across ... [https://pmc.ncbi.nlm.nih.gov/articles/PMC10944570/]
- 77. Single-cell multi-ome regression models identify functional ... [https://www.nature.com/articles/s41588-024-01689-8]
- 78. A multi-omic single-cell landscape reveals transcription and ... [https://translational-medicine.biomedcentral.com/articles/10.1186/s12967-025-06659-0]
- 79. Single-cell ultra-high-throughput multiplexed chromatin ... [https://www.nature.com/articles/s41592-025-02700-8]
- 80. Four new scverse core packages [https://scverse.org/blog/2025-core-expansion/]
- 81. scMODAL: a general deep learning framework for ... [https://www.nature.com/articles/s41467-025-60333-z]